
2.2: In-lab Exercises
- Page ID
- 47355

Coherence and Interferometry
2.1 Mach-Zehnder Interferometer
You should find the Mach-Zehnder interferometer already set up and aligned. The instrument should be adjusted such that a uniform intensity pattern is produced on the screen (essentially no fringes). Make sure that the input He-Ne laser beam is well collimated by measuring the dimensions of the auxiliary output beam near the instrument and several meters away (the beam diameter should be roughly the same at both positions).
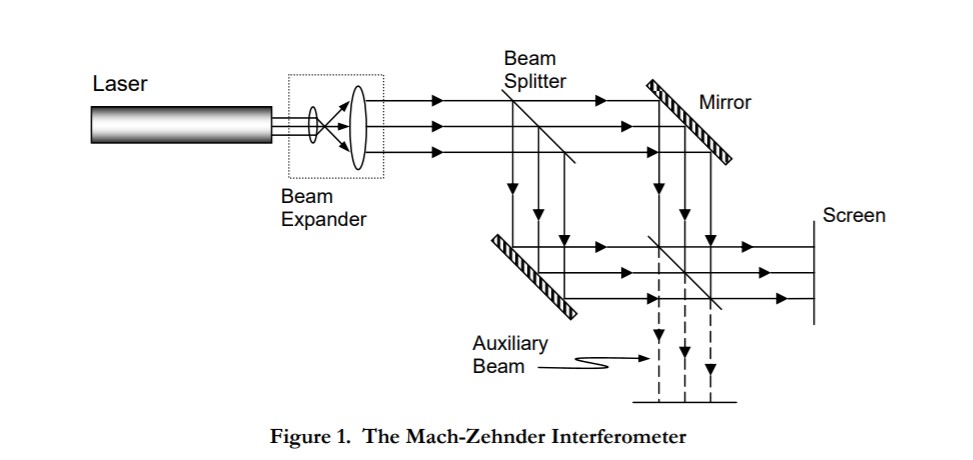
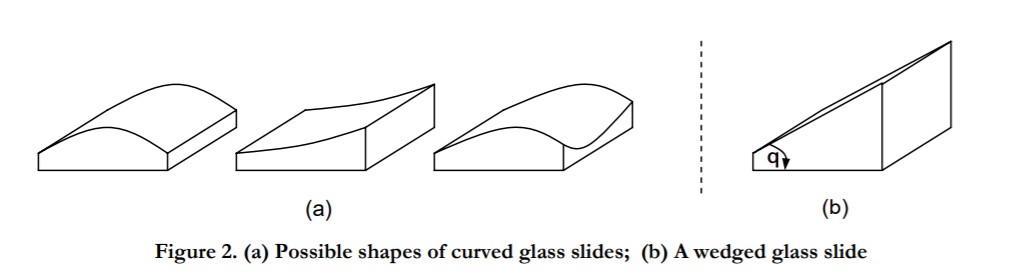
For this exercise, we will work with a glass slide (about 2mm thick) that has negligible curvature, and therefore we shall approximate the surfaces of the slide as planar, but non-parallel. The slide, therefore, has the shape of a wedge as illustrated in Figure 2 (b). Now, insert the given microscope slide into the mount, and place the mount in one of the arms of the interferometer.
- In your notebook, make a sketch of the fringes on the screen, measure the spacing between the dark fringes and label your sketch with the distances (spacings) you measured.
- Use your data to calculate the parallelism of the glass slide. That is, determine the angle θ between the surfaces of the wedge (the wavelength of the He-Ne laser light is 632.8 nm).
- By now you should have observed that the two output beams of the Mach-Zehnder interferometer are complementary. Explain with the aid of the previous diagram and your knowledge of phase changes on reflection from surfaces why this is so.
2.2 Flatness Measurements
Normally, we think of a glass slide as a thin slab with boundaries defined by two perfectly parallel planes. Of course, in reality this is not the case. The glass-air boundaries may be curved, undulating, or planar, and in general are not parallel. Curvature may be in one or many directions as illustrated in Figs. 2 (a) and 2 (b).
The goal of this experiment is to qualitatively determine the surface flatness of a number of glass-slide samples. The equipment to be used includes a sodium vapor lamp (quasi-monochromatic source), a reference flat (glass block with a reference surface of known flatness), lens paper, and the samples to be studied. The setup is as illustrated in Figure 3.
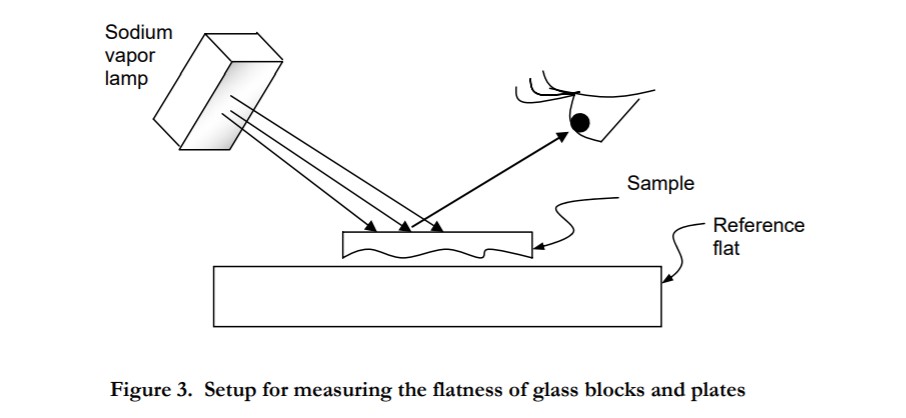
Place the surface of the sample to be measured against the reference flat and illuminate the assembly with the sodium lamp. You should observe a distinct set of fringes, which illustrate the relative flatness of the surface of the sample, assuming the reference flat is perfectly flat. Dust and other foreign particles between the two surfaces will lead to a wedge of air between the sample and the flat and to a fine fringe pattern that will be difficult to interpret. If this occurs, place a sheet of clean lens paper between the two surfaces and slowly drag the lens paper out from between the surfaces. This should remove most of the loose dust particles. Rotate the sample slowly until the widest possible spacing between the fringes is obtained.
For (a) the plexiglass triangular block (b) the rectangular glass block, (c) the wedged glass block, and (d) the thick circular glass disc:
- Sketch and describe in your notebook the fringes you get for each of the four samples.
- Interpret the fringes in the context of the flatness of the surfaces by drawing pictures in your notebook of the surface profiles, and
- Rank the four samples in increasing order of flatness.
2.3 Parallelism Measurements
Several numbered thin cover glass slides (about a dozen) are provided. A simple qualitative method of quickly establishing parallelism of the glass slides involves the examination of Haidinger fringes as described next. Place several of the thin glass slides on the clean sheet of paper, which lies on the small low table. Stand upright over the glass slides with the sodium light next to your forehead and illuminate the glass slides so that interference patterns are observed for each glass side. By comparing the interference patterns (Haidinger fringes) identify: (a) the most plane parallel, and (b) the least plane parallel glass slide. Write the numbers of the two slides in your notebook. Explain to the TA how you arrived at your choice and have the TA sign your notebook.
- Explain how Haidinger fringes are formed.
- What should the Haidinger fringe pattern look like for a perfectly parallel glass slide?
2.4 Multiple Beam Interferometry with a Thin Glass Plate
In this experiment, we will attempt to observe the gross features of multiple-beam interference as described theoretically in the notes. The setup to be used is shown in Fig. 4. It consists of a thin glass plate (Corning #1 cover glass slide) that is mounted on a rotary table such that it can be illuminated with collimated He-Ne laser light (λ = 0.6328 µm) at varying angles of incidence (the setup uses an unexpanded He-Ne laser beam that is about 2 mm in diameter). Two screens are used to view the reflected and transmitted interference patterns. The thickness of the plate is about 150 mm.
We will vary the external angle of incidence, qi , by rotating the glass slide using the rotary table, and observe the interference patterns on the screens. Note that the range of qt (the internal angle) is limited from 0 to qc, the critical angle. Unfortunately, varying qi causes both d, the path difference between successive emerging beams, and R, the surface reflectivity, to change at the same time. However, in this experiment it is still possible to observe the effect of varying R on the sharpness (separation/width) of the fringes. Varying d simply brings fringes of different order into view; these may be spaced closer or farther apart on the screen depending on qi .
Specifically, you should observe that for small values of qi , R is small, and so the finesse, F, is low -- hence, one cannot tell whether the pattern consists of bright fringes on dark background or vice-versa. However, as qi increases, R increases and, therefore, the finesse and the fringe contrast increases. Since the general tendency must be an increase in reflectance (reduction in transmittance) as qi is increased, the reflected beam will, therefore, contain most of the energy when the finesse is high except at such angles where this condition is violated by destructive interference. Hence the reflected beam will consist of dark fringes on a bright background.
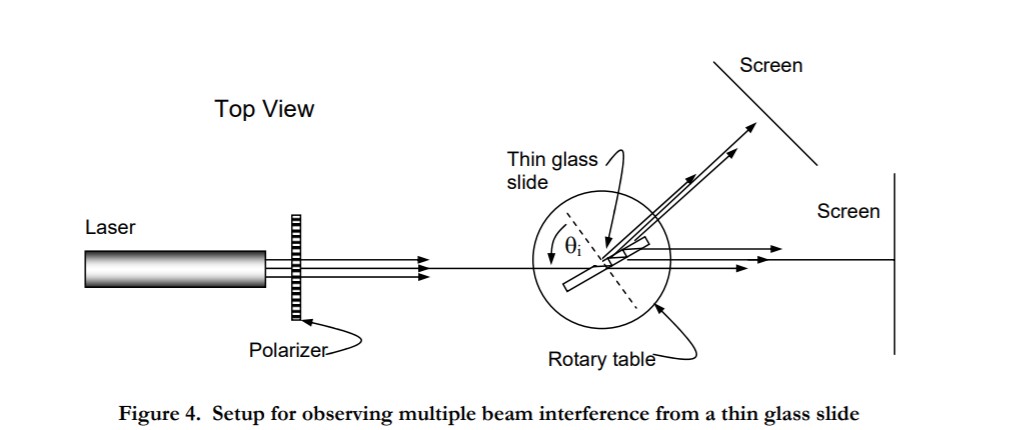
- With the laser beam incident on the region near the center of the plate, rotate the plate, and with the polarizer axis vertical (TE wave), rotate the glass plate and observe the transmitted and reflected beams on the screens. In particular, note the angular separation of the fringes in the reflected beam for each of the following excitation conditions: (i) just above normal incidence, (ii) in the neighborhood of 45º angle of incidence, and (iii) near grazing incidence. Which of the three positions gives the smallest fringe separation? Why? [Hint: consider dd/dq].
- Explain why near grazing incidence the reflected interference pattern consists of dark fringes on a bright background, while near normal incidence the pattern could be interpreted as either dark fringes on a bright background or vice versa.
- What important statements can you make concerning the complementarities of the reflected and transmitted beams? Justify your statements.
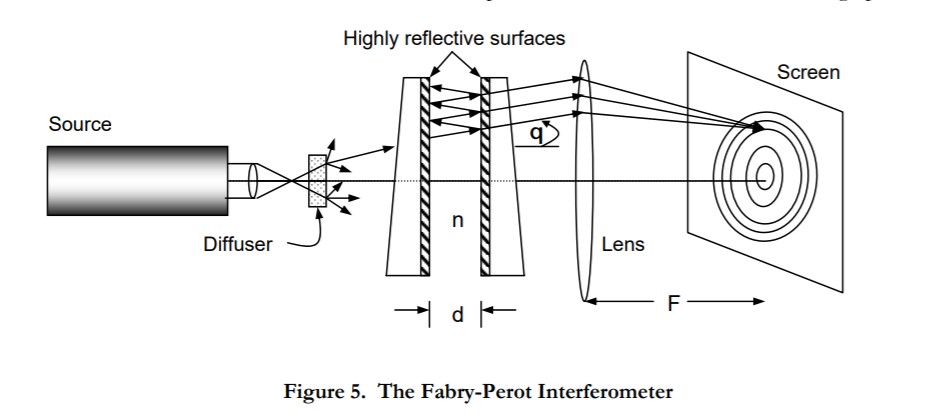
2.5 Fabry-Perot Interferometer
The setup for the Fabry-Perot interferometer is shown in Figure 5. You will the instrument already set up and aligned when you enter the Lab. If a well-defined circular fringe pattern is not observed on the screen, remove the diffuser and adjust one of the mirror micrometers so that the beam does not "walk off" to one side of the instrument, and then replace the diffuser. A circular fringe pattern should now be observed on the screen. Place the screen in the focal plane of the lens, and observe the fringe pattern.
- Tape a sheet of paper (your personal screen) over the screen, trace out the first few innermost fringes, and paste your personal screen into your notebook. Measure the distance F.
- Record your data, from part (a), for the measured fringe positions, calculated angular positions, and their orders (…m-1, m, m+1…) in tabular form in your notebook. Label your sketch with the measured angles.
- Write the condition for a bright maximum.
- Explain why circular fringes are obtained.
- From the data in (a) determine the order of interference of the innermost bright ring and the thickness d of the air gap. Hint: Since each circular fringe is characterized by its own m and q, by taking measurements on two fringes (preferably not adjacent) and noting that for the pair you can write
m1λ = 2nd cosq1 and m2λ = (m1 - Dm) λ = 2nd cosq2
where Dm is the difference in order between the two fringes, it then becomes possible to solve for d and m1.
2.6 Lummer-Gehrcke Interferometer
The Lummer-Gehrcke interferometer is illustrated in Figure 6. In our case, it is a thin glass plate with a light-coupling prism cemented onto one end of the plate. You will find the interferometer sitting on a heavy metal block, and the laser on a lab jack. Under no circumstances should you touch the interferometer. The plate is very fragile and, furthermore, fingerprints seriously degrade its performance.
In order to accurately measure the angular positions of the fringes, the reference point b on the screen (where the top plane of the interferometer intersects the screen) must be found. This point is found by adjusting the height and angle of the laser beam so it just grazes the top surface of the interferometer along the entire length of the plate, and identifying the point b where the laser beam strikes the screen. Tape a sheet of paper (your personal screen) over the screen and mark the point b. The accuracy of your final results will depend critically on how well you were able to find the point b.
With the laser beam still grazing the plate, place the lens at the end of the plate as shown in the diagram, and adjust the position of the lens so that the beam hits the same point b on the screen. This assures that the axis of the lens lies on the top surface of the plate. The screen should also be positioned one focal length behind the lens.
Now lower the lab jack back to its normal position so that the laser light is coupled into the plate via the prism. Adjust the laser beam so that the light reflected from the back of the prism returns close its original path back to the laser.
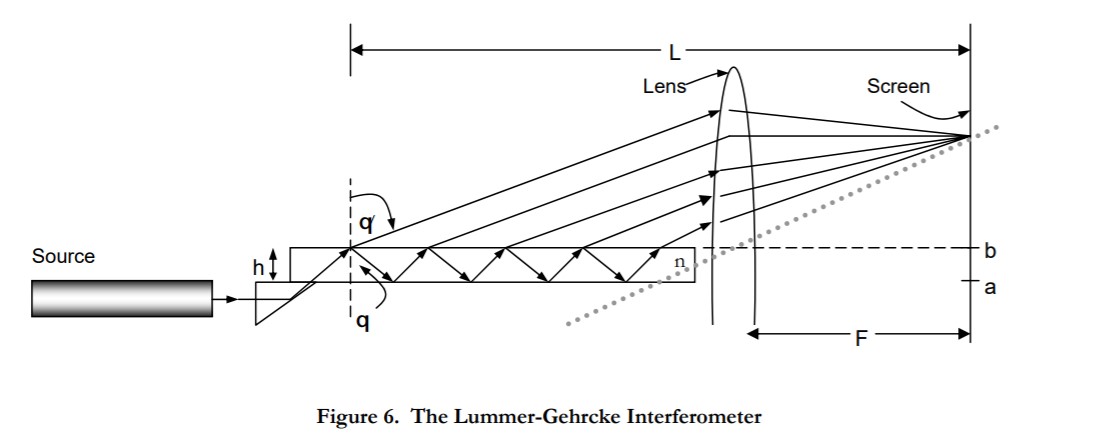
- On your personal screen mark the location of at least the first six fringes above the point b. Measure the distance F (the focal length of the lens). This should also be the position where the fringes are sharpest. In your lab notebook make a table of the fringe positions, their calculated angular positions, their orders (…, m-1, m, m+1, …) for the first 6 fringes.
- Assuming that with the lens each fringe is formed by interference between successive emerging beams with the same value of q, write the interference condition for a bright fringe.
- From your data determine: (a) the order of interference, for the first bright fringe above the point b, and (b) the index of refraction of the glass at 632.8nm. Assume that the thickness of the plate is 150 mm.
- Remove the lens and re-record the position of the fringes. Explain the role of the lens in the previous setup, and the observed differences between the fringe pattern with the lens in place and the pattern without the lens. Under what conditions would the two patterns yield the same angular data for the position of the fringes?
- Although the He-Ne laser is fairly well collimated, the interference pattern in our LummerGehrcke interferometer is visible over a considerable range of exit angles. Explain why.
- If a thin, isotropic film of refractive index n2 and thickness t2, where t2 is much larger than the penetration depth, was deposited on the plate, what would be the new condition for interference? Draw a new ray optics picture to help you see what is going on. How would you expect the fringe pattern to change?
- The plate thickness of your interferometer is about 33 times less than that of the original instrument of the 1920’s. Using the results of (f), which interferometer has the higher resolution [(Dqm)/Dt2] when used for measuring thickness and index of refraction of thin films placed on the plate? (See C. Warde, Applied Optics l5, 2730 (1976))
2.7 Michelson Interferometer (Optional)
Build the interferometer you drew in the pre-lab exercise. Comment on the performance of your interferometer. Did your interferometer operate as you expected? What were some of the difficulties you encountered while aligning it? Explain the operation of the coherence-length detection interferometer to the TA.
If time permits, use your system to record coherence-length data for a diode laser (It is at the TA’s discretion whether or not you take this measurement).
“I often say that when you can measure what you are speaking about, and express it in numbers, you know something about it; but when you cannot measure it, when you cannot express it in numbers, your knowledge is of a meagre and unsatisfactory kind.” -- Lord Kelvin (William Thomson, 1st Baron) (1824-1907) English physicist and mathematician. In: Popular Lectures and Addresses, London, 1889, v. I, p. 73. See also: Life of Lord Kelvin, by S. P. Thompson, 1910, V. 2, p. 792.