
5.2: In-lab Exercises
- Page ID
- 47371

Electro-optic, Acousto-optic and Photorefractive Light Modulation
5.1 Propagation of Light through Anisotropic Crystals
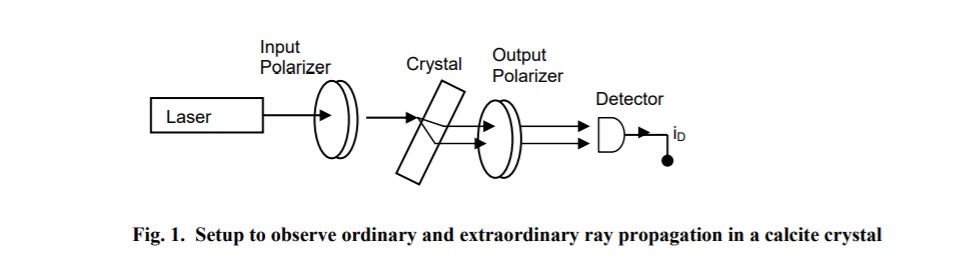
5.1.1 Calcite crystal
- The Calcite crystal has a trapezoidal shape. Place the calcite crystal on a page of printed text and observe the doubly refracted light as evidenced by the existence of two images of the text.
- Place the calcite crystal at an oblique angle between the crossed-polarizer system as shown in Fig.1
- Rotate both the input and output polarizers to see if you can find a joint polarizer orientation that extinguishes one of the two transmitted beams. After you have found this orientation, keep the output polarizer fixed. Now rotate the input polarizer and observe the changes in the intensity of the two transmitted beams. Record your observations in your Lab notebook.
- From your data, determine which beam is the extraordinary ray.
- Is this crystal positive or negative uniaxial? Explain your answer.
5.1.2 Finding the Optical-Axis of a Barium Titanate Crystal
You are provided a barium titanate crystal (BaTiO3) that has a roughly square cross-section. You are also provided 2 sheets of polarizers, and a randomly-polarized light source (an incandescent light bulb).
Barium titanate is an optically anisotropic ferroelectric crystal. The crystal is uniaxial, and so it is characterized by two indices of refraction. The axes of the crystal are labeled, a, b, and c, where the c axis is the axis of highest symmetry (four fold in this case). The c axis is also the ferroelectric axis.
The c axis can be determined by observing the transmission characteristics of the crystal in polarized white light. The setup, which is illustrated in below, consists of a white-light source and a pair of crossed linear polarizers.
The four-fold c-axis is optically isotropic which means that light propagating along the c axis will remain extinguished as the crystal is rotated between the crossed polarizers. In this case, the light "sees" the ordinary refractive index, no, for all orientations of the polarization vector of the light within the a-b plane.
On the other hand, the a and b axes each have two-fold symmetry and light propagating along the a axis will "see" no when it is polarized along b, and nE, the extraordinary refractive index, when it is polarized along c. With the crystal between crossed polarizers and the light propagating along the a or b axis, extinction should occur every time the crystal is rotated by 90± about the propagation direction.
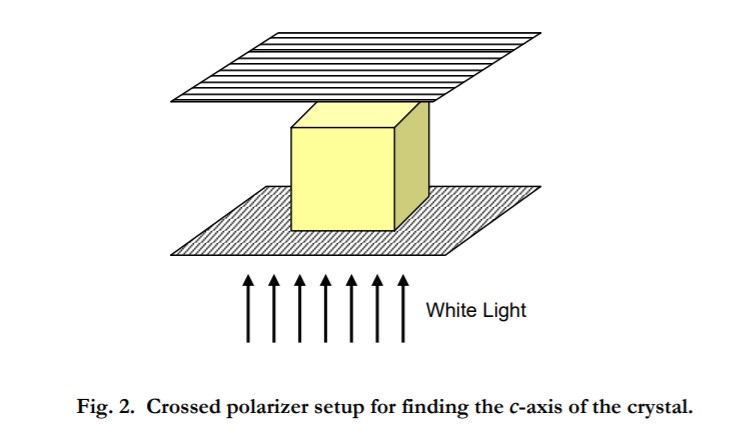
- Find the c axis of the barium titanate crystal by carrying out the procedures described above. Convince the TA or LA that you have found the c-axis.
- Why does light with its k vector parallel to the c-axis of the Barium Titanate crystal remain extinguished as the crystal is rotated about the c-axis between crossed polarizers?
- Why is light with its k vector parallel to the a-axis of the crystal extinguished every time the barium titanate crystal is rotated between crossed polarizers by 90± about the a-axis? In your answer, be sure to explain what happens at intermediate angles of rotation.
- From your answers in (1), (2) and (3), what are the possible crystal symmetries (e.g., cubic, monoclinic, etc.) that would give the same result?
- What are the actual crystal symmetries of Calcite and BaTiO3? What are their permitivity (NOT electro-optic) tensors (this may require a little bit of outside research)?
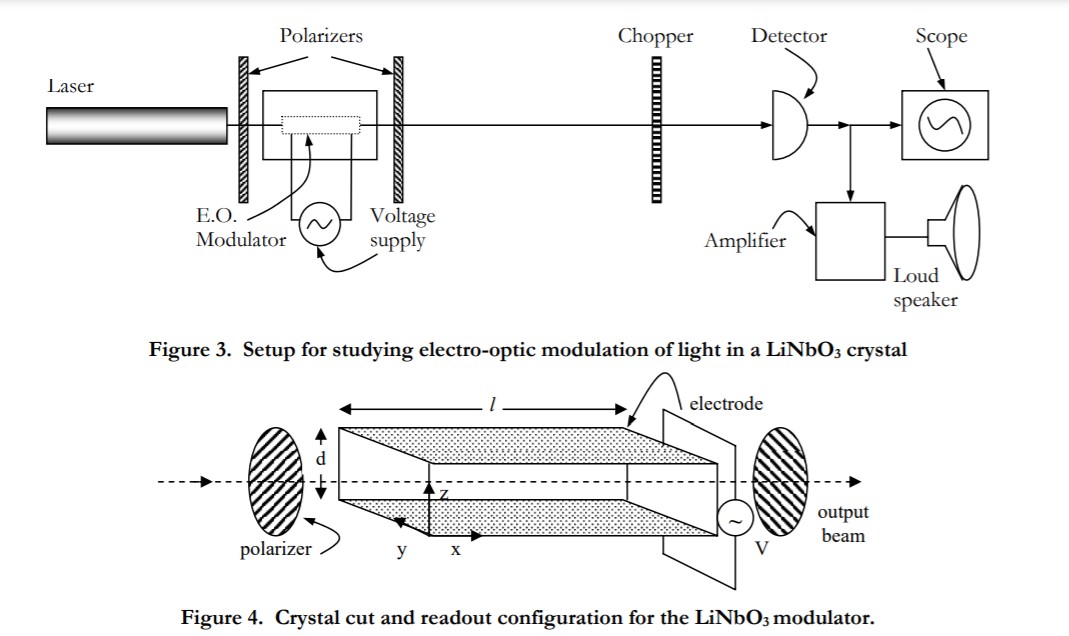
5.2. Electro-optic Modulation
A lithium niobate (LiNbO3) crystal will be used to modulate the intensity of a He-Ne laser beam. The setup is shown in Figure 3.
CAUTION: THE HIGH VOLTAGES APPLIED TO THE MODULATOR CAN BE LETHAL; ALWAYS TURN OFF THE HIGH-VOLTAGE POWER SUPPLY BEFORE TOUCHING MODULATOR OR ATTEMPTING TO DISCONNECT THE WIRES.
5.2.1. Please answer the following questions relating the transverse LiNbO3 Modulator
- What are the approximate numerical values of the refractive indices of the LiNbO3 crystal in the region of the spectrum close to the He-Ne laser wavelength of 633 nm? (You can find this information in Yariv)
- Is it a negative uniaxial or a positive uniaxial crystal?
- Write down the form of the electro-optic tensor for the LiNbO3 crystal clearly showing which tensor elements are zero.
- The crystal cut and readout configuration for your modulator is as shown in Fig. 4. Derive the expression for the phase retardation G = fy - fz.
- The LiNbO3 crystal in your setup is about 2 cm long, what is the calculated half-wave voltage?
5.2.2 Modulator Principal Axes
Before applying voltage to the modulator, make sure the modulator is placed between a pair of crossed polarizers as shown in Fig. 1, and use an unpolarized He-Ne laser beam in the setup to read out the modulator. Keeping the polarizers crossed, slowly rotate them together about the propagation direction in increments of about 5± and observe the intensity of the light transmitted through the second polarizer (analyzer). From these observations, determine the principal axes of the modulator crystal. Convince the TA or LA that you have found the axes.
5.2.3 Modulator Transmission Versus Applied Voltage
Rotate the polarizer/analyzer pair so that your reference line makes an angle of 45± with the axes of the polarizers. Turn on the chopper, and record the transmitted light with the detector and the oscilloscope as shown in Figure 1. Now connect the reversible high-voltage DC power supply to the modulator input, and record the intensity of the output light as a function of applied voltage. Do not apply more than 1000V to the modulator. Suggested voltages to apply are 0, 50, 100, 150, etc...
Now turn off the power supply, reverse the polarity of the input and repeat the experiment. Record your data in tabular form in your notebook (similar to the table shown below). Plot the results graphically and paste your graph into the your notebook.
| Voltage | Intensity (Normal Polarity) | Intensity (Reverse Polarity) |
| 0 | ||
| 50 | ||
| 100 | ||
| 150 | ||
| 200 | ||
| 250 | ||
| 300 | ||
| 350 | ||
| 400 | ||
| 450 | ||
| 500 | ||
| 550 | ||
| 600 | ||
| 650 | ||
| 700 | ||
| 750 | ||
| 800 | ||
| 850 | ||
| 900 | ||
| 950 |
5.2.4 (a) Half-Wave and Quarter-Wave Voltages
From your graph, estimate the quarter-wave voltage Vp/2 and the half-wave voltage Vp. Compare your measured halfwave voltage with your calculated result from (5.21). What can you say about the "natural bias" of the modulator? Also estimate the differential drive voltage, which will give a reasonably linear response.
5.2.4 (b) Shifting the Modulator Zero-Voltage Bias Point
- As you will note from your plot in (5.23), the modulator output intensity as measured between crossed polarizers is non-zero when the applied voltage is zero. This is because the natural birefringence and the fixed length of the crystal combine to yield output light that is in general elliptically polarized. If we were lucky, the output light exiting the crystal would have been either linear or circularly polarized (two special cases of elliptically polarized light). However, the devil is always at work, and we are not lucky today. To minimize the zero-voltage output intensity, a wave plate of the proper phase retardation would have to be inserted between the crystal and the analyzer to convert the elliptical polarization back to linear or circular polarization. Based on your data, what is the required static phase retardation, G0, of the desired wave plate for (a) linear polarization output, and (b) circular polarization output?
- We have only two wave plates in the laboratory: one quarter-wave and one half-wave plate. The best we can do is to place one of these plates between the modulator and the analyzer and adjust its angular position along with that of the analyzer to achieve the desired overall modulator bias point. Which plate do you think is the most versatile for this task? Try them both to verify your answer. First turn off the DC power supply and disconnect it from the modulator. Remove the chopper from the output beam. Now place the half-wave plate between the crystal and the analyzer and do a systematic search of all combinations of half-wave plate orientation and analyzer orientation to achieve the best possible extinction of the beam. Repeat the process with the quarter-wave plate. Which one works better? Convince the TA or LA of your answer with a demonstration. Explain in your lab notebook why the plate you have chosen works better and why the other plate is not as effective?
5.2.5 Frequency Response of Modulator/Drive Electronics System
Connect the high-voltage audio amplifier to the modulator. Apply a sinusoidal modulating voltage to the crystal (using the low-voltage signal generator to drive the amplifier) and observe both the drive signal waveform and the modulated light waveform on the oscilloscope. First we can find a linear operating region for the system by placing one of the wave plates between the crystal and the analyzer, and adjusting both the wave plate and the analyzer so that the output optical signal amplitude as seen on the oscilloscope is optimized (undistorted, in phase with the driving voltage, and as large in amplitude as possible). Obviously we should use as small an input signal as necessary when performing this polarization optimization step so as not to overdrive the modulator. The input signal amplitude may be increased after the optimization is performed.
Measure the amplitude of the drive signal as well as the intensity of the transmitted light as a function of frequency. Use 1, 10, 102 , 103 , 104 , 105 and 106 Hz for input frequencies. Record your data in tabular form in your notebook. Use this information to plot the frequency response of the system and paste your plots into your notebook.
Also answer these questions: (a) Is the result what one would reasonably expect for an electro-optic modulator? Be sure to take the frequency response of the detector into account; (b) what do you think is limiting the frequency response of the system, and why?
5.2.6 Optical Communications Demonstration
Turn off and disconnect the low-voltage signal generator. With the system still optimized for upmodulation in the linear operating region, connect the electrical output of the cassette tape recorder, CDplayer, shielded computer cable or radio to the high-voltage amplifier and complete the setup of the optical communications link using the audio amplifier to drive the loud speaker (see Figure 1). Convince the TA or LA that your system works as a free-space optical communication system (Also see A. Yariv, "Optical Electronics in Modern Communications", Oxford, chapter 9). Comment on the performance of the system in your notebook.
5.3. Acousto-optic Modulation
The setup we will use for observing acousto-optic light modulation of a He-Ne laser beam is shown in Figure 5. 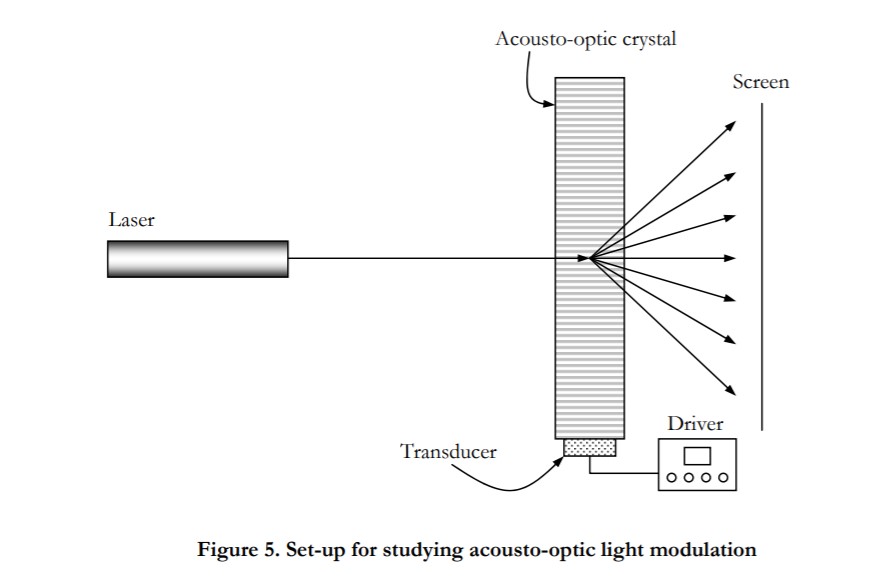
5.3.1 Measurement of the Grating Period and Acoustic Velocity
- With the center frequency control of the IntraAction DE-40M VCO (FM) driver set at about 3/4 of its maximum position, measure the frequency of this drive signal on the oscilloscope. When using the oscilloscope, be sure to turn the RF power level to its minimum position and use a 10x attenuator so as not to damage the scope. Next, measure the angular displacement of the first-order diffracted beam about 2 meters away from the deflector and record your data in your notebook. The center frequency range of DE-40M is about 30-60 MHz. Use this measurement to calculate the spatial frequency of the "grating". (That is, the periodicity of the sound wave in the crystal.) Show your calculation in your notebook. Why is it not necessary to know the refractive index of the crystal for this calculation? Show your reasoning.
- Use your data to calculate the speed of sound, va, in the crystal. By comparison with known material parameters, as may be found, for example, in Yariv's book, what are some possible materials that the deflector may be made of?
5.3.2 Diffraction Efficiency versus Drive Power and Intensity Modulation
- With the setup still operating at the above-chosen frequency, vary the strength of the drive signal with the "RF level control" knob and note how the intensity of the first-order diffracted beam is modulated. Now plot the dependence of the relative power in the diffracted first-order beam (relative to the beam incident on the modulator) as a function of the drive power for about four or five values. Explain your observations and results in your notebook. Is the dependence what one expects from the theory?
- Now keeping the amplitude of the drive signal constant, vary the drive frequency with the "centering" control and re-measure the first-order diffraction efficiency. Plot your results graphically for about six frequencies two of which are the minimum and maximum frequencies of the driver. Why does the diffraction efficiency of the first order fall off with frequency?
5.3.3 Frequency Modulation
The DE-40M VCO can also convert amplitude modulated electrical signals to frequency modulated electrical signals which then drive the deflector. Connect the low-voltage signal generator to the VCO analog input, and for frequencies less than 10 Hz observe the diffracted beams on the screen. Do not put more than 1 volt into the DE-40M oscillator. Use a detector and a knife edge (razor blade) in the path of the output beam (appropriately expanded) to convert the spatially oscillating first-order beam to an amplitude modulated electrical output (see Figure 6).
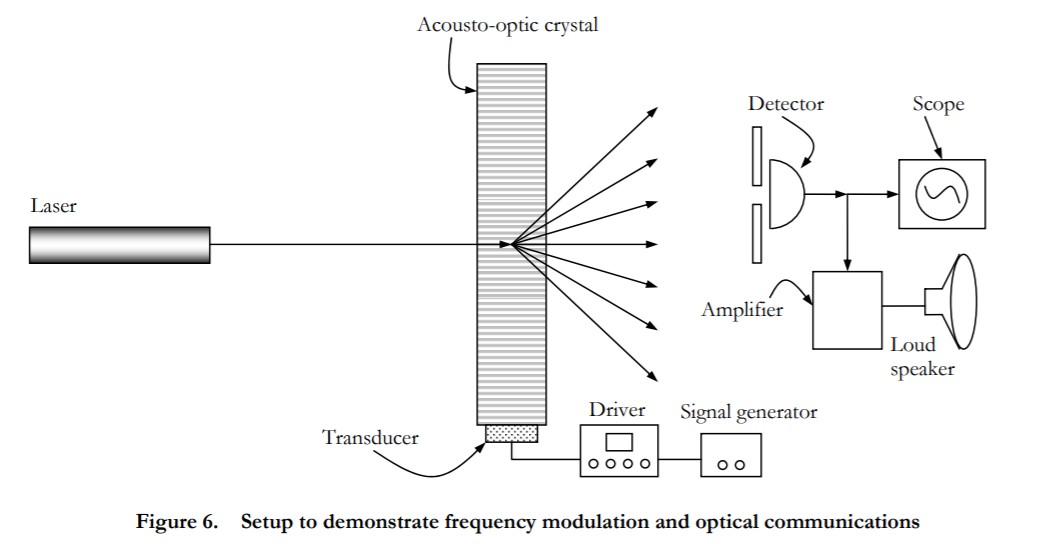
5.3.4 Optical Communications Demonstration (optional)
Use a CD-player as the input to the DE-40M, and adjust or modify the system in Fig. 6 to make it function as a simple acousto-optic communications system. Convince the TA or LA that your system works as a free-space optical communication system. Comment on the quality of the reproduction.
Following the thinking you did on the prelab, now build the optical system you designed in the pre-lab exercise and place it in the system. Again, comment on the quality of reproduction. Hint: Convert the FM signal to an AM signal with the use of lenses, mirrors, diffusers and/or spatial filters. Also, make sure that what you hear out of the detector is indeed the optic signal – ensure that you are not broadcasting from the nearby audio source via the audio cable (ensure that the detector and speaker are in a within a Faraday shield).
5.4 Real-Time Holography in Photorefractive Crystals
Objective
The goal of these experiments is to investigate real-time holographic information recording, storage, and readout in two different photorefractive recording media: a barium titanate (BaTiO3) crystal and a bismuth silicon oxide (Bi12SiO20) crystal. The experiments are, for the most part, qualitative in nature. A full interpretation of the observations will require familiarity with charge transport in semiconductors, and the tensorial properties of the electro-optic effect.
The Crystals
Three crystals are provided: A, B (both barium titanate, BaTiO3) and C is a bismuth silicon oxide crystal (Bi12SiO20). Crystal A has a roughly square cross-section and all six sides are polished. Crystal A is to be used for the experiment 5.11 and 5.5. Crystal B has a rectangular cross-section and only two sides are polished. Crystal B is to be used for this experiment (5.4).
5.4.1 Hologram Recording, Storage, Readout and Erasure in BaTiO3
In this experiment, a green argon laser beam (λ = 514 nm) is split into two portions and then the two beams are recombined in the BaTiO3 crystal so as to write a phase grating (the blue line of the argon laser at 488 nm could also be used, but it is less efficient than the green line for this experiment). A halfangle θ of about 10± degrees between the two beams is typical. The grating is read out at the Bragg angle with a weak He-Ne laser beam (λ = 633 nm) and the diffracted beam intensity is recorded with the aid of a photodetector. The set up is as shown in Figure 7. 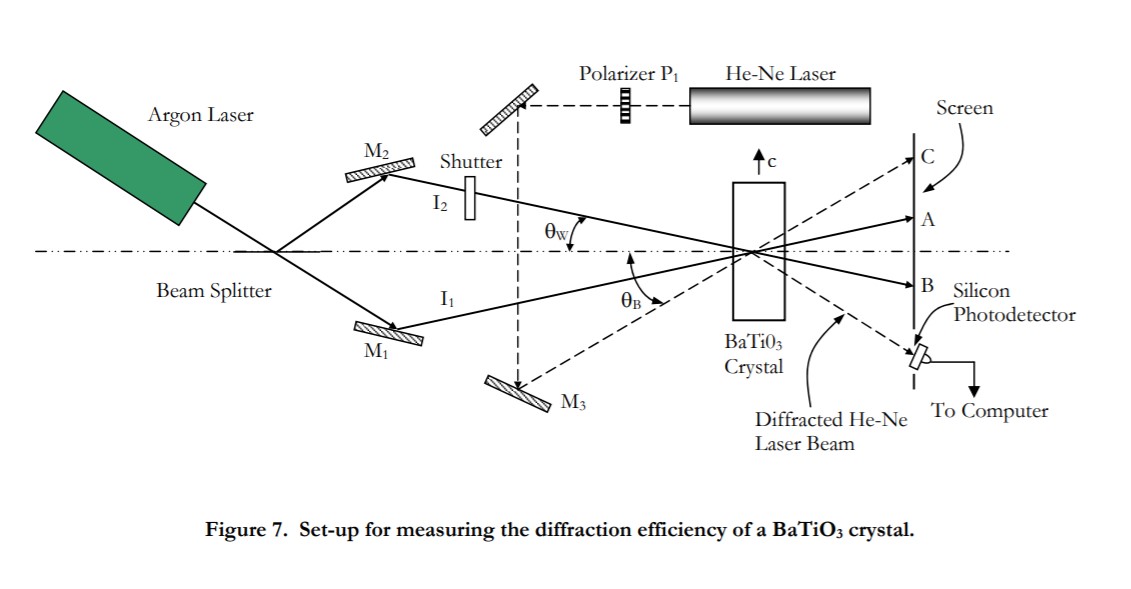
You should find the system already set up with the c-axis of the crystal in the plane of incidence of the argon laser beams as shown above. The angle of incidence of the He-Ne laser beam has been preadjusted so that the Bragg condition is satisfied. A fiber-optic coupled detector placed in the path of the diffracted He-Ne beam in conjunction with the BNC 210 National Instruments connector block and the computer is used to monitor the diffracted beam (alternatively, one could use a large-area photodetector and mask off the active area with a piece of black tape or cardboard to leave only a small opening roughly the size of the diffracted beam). The polarizer P1 in front of the unpolarized He-Ne laser serves to alter the polarization of the red He-Ne readout laser beam incident on the crystal.
Rotate the polarizer so that the He-Ne laser light is polarized in the plane of incidence. Place the screen in front of the photodetector, so that the transmitted Argon laser beams, as well as the transmitted and diffracted He-Ne Laser beam can be seen on the screen.
To make sure that the system is functioning properly, first erase the grating in the crystal. This is accomplished by blocking one of the arms of the argon-laser-beam-writing system using the electronic shutter so that the crystal is flooded uniformly with the light from the second arm for about 60 seconds. The intensity of the diffracted He-Ne Laser beam on the screen should slowly disappear. Now open the shutter so as to record a phase grating in the crystal. The diffracted intensity on the screen should rise quickly to its saturation level.
5.4.2 Bragg Readout
- With respect to the BaTiO3 crystal, is the He-Ne laser beam an ordinary beam or an extraordinary beam?
- Measure the polarization of the Argon laser beam. Is it ordinary or extraordinary polarized?
- By measuring the actual separation between the transmitted Ar laser beams on the screen, determine the angle between the two writing beams. (Do not touch the crystal when making these measurements).
- Calculate the period of the sinusoidal refractive index modulation that exists in the crystal using the results of part (3).
- Calculate the Bragg angle for He-Ne laser readout from your result in part (4). Compare this result with the measured Bragg angle, and explain any discrepancy between the two results.
- To experimentally find the Bragg angle, θB, we first calculated it to get an approximate value. Then an incremental search was performed about the calculated value (by changing the angle of incidence of the He-Ne laser beam on the crystal) until the maximum diffracted He-Ne beam intensity was obtained. Ask the TA or LA to demonstrate how extremely strict the conditions are for Bragg matching.
5.4.3 Diffraction Efficiency
- Remove the screen and use the Newport digital power meter and associated detector to measure the intensity of the He-Ne laser beam. With P1 adjusted so that the readout light (He-Ne laser) is polarized within the plane of incidence (which contains the c-axis of the crystal) open the shutter and observe the buildup of the diffracted light on the photodetector. It is very important that you not bump or otherwise disturb the setup while a grating is being written into the crystal. Write down the saturation intensity level of the He-Ne diffracted beam. Now place the Newport power meter in the readout He-Ne beam (before it enters the crystal) and measure the full intensity of the beam. Calculate the diffraction efficiency (power in the diffracted beam divided by power in the incident beam) of the crystal under these illumination conditions.
- Record the relative intensity of the argon laser beam using the Newport digital power meter.
- Now replace the photodetector in the path of the diffracted beam and connect the photodetector output to the computer. Use software provided to record the data on the digital chart-recorder (in LabView). Erase the crystal, then open the shutter and record the build-up of the diffracted light as a function of time on the digital chart recorder. Paste your data, or a reduced version thereof, into your report. Record the time scale on your plot, and calibrate the vertical axis using the saturation diffraction efficiency level of Part (a) as a benchmark. Identify the 10-to-90 percent rise time and the peak value of the diffracted He-Ne laser light intensity. Record these values on your plot.
5.4.4 Erase Time
With the same configuration as in 5.43, write the grating until the diffraction efficiency saturates. Now, close the shutter so as to block the light in one of the arms of the writing beam, and let the other argon laser beam, I2 , readout the crystal. Record the decay of the grating by monitoring the diffracted argon laser beam intensity on the digital chart recorder as I2 erases the grating while reading it out. Place your data, or a reduced version thereof, into your report. What is the 90-to-10 percent erase time?
5.4.5 Storage Time
With the same configuration as in 5.43, write the grating until the diffraction efficiency saturates. Now block the argon laser beam just after it exits the argon laser so that no write light reaches the crystal. Note the storage time of the grating, by setting the chart recorder for a 7-minute sweep and record the decay of the grating (as read out by the He-Ne laser) over the 7-minute period. Paste your data into your report. From your, data estimate the storage time of the crystal under these particular readout conditions.
5.4.6 Intensity Dependence of Write and Erase Times
Repeat the experiments in 5.43 and 5.45 with the argon laser beam at 3/4 of its original power. The laser power-control knob is on the back of the laser. Get the TA's help in adjusting the power of the laser beam. Paste your data into your report. Using your data, comment on the dependence of the diffraction efficiency, write time and the erase time on the pump power (argon laser power).
5.4.7 Dependence of Diffraction Efficiency on the Polarization of the Readout Beam
Repeat experiment 5.43 once more with the readout He-Ne laser light polarized perpendicular to the plane of incidence. Notice that the results are different from the original experiment with the He-Ne laser polarized in the plane of incidence. The point here is that it is possible to create a refractive-index grating (phase grating) that cannot be "seen" by readout beams of the "wrong" polarization. This happens frequently in anisotropic dielectric media where Dn is a function of the polarization of the light reading out the crystal.
5.4.8 Self-Pumped Wavefront Phase Conjugation
Barium titanate is unusual among photorefractive crystals in that it exhibits the phenomenon of selfpumped phase conjugation. That is, a single laser beam entering a barium titanate crystal at the appropriate angle is retroreflected out of the crystal and back along its original path with the same wavefront shape as the incident beam (see Figure 8). Thus, the crystal acts as a phase-conjugate mirror. 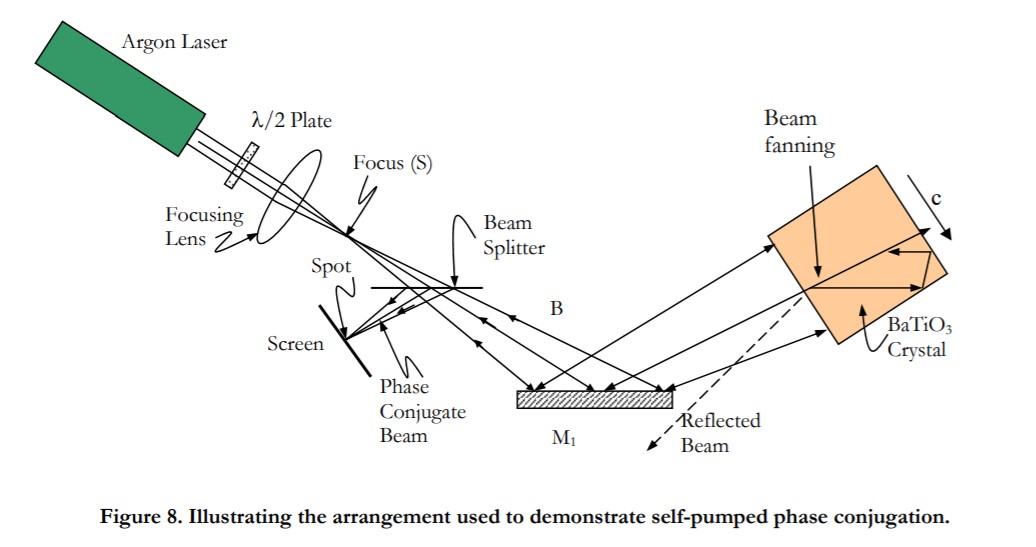
Beam fanning and two-beam coupling are essential to the mechanism involved in the self-pumped phaseconjugate process. These effects are stronger in BaTiO3 for extraordinary polarized light (polarization along the c axis) than for ordinary polarized light.
To explore the phase conjugate property of the barium titanate crystal, we will make the following changes to the setup of Figure 7.
- Use crystal A. Place the crystal on the stand so that the chip on the long edge is at the bottom, the chipped corners are on the back, and the reflected beams from the front face of the crystal make an angle of about 30° with the incoming beam.
- Change the wavelength of the argon laser light to the blue line at 488 nm (TA will do this), and
- Modify the set-up of Figure 7 to that of Figure 8 without the lens. This is accomplished by closing the shutter in Figure 7 so as to get a single beam, and using the given halfwave plate to rotate the polarization of the argon laser beam into the plane of incidence (which contains the caxis of the crystal). The key feature of this setup is a single extraordinary polarized writing beam interacting with the crystal.
- With the approximately-collimated laser beam entering one of the square faces of the crystal, rotate and translate the crystal as necessary until the phase-conjugate beam appears on the screen. You will have to wait about two to three minutes before the phase-conjugate beam is visible. Beam fanning within the crystal (see Figure 8) should be visible as the phase-conjugate beam builds up. Note that the phase-conjugate beam is approximately collimated even one meter away from the setup. Convince the TA or LA that you have observed the phase conjugate beam.
- A second optional demonstration involves placing a weakly focusing lens (one that does not significantly overfill the crystal) in the argon laser beam as shown in Figure 8. The focused spot S before the beam splitter serves as the input-object for this demonstration. The phaseconjugate beam should appear as a focused spot of light at the same distance from the beam splitter as S is in front the beam splitter. Move the screen about one meter away from the setup and note that the phase-conjugate beam is divergent, as expected.
- A third optional experiment involves removing the lens from the system, and placing the given aberrator in region B of the beam path. Describe and explain your observations.
- Remove the aberrator after steady state has been reached. Describe and explain the response due to the removal of the aberrator.
5.4.9 Photo-refraction in Bi12SiO20 (optional)
Bismuth Silicon Oxide is known to have cubic symmetry. Repeat all of the above experiments on bismuth silicon oxide. Compare your results with those for the BaTiO3 crystal and explain the differences in each case. What is your estimate of the relative photorefractive writing speed of Bi12SiO20 vs BaTiO3 for the same write laser power?
5.4.10 Summary (optional)
Given your results and observations in the experiments above in addition to all the other reading you have done concerning the photorefractive effect, and in particular the manifestation of this effect in BaTiO3, write three or four paragraphs summarizing the highlights of this fascinating phenomenon that would be exciting to a typical layman who would read a journal at the level of Scientific American.
APPENDIX
Computer operating instructions
VI folder
Advanced data logger
Advanced data logger Device 1 (computer channel)
Digits of precision: 5
Channel: 0
Run
Save
Enter header text
(Use matlab script to read VI file.)