
8.5.2: Aircraft operations' environmental fingerprint
- Page ID
- 78357

Noise
Noise nuisance is an important environmental impact in the vicinity of airports. The problem is not related to an isolated take-off or landing operation, but as a consequence of the total set of departures and arrivals taking place in the airport daily. In order to understand the problem, try to empathize with a neighborhood (including hospitals, schools, houses, etc.) that has to bear systematically with an important amount of noise. To quantify it, the decibel [Db] is used. In order to provide a qualitative reference, it is worth mentioning that a typical commercial aircraft during take off emits 130 dB; the pain threshold is 140 dB; a launcher during take off is 180 dB; a concert is 110 dB; a train 80 dB; a conversation 40 dB; etc.
The most important noise emission sources within an aircraft are due to the engines, which work at high power settings during take off and initial climb. The fundamental contribution to this noise is due to rotatory elements (compressor, turbine, fans, etc.). The second fundamental contribution is due to the exhausted jet in case of turbojets. Moreover, there is also a so-called aerodynamic noise, coming form the wing, the fuselage, the empennage, and the landing gear as the aircraft flies. Sound waves propagate in the air at the speed of sound. The intensity that an observer suffers is proportional to the intensity in the source (the aircraft in this case) and inversely proportional to the square distance between source and receiver, i.e., the closer the aircraft is, the more intense the noise suffered by the observer.
Noise mitigation strategies: There are four fundamental strategies to mitigate noise:
- Reduction of noise in the source (airframe and engines).
- Urban management and planning.
- Take-off and landing noise abatement procedures.
- Operative restrictions.
The continuous development of more and more modern aircraft and jet engines has led in the past to substantial reduction of noise (among other improvements) emissions. This is expected to continue in the future, since noise emissions are regulated by authorities. It obviously requires the application of new technologies coming from research and innovation.
Urban managing and planning refers to limiting the urban areas next to current limits of the airport, but also to potential future enlargements.
If it happens that there is a neighborhood next to an airport, and the neighborhood is suffering from noise, an interesting strategy is to design the so-called noise abatement procedures both for departure and arrival. These are typically continuous climb or continuous descent procedures that modify the flight path to avoid overflying certain areas. A good reference on this issue is Prats-Menéndez [11].
Last, if any of the previous strategies has not been developed, one can always restrict operations, for instance, at night hours. This is not desirable in terms of the economy of the industry, but it might be mandatory due to local legislation.
Climate change impact.
Aviation is one of the transport sectors with currently moderate climate impact. Air transportation contributes a small but growing share of global anthropogenic climate change impact. As aviation grows to meet increasing demand, the United Nations Intergovernmental Panel on Climate Change (IPCC) forecasted in 1999 that its share of global man made \(CO_2\) emissions will increase to around 3% to 5% in 2050 (in 1999 it was estimated to be 2%) PENNER [9]. Moreover, the Royal Commission of Environmental Pollution (RCEP) has estimated that the aviation sector will be responsible for 6% or the total anthropogenic radiative forcing by 2050 Royal-Commission [12]. The development of mitigation methods for this purpose is in line with aviation visions and research programs, such as ACARE [1], the European aeronautics projects Clean Sky18 and SESAR CONSORTIUM [15], and the U.S. Next Generation19 strategy.
The climate impact of aviation results from \(CO_2\) and non-\(CO_2\) emissions PENNER [9]. While \(CO_2\) is the most widely perceived greenhouse gas agent in aviation, mainly because its long lifetimes in the atmosphere and because of its considerable contribution to radiative forcing, emissions from aircraft engines include other constituents that contribute, via the formation or destruction of atmospheric constituents, to climate change. The non-\(CO_2\) emissions (nitrogen oxides, water vapor, aerosols, etc.) have shorter lifetimes but contribute a large share to aviation climate impact, having a higher climate impact when emitted at cruise than at ground levels. One of these non-\(CO_2\) contributors to climate change is the formation of contrails, which have received significative attention PENNER [9]. The relative importance of \(CO_2\) and non-\(CO_2\) depends strongly on the time horizon for evaluation of climate impacts and scenarios, e.g., future air traffic development. The non-\(CO_2\) effects are more important for short time horizons than for long horizons.
Aviation \(NO_x\) Climate Impact: Nitrogen oxides (\(NO_x\), i.e., \(NO\) and \(NO_2\)) are one of the major non-\(CO_2\) emissions. \(NO_x\) emissions in the troposphere and lower stratosphere contribute to ozone (\(O_3\)) formation and methane (\(CH_4\)) reduction. Both are important greenhouse gases. On average, the \(O_3\) impact of aviation \(NO_x\) is expected to be stronger than the impact on \(CH_4\), which increases the greenhouse effect, though the precise amounts are uncertain. The amount of \(NO_x\) emissions depends on fuel consumption and the engine’s type-specific emission index. The emission index for \(NO_x\) depends on the engine and combustor architecture, power setting, flight speed, ambient pressure, temperature, and humidity. This dependence has to be taken into account when considering changes in aircraft design and operations.
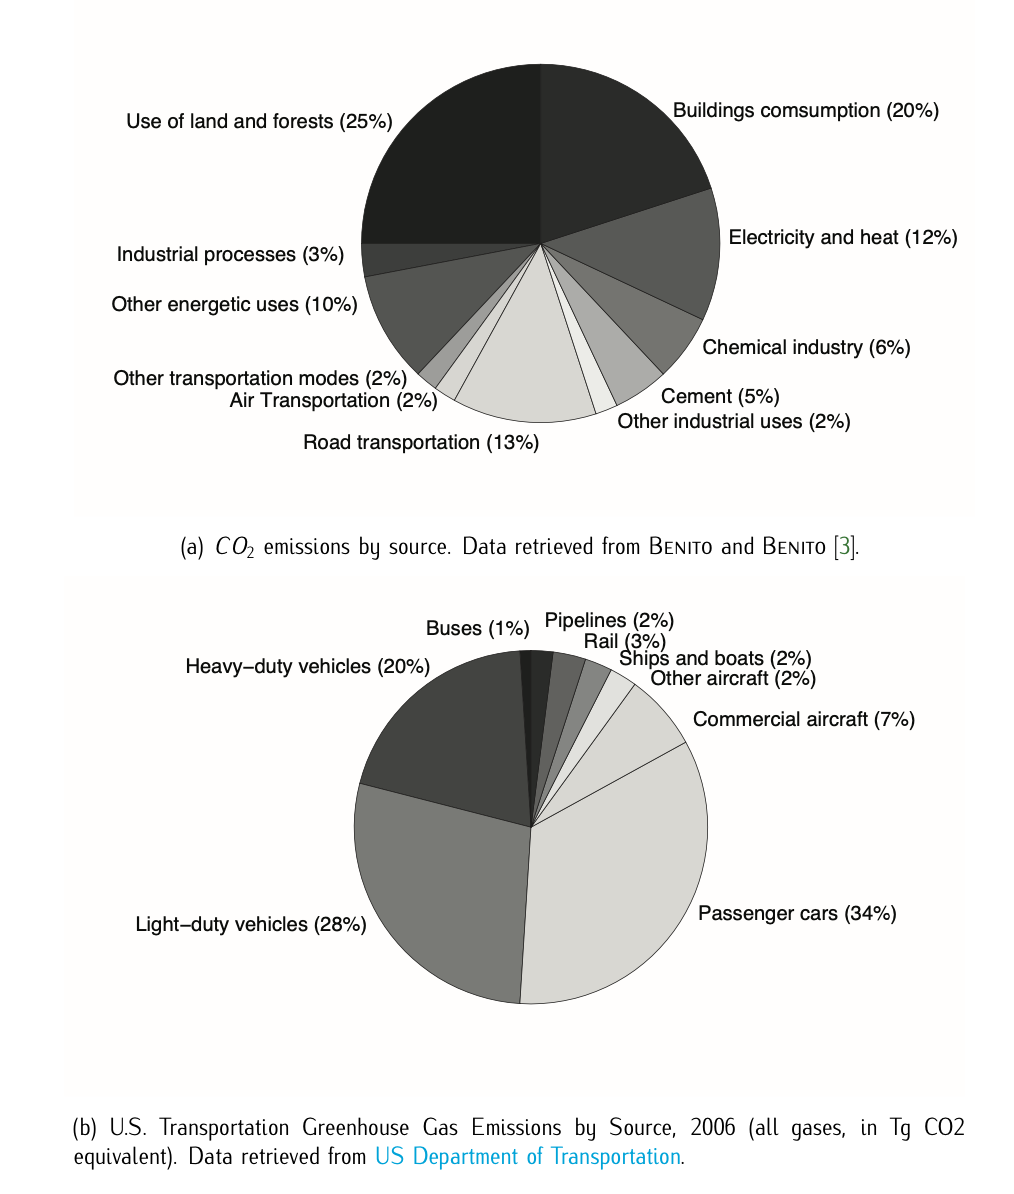
Figure 8.9: \(CO_2\) and global warming emissions.
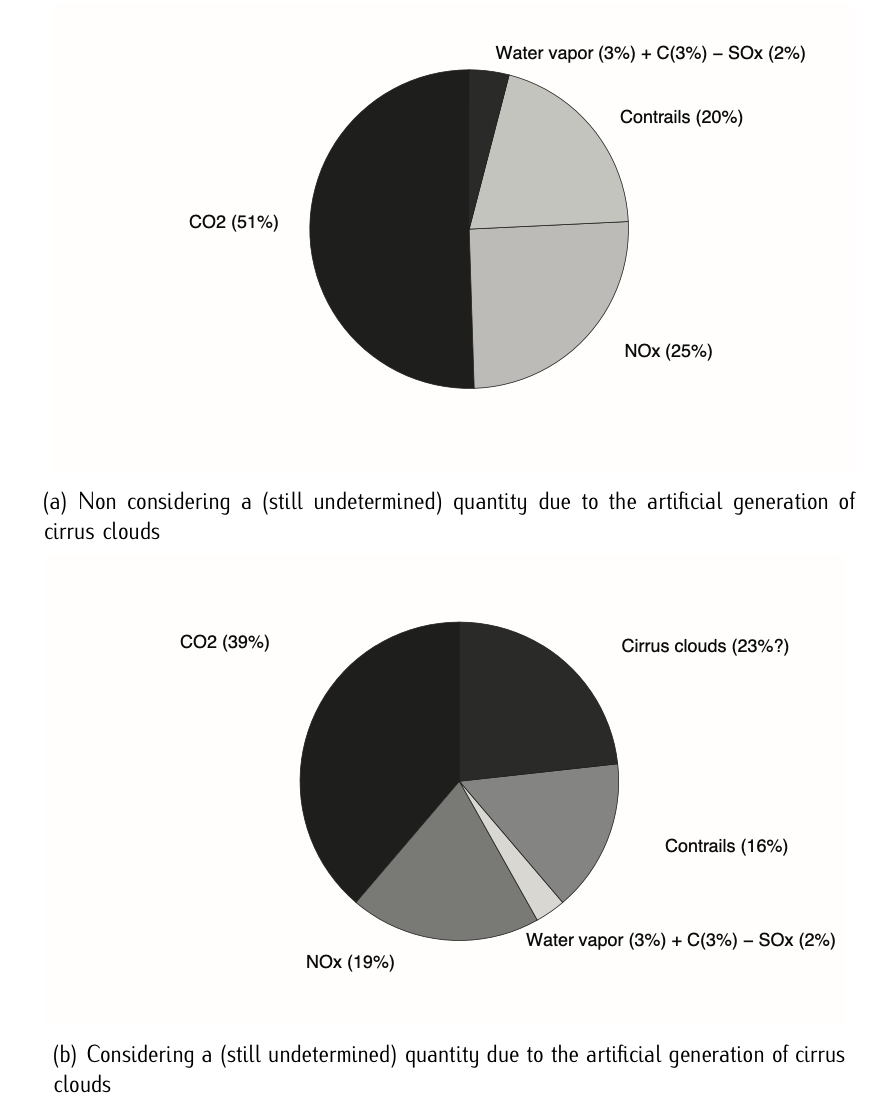
Figure 8.10: Aircraft emissions contributing to global warming. Data retrieved from BENITO and BENITO [3].
Aviation Water Vapor Climate Impact: The climate impact of water vapor emissions without contrail formation is relatively small for subsonic aviation. The relative impact increases with altitude because of longer lifetimes and lower background concentrations at higher altitudes in the stratosphere, and would be more important for supersonic aircraft; water vapor would also become more important when using hydrogen-powered aircraft. The total route time in the stratosphere can be used as an indicator for water vapor climate impact.
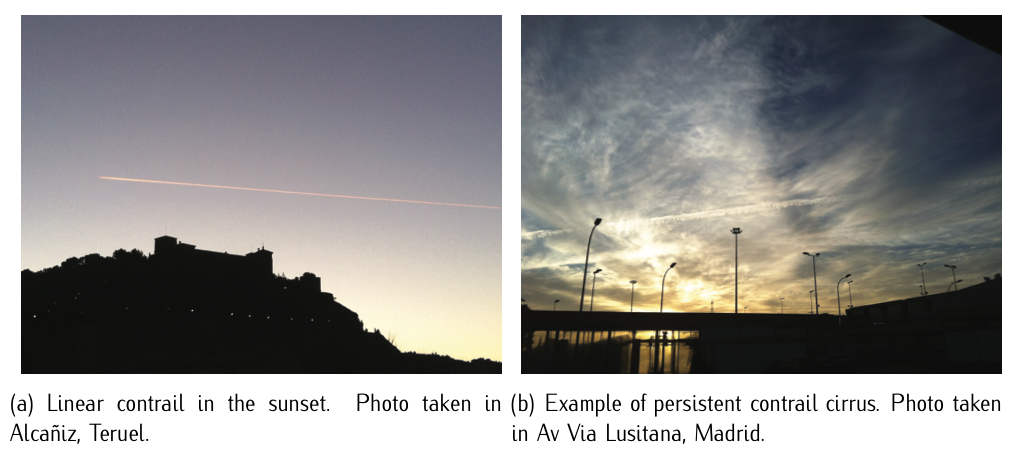
Figure 8.11: Contrails.
Contrails: Contrails (short for condensation trails) are thin, linear ice particle clouds often visible behind cruising aircraft. They form because, under appropriate atmospheric conditions, the exhausted water vapor resulting from combustion inside aircraft engines mixes with cold ambient air, leading to local liquid saturation, condensation of water vapor, and subsequent freezing. A comprehensive analysis of the conditions for persistent contrail formation from aircraft exhausts is given in SCHUMANN [13].
Linear contrails may persist for hours and may eventually evolve into diffuse cirrus clouds, modifying thus the natural cloudiness. As a consequence persistent contrails modify the radiation balance of the Earth-Atmosphere system, resulting into a net increase of earth’s surface warming.
Contrails form when a mixture of warm engine exhaust gases and cold ambient air reaches saturation with respect to water, forming liquid drops that quickly freeze. Contrails form in the regions of airspace that have ambient relative humidity with respect to water (\(RH_w\)) greater than a critical value \(r_{contr}\). Regions with \(RH_w\) greater or equal than 100% are excluded because clouds are already present. Contrails can persist when the environmental relative humidity with respect to ice (\(RH_i\)) is greater than 100%. Thus, persistent contrail favorable regions are defined as the regions of airspace that have: \(r_{contr} \le RH_w < 100%\) and \(RH_i \ge 100%\).
The estimated critical relative humidity for contrail formation at a given temperature \(T\) (in degrees Celsius) can be calculated as:
\[r_{contr} = \dfrac{G (T - T_{contr}) + e_{sat}^{liq} (T_{contr})}{e_{sat}^{liq} (T)}\label{eq8.5.2.1}\]
where \(e_{sat}^{liq} (T)\) is the saturation vapor pressure over water at a given temperature. The estimated threshold temperature (in degrees Celsius) for contrail formation at liquid saturation is:
\[T_{contr} = -46.46 + 9.43 \log (G - 0.053) + 0.72 \log^2 (G - 0.053),\label{eq8.5.2.2}\]
where
\[G = \dfrac{EI_{H_2O} C_p P}{\epsilon Q (1 - \eta)}.\label{eq8.5.2.3}\]
In equation (\(\ref{eq8.5.2.3}\)), \(EI_{H_2O}\) is the emission index of water vapor, \(C_p\) is the isobaric heat capacity of air, \(P\) is the ambient air pressure, \(\epsilon\) is the ratio of molecular masses of water and dry air, \(Q\) is the specific heat combustion, and \(\eta\) is the average propulsion efficiency of the jet engine.
\(RH_i\) is calculated by temperature and relative humidity using the following formula:
\[RH_i = RH_w \dfrac{6.0612 \exp \tfrac{18.102T}{249.52 + T} }{6.1162 \exp \tfrac{22.577 T}{237.78 + T}},\label{eq8.5.2.4}\]
where \(T\) is the temperature in degrees Celsius.
Climate impact mitigation Options
Strategies for minimizing the climate impact of air traffic include identifying the most efficient options for airframe and propulsion technology, air traffic management, and alternative route network concepts. Economic measures and market-based incentives may also contribute, but these are out of the scope of this chapter. Minimizing the climate impact of aviation would require addressing all climate impact components. In the following, due to its relative importance, only the reduction of emissions of \(CO_2\) and a contrail mitigation strategy are considered.
Minimizing \(CO_2\) Emissions: Minimum fuel consumption is of primary interest for the aviation industry because it reduces costs. However, fuel is not the only cost driver and various constraints cause fuel penalties. Although fuel reduction below the current state is challenging, further reduction of fuel consumption and hence of fossil \(CO_2\) climate impact is nevertheless feasible. As exposed in Section 1.3, the aim is to reduced the \(CO_2\) emissions by 50% due to 2050 when compared to 2010 emissions. The reduction in \(CO_2\) will require contributions from new technologies in aircraft design (engines, airframe materials, and aerodynamics), alternative fuels (bio fuels), and improved ATM and operational efficiency (mission and trajectory management). See Figure 1.3.
Contrail impact mitigation strategies: Several strategies for persistent contrail mitigation have been studied. See for instance Gierens et al. [6]. As illustration, a flight planning contrail mitigation strategy is herein presented. Further mitigation potential can be achieved by developing optimized aircraft and jets for these alternative trajectories.
In this example the aim is at showing a contrail mitigation strategy based on modifying the vertical profile of the flight. More information about this example can be consulted in Soler et al. [16].
More specifically, we optimize the trajectory of a B757-200 BADA 3.6 Nuic [8] model aircraft performing the en-route part of a flight San Francisco (\(SFO\)) - New York (\(JFK\)) between the waypoint20 Peons as initial fix and the waypoint Magio as final fix. The route is composed by waypoints given in Table 8.12.
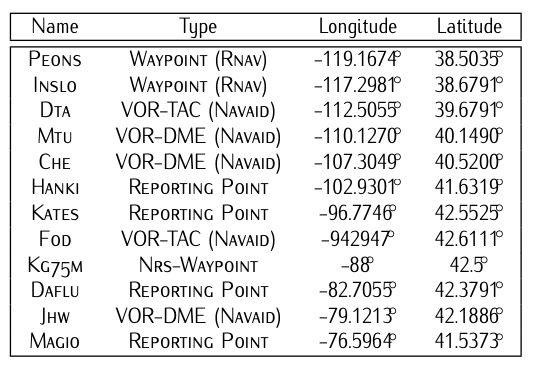
Table 8.12: Route’s waypoints, navaids, and fixes
We assume all pairs formed by two consecutive waypoints are connected by bi-directional airways. On an airway, aircraft fly at different flight levels to avoid collisions. The different flight levels are vertically separated 1000 feet. On a bi-directional airway, each direction has its own set of flight levels according to the course. In east direction flights, aircraft are assigned odd flight levels separated 2000 feet. We then assume the aircraft can flight the route in any (if only one) of the following flight levels:
\[\{FL270, FL290, FL310, FL330, FL350, FL370, FL390, FL410\}\label{eq8.5.2.5}\]
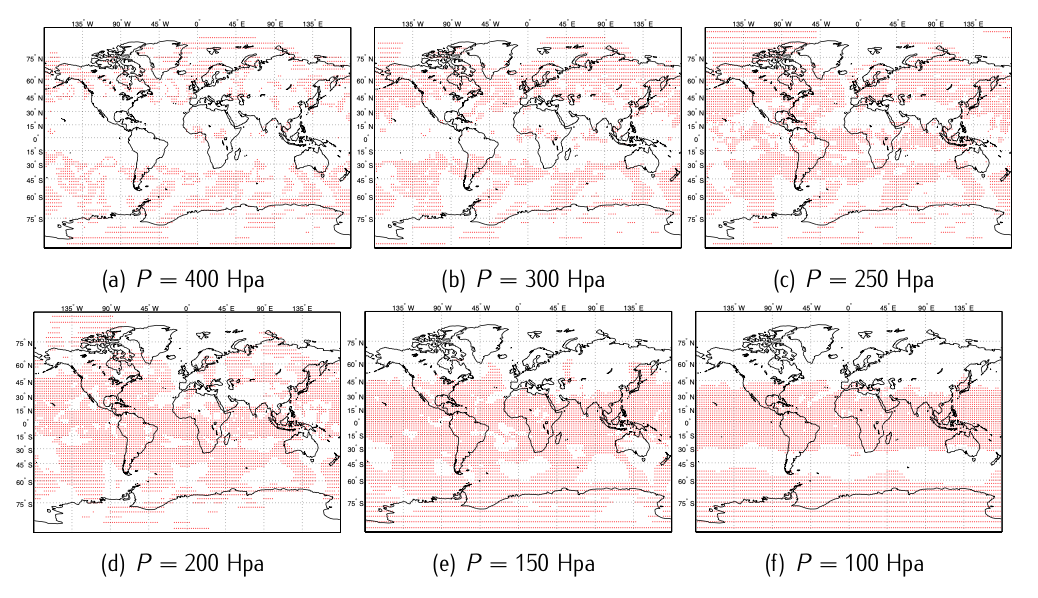
Figure 8.12: Longitude-latitude grid points that present favorable conditions for persistent contrail formation for different barometric altitudes.
The flight we are analyzing is inspired in \(DAL30\), with scheduled departure from \(SFO\) at 06:30 a.m. on June the 30th, 2012. Data of air temperature and relative humidity for June the 30th, 2012 at time 18.00 Z21 (10.00 a.m. \(PST\)) have been retrieved from the \(NCEP/DOE\ AMIP-II\) Reanalysis data provided by the System Research Laboratory at the National Oceanic & Atmospheric Administration (\(NOAA\))22. The data have a global spatial coverage with different grid resolutions. Our data have a global longitude-latitude grid resolution of \(2.5^{\circ} \times 2.5^{\circ}\). Regarding the vertical resolution, the data are provided in 17 pressure levels (hPa): 1000, 925, 850, 700, 600, 500, 400, 300, 250, 200, 150, 100, 70, 50, 30, 20, 10.
According to what has been exposed in Section 8.5.2, we compute the latitude- longitude grid points that are favorable to persistent contrail formation at different barometric altitudes (which defines the pressure). We do so based on gathered data of air temperature and relative humidity, and using equations (8.5.2.1)-(8.5.2.4) with the following: \(EI_{H_2O} = 1.25\); \(C_p = 1004[J/KgK]\); \(\epsilon = 0.6222\); \(Q = 43 \cdot 10^{6} [J/Kg]\); and \(\eta = 0.15\). The longitude-latitude grid points with favorable conditions for persistent contrail formation are represented as red dots in Figure 8.12 for different barometric altitudes.
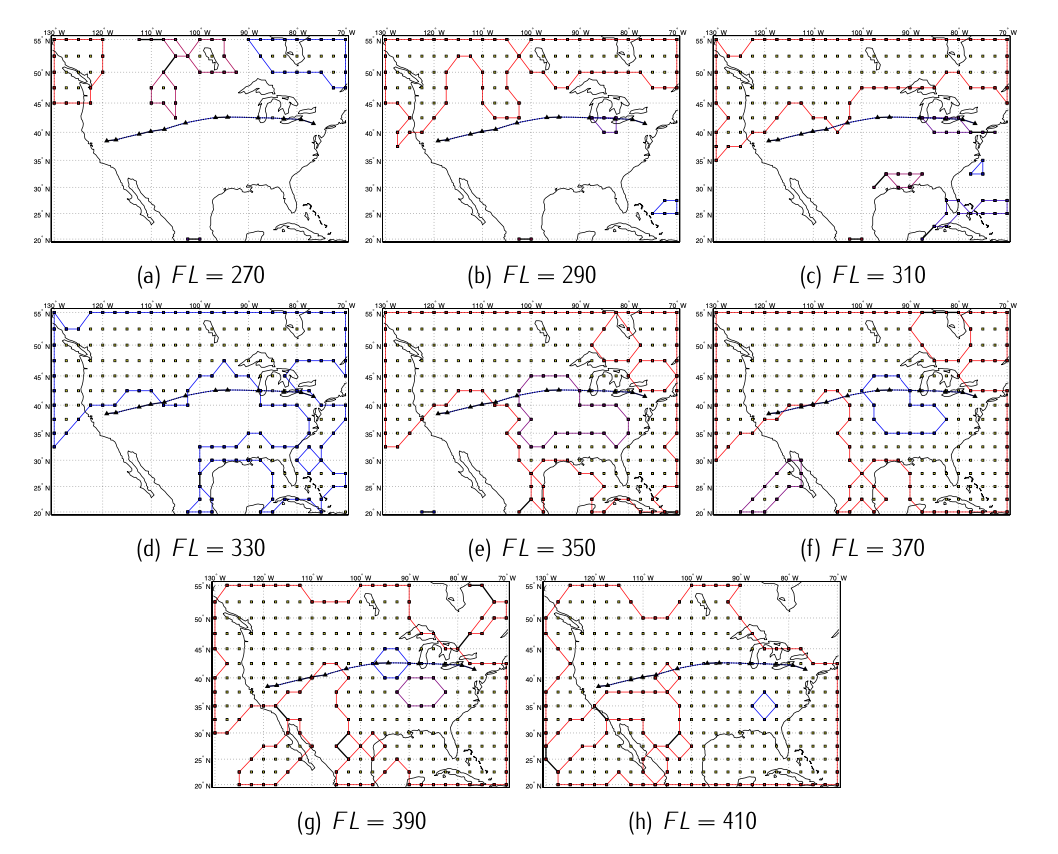
Figure 8.13: Favorable regions of contrail formation over USA at different flight levels. The horizontal route is depicted to illustrate how the same horizontal route under different flight levels might increase/reduce potential persistent contrail generation.
In order to analyze the regions of persistent contrail formation in our case study, we first need to estimate the values of temperature and relative humidity for the flight levels given in set (8.5.2.5). In order to do that, we use the International Standard Atmosphere (\(ISA\)) equations to convert altitude into barometric altitude, and then run a linear interpolation between the data of air temperature and relative humidity corresponding to the 17 pressure levels and the desired flight levels (already converted into barometric altitude). Once we have the values of temperature and relative humidity at the desired flight levels, we proceed on using equations (8.5.2.1)-(8.5.2.4) as exposed above. The favorable regions of persistent contrail formation over the USA at the different flight level can be consulted in Figure 8.13.
It can be observed that flying at high flight levels, e.g., \(FL370, FL390\), and \(FL410\), implies overflying regions of persistent contrail generation. On the contrary, flying at low flight levels, e.g., \(FL270, FL290\), and \(FL310\), implies non overflying regions of persistent contrail generation and thus minimizes environmental impact. However, it is obviously more efficient in terms of fuel burned to fly higher, which is actually what airlines do. Indeed, the flight in which this example is based on flow a flight plan at \(FL390\) and \(FL410\). Concluding, trade-off strategies (fuel-environmental impact) must be found.
19. http://www.faa.gov/nextgen/
20. Waypoints may be a simple named point in space or may be associated with existing navigational aids, intersections, or fixes.
21. Z-hour corresponds to Universal Time Coordinates (UTC). The Pacific Standard Time (PST) is given by UTC - 8 hours.
22. The data have been downloaded from NOAA website @ http://www.esrl.noaa.gov/psd/