
1.4: Reduction of Greenhouse Gas (GHG) Emission
- Page ID
- 48542

1.4 Reduction of Greenhouse Gas (GHG) Emission
There is a scientific consensus that greenhouse gas (GHG) production is increasing, which has led to climate change and several other environmental concerns. As much as oil companies and conservative think tanks don't want this to be true, it is, and much of the severe weather that has been occurring worldwide is due to climate change issues. There is a significant amount of evidence to substantiate the existence of climate change and the overall warming of the earth. The change in climate is due to the Greenhouse Effect; it is a natural effect, caused by CO2 and water vapor naturally present in the atmosphere. The focus for debate (scientific and political) has been on whether there is also an anthropogenic greenhouse effect causing further climate change. Carbon dioxide (CO2) is not the only greenhouse gas (methane, CH4 is another potent GHG; will be discussed further in upcoming sections), but most of the debate focuses on it. And it is thought that the dramatic increase in CO2 in the atmosphere is due to burning fossil fuels.
The world is highly dependent on fossil fuels; the US is also highly dependent on fossil fuels. As we saw in Figure 1.9, in 2011, only 17% of the fuel consumed was non-fossil fuel based, and that consumption is projected to be 21% in 2040. And about half of that is renewables.
There is a mountain of evidence indicating that the planet is warming. Figure 1.10 shows a graphic depicting CO2 levels plotted with change in average global temperatures from 1880-2010. The change has been most dramatic in the last 30 years.

In the Arctic and Antarctic regions, the ice pack and glaciers are melting, and at an even faster rate than originally anticipated. Scientists have found that increasing atmospheric temperatures are not the only cause of this; the melting is causing water currents to shift and move warmer water around the poles, so that melting is happening underneath the ice pack. Figure 1.11a shows the change in the ice pack from 1984 to 2012 for the Arctic, while Figure 1.11b shows the changes in sea level, globally, from 1993-2012.
Try This
Visit Earth Observatory(link is external) to try an interactive tool that allows you to manipulate images to show dramatic changes in ice pack.
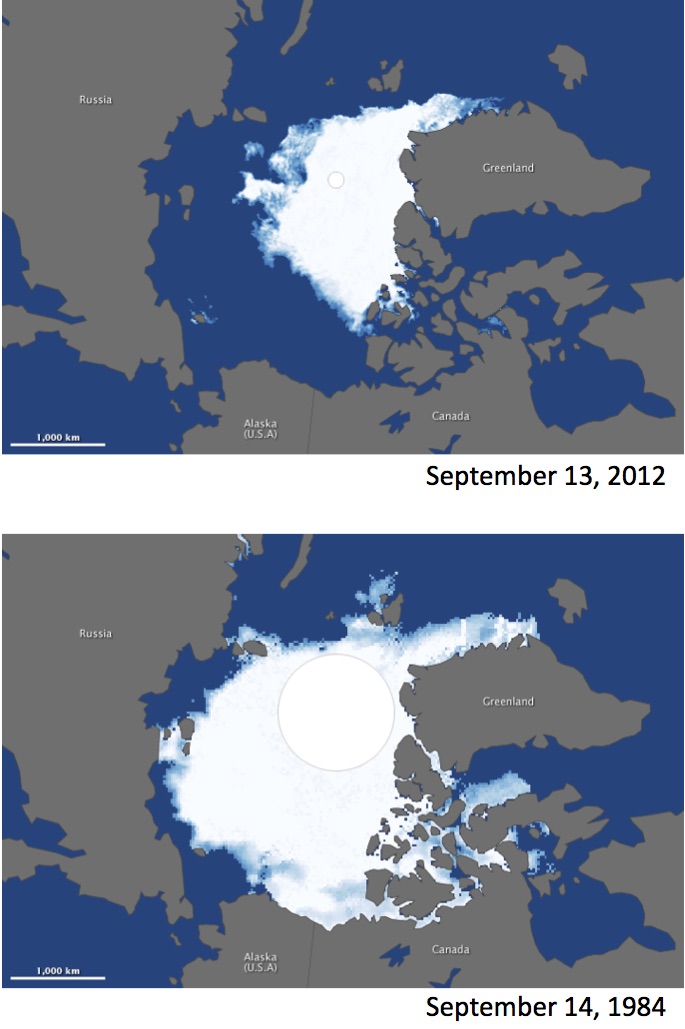
Credit: NASA Earth Observatory
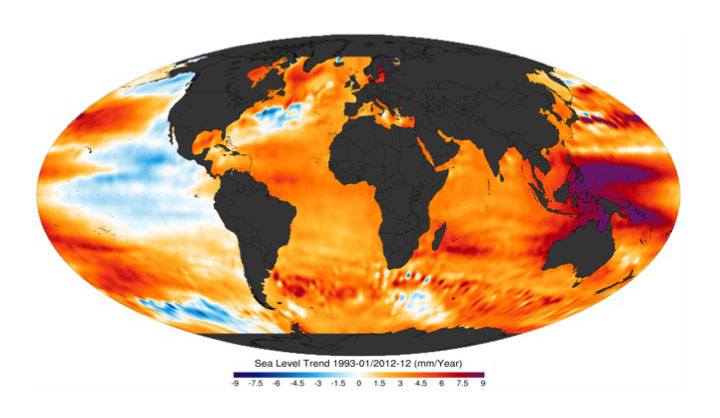
Credit: NOAA/NESDIS/STAR
Another problem could stem from the increased production of natural gas. Natural gas consists primarily of methane. Sources include petroleum and natural gas production systems, landfills, coal mining, animal manure, and fermentation of natural systems. Methane has 25 times the global warming potential of CO2. Figure 1.12 shows the total GHG percentages from various sources. However, Figure 1.13 shows the emissions of various GHG emissions from 1990-2014. The EPA points out that overall emissions of CH4 have been reduced by 11% from 1990-2012. However, an article published in Nature (Yvon-Durocher, March 2014) suggests that there may be an unexpected consequence of warming temperatures; global warming can increase the amount of methane evolved from natural ecosystems. So, it remains to be seen what impacts can happen that have not been included in climate change models.

Credit: EPA

Credit: EPA
There are several possible responses to abate CO2 and CH4: 1) do nothing; 2) reduce CO2 and CH4 prudently; 3) drastically reduce energy use; and 4) move to a carbon-free society. The easiest, but quite possibly the most damaging in the long run, is to do nothing - currently, there are some nations that are pushing to at least increase conservation. The use of hybrids has actually decreased our use of gasoline, as the increase in Corporate Average Fuel Economy (CAFE) standards has had an impact. However, prudent measures to reduce GHG will most likely not be enough to make a huge impact. Therefore, the use of biofuels could have great potential for reducing the impact of CO2 and CH4, if done well. However, some actions in South America have shown that if switching to biofuel growth is not handled well, a greater problem can be created. Some rainforest areas were removed from South America to clear land for producing biofuels, but the rainforests that were removed were burned, putting an excessive amount of CO2 in the atmosphere. Rainforests have grown over long periods of time, so there was a lot of carbon stored in them - they were also places where exotic animals, plants, and insects lived, so the burning endangered the wildlife species in the rainforests. One thing to always keep in mind: whenever an action is taken in our atmosphere, there is the possibility of a negative consequence that one cannot foresee.