
11.2: Ethanol Production and Economics
- Page ID
- 48616

11.2 Ethanol Production and Economics
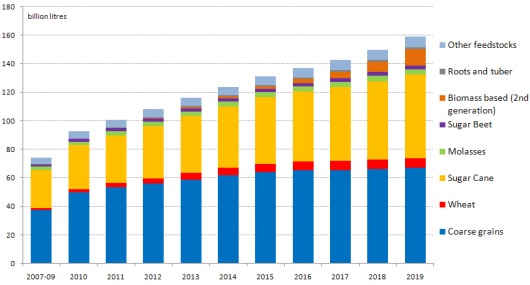
The major feedstock for ethanol has been coarse grains (i.e., corn). Second-generation ethanol (from cellulosic biomass) is around ~7% of the total ethanol production. Figure 11.1 shows the global ethanol production by feedstock from 2007-2019.
- Click here for a text alternative to Figure 11.1
-
Global Ethanol Production in billions of liters by Feedstock from 2007-2019. All values are visual approximations
Year Coarse Grains Wheat Sugar Cane Molasses Sugar Beet Biomass based (2nd Generation) Roots and Tuber Other Feed Stocks Total 2007-2009 37 1 27 3 2 - - 5 75 2010 50 2 30 2 3 - - 6 93 2011 54 3 32 4 2 - - 5 100 2012 56 4 35 4 2 - - 6 107 2013 59 5 38 3 2 1 1 6 115 2014 61 6 43 3 2 2 1 6 124 2015 64 5 45 4 2 3 1 7 131 2016 65 6 47 5 2 4 1 7 143 2017 65 6 52 4 3 5 1 7 153 2018 66 6 53 4 3 8 1 8 149 2019 61 6 59 3 2 13 1 8 159
Credit: The Crop Site
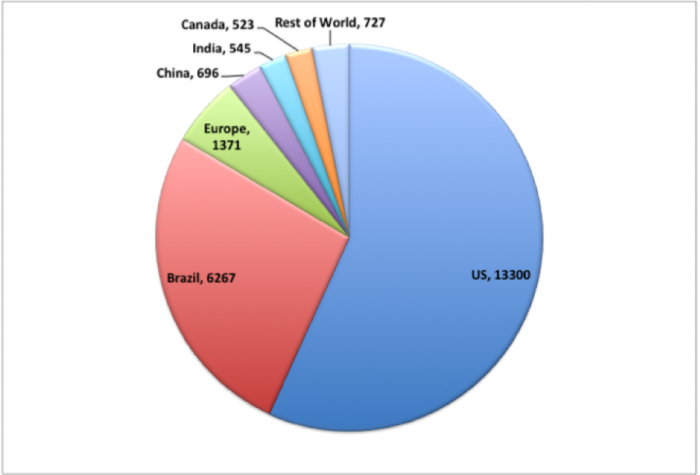
In 2013, the world ethanol production came primarily from the US (corn), Brazil (sugarcane), and Europe (sugarbeets, wheat). Figure 11.2 shows ethanol production contributions, in millions of gallons, from all over the world. In addition to Brazil, ethanol production from sugarcane is also being done in Australia, Columbia, India, Peru, Cuba, Ethiopia, Vietnam, and Zimbabwe. In the US, ethanol from corn accounts for ~97% of the total ethanol production in the US.
- Click here for a text alternative to Figure 11.2
-
World Ethanol Production
Country Millions of Gallons of Ethanol US 13300 Brazil 6267 Europe 1371 China 696 India 545 Canada asdf 523 asdf Rest of the World 727
Credit: RFA
Table 11.2 shows a comparison of costs for first-generation ethanol feedstock along with their production costs. The data in this table is from 2006, but it gives you an idea of why ethanol is made from corn in the US: because it is less expensive and more profitable. However, as seen in the other charts, the use of sugar-based materials like sugarcane and sugarbeets is growing, as well as the use of cellulosic materials.
| Cost Item | Feedstock Costsb | Processing Costs | Total Costs |
|---|---|---|---|
| US Corn wet milling | 0.40 | 0.63 | 1.03 |
| US Corn dry milling | 0.53 | 0.52 | 1.05 |
| US Sugarcane | 1.48 | 0.92 | 2.40 |
| US Sugar beets | 1.58 | 0.77 | 2.35 |
| US Molassesc | 0.91 | 0.36 | 1.27 |
| US Raw Sugarc | 3.12 | 0.36 | 3.48 |
| US Refined Sugarc | 3.61 | 0.36 | 3.97 |
| Brazil Sugarcaned | 0.30 | 0.51 | 0.81 |
| EU Sugar Beetsd | 0.97 | 1.92 | 2.89 |
a Excludes capital costs
b Feedstock costs for US corn wet and dry milling are net feedstock costs; feedstock for US sugarcane and sugar beets are gross feedstock costs
c Excludes transportation costs
d Average of published estimates
Credit: rd.usda.gov
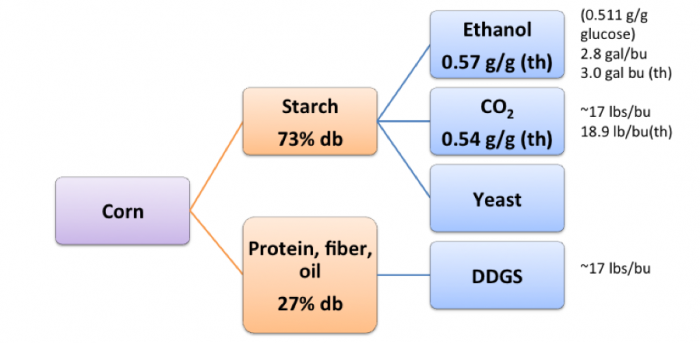
Figure 11.3 shows the overall process of making ethanol from corn. It also shows the additional products made from corn. If you recall from Lesson 7, DDGS is a grain that can be used to feed cattle. Corn oil is also produced for use. Typical yields of each product per bushel of corn are shown (2.8 gal of ethanol, 17 lbs. of CO2, and 17 lbs. of DDGS).
- Click for a text description of Figure 11.3
-
Corn Starch – 73% db
- Ethanol--0.57 g/g (th)
- (0.511 g/g glucose)
- 2.8 gal/bu
- 3.0 gal/bu (th)
- CO2—0.54 g/g (th)
- ~17lbs/bu
- 18.9 lb/bu (th)
- Yeast
Protein, fiber, oil – 27% db
- DDGS
- ~17lbs/bu
- Ethanol--0.57 g/g (th)
Credit: BEEMS Module B5
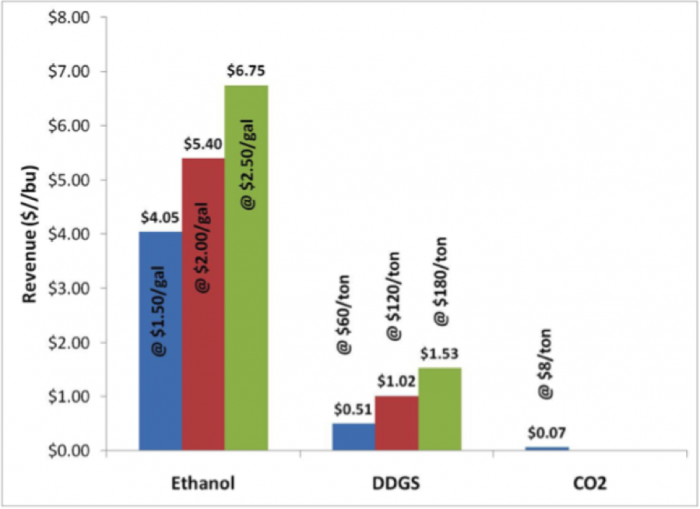
So, what are the ethanol revenue streams? Figure 11.4 shows that the revenue streams are ethanol, DDGS, and CO2. The revenue streams are market driven; ethanol is the plant’s most valuable product and typically generates 80% of the total revenue. The DDGS represents 15-20% of the revenue, and CO2 represents a small amount of revenue. The revenue margins are tight, however, and sale of DDGS and CO2 is probably essential for the plant to be profitable.
- Click for a text description of Figure 11.4
-
Ethanol Revenue Streams
Product Revenue $ per bushel of corn Value ($) of how each product is sold Ethanol 4.05 1.50/gal Ethanol 5.40 2.00/gal Ethanol 6.75 /gal DDGS 0.51 60/ton DDGS 1.02 120/ton DDGS 1.53 180/ton CO2 0.07 8/ton
Credit: BEEMS Module B5
Figure 11.5 shows the volatility of the price of corn, the price of ethanol, and the price of gasoline. Notice the price of gasoline and the price of ethanol are highly correlated, at least since 2009. For example, in 2010, the price of gasoline and the price of ethanol were ~$2.00 per gal. However, in recent months, with the price of oil going down significantly, expect that the profitability of ethanol will be less.
Credit: USDA ERS
The major cost in producing ethanol from corn is the cost of the feedstock itself. Figure 11.6 shows the cost of feedstock is 55% of the expenses for the production of ethanol from corn, while energy is 21%, materials are 11%, and maintenance and personnel are 13%. If a bushel of corn sells for $4/bu or more, then the percentage for the feedstock price goes to 65-75% of the expenses.
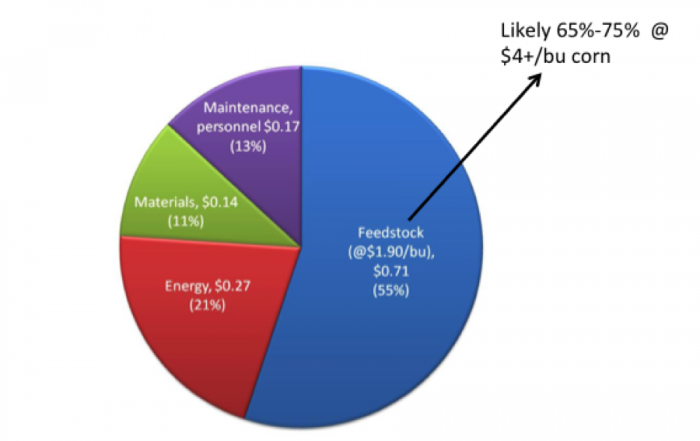
Credit: Shapouri, H., & Salassi, M. (2006). The Economic Feasibility of Ethanol Production from Sugar in the United States.
Another issue with the production of ethanol is that water is used, and water is becoming less available. Water is used for gasoline production as well, but water use is a little higher for ethanol production (for gasoline, 2.5 gallons water per gallon of gasoline is used, while for ethanol it is 3 gallons of water per gallon of ethanol). The extra water use is due to growing the plants for harvest.