
6.1.6: Formative Assessment- Mapping Trends in Soil Properties
- Page ID
- 48229

Instructions
You will complete an activity on mapping trends in soil properties using an online soil mapping resource. The emergence of tools such as this to visualize global and national soil data easily and with full public access is revolutionizing information about soils and management constraints in different regions of the world. Please download the worksheet so that you can fill it in (either on paper or preferably just by writing in your responses in MS Word).
The two web resources you will need for this worksheet are placed here so you can access them while you fill in the worksheet.
Mainly you will need the International Soil Resource Information Centre's soil mapping resource of the world, SoilGrids. Click past the intro window that will appear in the center of the screen and then pan the map to the area of interest as identified in the worksheet.
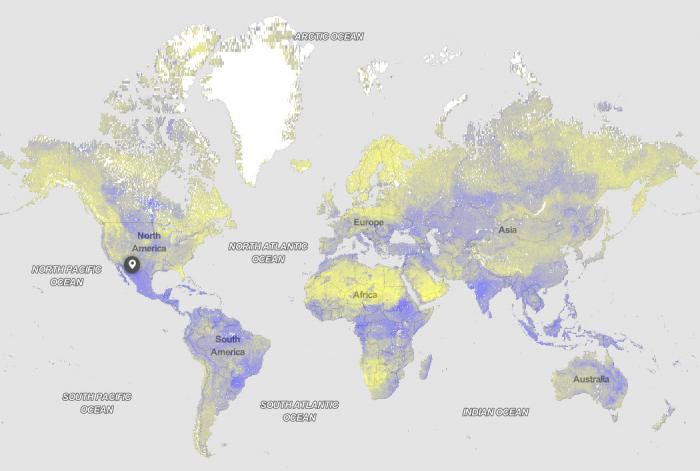
Figure 5.1.7.: An example of a map from the SoilGrids data portal. The layer that is shown is the global map of clay content (% clay) in soils, where areas that have more purple are higher in clay content in their surface soils. Credit: The image above and in the downloadable worksheet were generated using the SoilGrids data portal, and are used with permission of the International Soil Reference and Information Centre (ISRIC) according to the terms of an open database license (ODbL). Sharing and adapting of data is permitted.
This is a mapping portal that resembles google earth - you have the ability to pan, zoom in, drag the map with the cursor and mouse (Fig. 5.1.7). When you enter you should see a toolbar in the top right corner. More instructions on the portal are given on the formative assessment worksheet.
You will also need briefly, this online map showing global annual total precipitation.
Files to Download
Download the Worksheet to complete your assessment.
Submitting your assignment
Please submit your assignment in Module 5 Formative Assessment in Canvas.