
11.2.2: Direct Effects of Climate Change on Crops
- Page ID
- 48653

Plants, whether crops or native plant species have adapted to flourish within a range of optimal temperatures for germination, growth, and reproduction. For example, plants at the poles or in alpine regions are adapted to short summers and long, cold winters, and so thrive within a certain range of colder temperatures. Temperature plays an important role in the different biological processes that are critical to plant development. The optimum temperature varies for germination, growth, and reproduction varies and those optimum temperatures needed to occur at certain times in the plant's life cycle, or the plant's growth and development may be impaired.
Let's consider corn as an example. In order for a corn seed to germinate, the soil temperature needs to be a minimum of 50oF. Corn seed typically will not germinate if the soil is colder than about 50oF. The minimum air temperature for vegetative growth (i.e., the growth of stem, leaves, and branches) is about 46oF, but the optimum range of temperatures for vegetative growth of corn is 77-90oF. At temperatures outside of the optimal range, growth tends to decline rapidly. Many plants can withstand short periods of temperatures outside of the optimal range, but extended periods of high temperatures above the optimal range can reduce the quality and yield of annual crops and tree fruits. Optimal reproduction of corn occurs between 64 and 72oF, and reproduction begins to fail at temperatures above 95oF. Reproductive failure for most crops begins around 95oF.
Water availability is a critical factor in agricultural production. We saw in Module 4 how increased temperature leads to increased transpiration rates. High rates of transpiration can also exhaust soil water supplies resulting in drought stress. Plants respond to drought stress through a variety of mechanisms, such as wilting their leaves, but the net result of prolonged drought stress is usually reduced productivity and yield. Water deficit during certain stages of a plant's growth can result in defects, such as tougher leaves in kales, chards, and mustards. Another example, blossom end rot in tomatoes and watermelon, is caused by water stress and results in fruit that is unmarketable (Figure 9.2.4 and for more photos of blossom end rot on different vegetables, visit Blossom end rot causes and cures in garden vegetables).
In addition to water stress and impacts on plant productivity and yield, increased temperatures can have other effects on crops. High temperatures and direct sunlight can sunburn developing fruits and vegetables. Intense heat can even scald or cook fruits and vegetables while still on the plant.
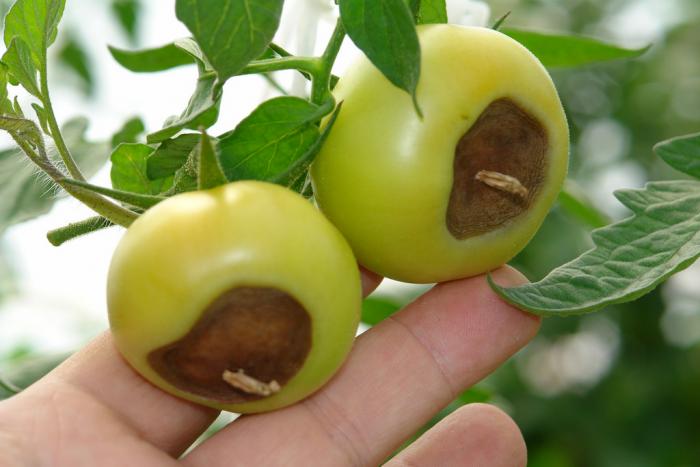
Figure 9.2.4.: Blossom-end-rot in a tomato. Credit: Scot Nelson, Creative Commons
Crop yield
A warming climate is expected to have negative impacts on crop yields. Negative impacts are already being seen in a few crops in different parts of the world. Figure 9.2.5 shows estimated impacts of climate trends on crop yields from 1980-2008, with declines exceeding 5% for corn, wheat, and soy in some parts of the world. Projections under different emissions scenarios for California's Central Valley show that wheat, cotton, and sunflower have the largest declines in yields, while rice and tomatoes are much less affected (Figure 9.2.6). Notice that there are two lines on the graphs in Figure 9.2.6 projecting crop yields into the future. The red line corresponds to temperature increases associated with a higher carbon dioxide emissions scenario. We saw in Module 9.1 that the more CO2 we emit, the more heat energy is trapped in the lower atmosphere, and therefore the warmer the temperatures. For some crops, those higher temperatures are associated with great impacts on the crop's yield.
Why are some crops affected more by observed and projected temperature increases than others? It depends on the crop, the climate in the region where the crop is being grown, and the amount of temperature increase. Consider the Activate your learning questions below to explore this more deeply.
Why do some crops see a positive yield change with increasing temperatures, such as alfalfa in Figure 9.2.6? Generally, warmer temperatures mean increased crop productivity, as long as those temperatures remain within the optimal range for that crop. If a crop is being grown in a climate that has typical temperatures at the cooler end of the plant's optimal range, than a bit of warming could increase the crop's productivity. If the temperatures increase above the optimal range or exceed the temperature that leads to reproductive failure, then crop yields will decline.
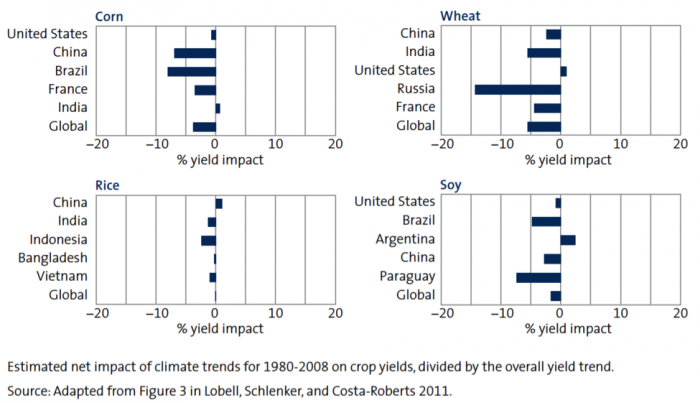
Figure 9.2.5.: Climate change effects on crop yields. Credit: Nelson, 2014
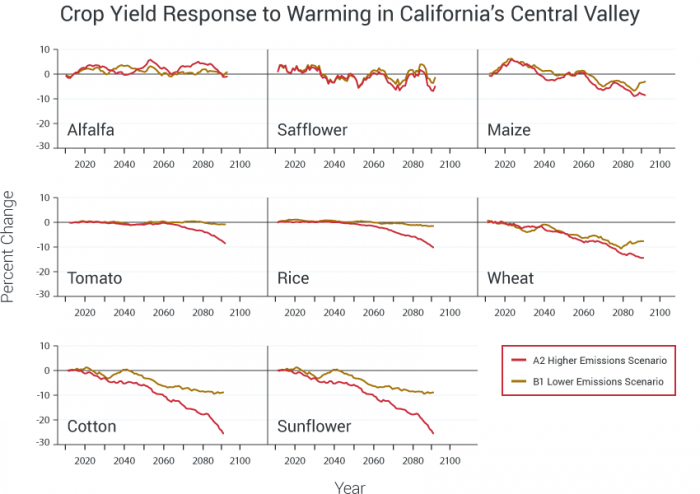
Figure 9.2.6.: Crop Yield Response to Warming in California’s Central Valley. Changes in climate through this century will affect crops differently because individual species respond differently to warming. This figure is an example of the potential impacts on different crops within the same geographic region. Crop yield responses for eight crops in the Central Valley of California are projected under two emissions scenarios, one in which heat-trapping gas emissions are substantially reduced (B1) and another in which these emissions continue to grow (A2). This analysis assumes adequate water supplies (soil moisture) and nutrients are maintained while temperatures increase. The lines show five-year moving averages for the period from 2010 to 2094, with the yield changes shown as differences from the year 2009. Yield response varies among crops, with cotton, maize, wheat, and sunflower showing yield declines early in the period. Alfalfa and safflower showed no yield declines during the period. Rice and tomato do not show a yield response until the latter half of the period, with the higher emissions scenario resulting in a larger yield response. Credit: National Climate Assessment, 2014.
Activate your learning (short answers)
1) Inspect Figure 9.2.5 above. Which crops' yields have already been most affected by climate change, and which crops the least?
(add text box)
- Click for answer
-
Answer: Corn and wheat have seen the largest yield impact. Corn yields were reduced more than 5% in China and Brazil between 1980 and 2008 and wheat yields in Russia were affected nearly 15% and globally more than 5%. Rice has seen the least impact with nearly no yield reduction globally.
2) What are some possible reasons for the difference in yield impact between corn, wheat, and rice that you see in Figure 9.2.5?
(add text box)
- Click for answer
-
Answer: The temperature increase between 1980-2008 produced temperatures outside of the optimal range for vegetative growth and reproduction for corn and wheat, while rice has a warmer range of optimal temperatures. Also, the regions where the different crops are grown may have experienced different ranges of temperature increase between 1980 and 2008.
3) Consider the graph for Wheat in Figure 9.2.5. What is the % yield impact in Russia and United States? What could cause differences in yield impact between regions?
(add text box)
- Click for answer
-
Answer: Between 1980 and 2008, Russia experienced a nearly 15% yield impact on wheat, while the US experienced a slight positive impact on yield of wheat. As we saw in Module 9.1, the temperature increase associated with climate change varies from place to place on the globe, with some regions warming more or less than others. It's possible that the wheat growing regions of Russia experience greater warming from 1980-2008 that exposed their wheat crops to temperatures outside of their optimal range. In addition, some wheat may be being grown in regions where the climate is already on the borderline of being optimal for that crop. So wheat grown in regions where the climate is already near the warmer range of optimal temperatures will see declines sooner. On the other hand, climates that are near the colder side of the optimal temperatures might see an increase in yield with warming temperatures. For example, in the US, wheat is grown in North Dakota where a warming climate could increase yields as the temperatures are more optimal for more of the growing season.