
13.1.4: The Globalized Corporate Food System
- Page ID
- 48664

Consumers worldwide who enter a supermarket are largely interacting with this type of food system. Some local and regional products are provided, but food is largely sourced from major national and global production regions and can be transported long distances (100 to thousands of miles or km) with enormous quantities of food moving through the system as a whole. There is an emphasis on modern production and processing techniques, efficiency, and lowering the immediate costs of production. Also, many of the products moving through this system are thought of as commodities: products that are generic and replaceable regardless of their origin and that carry standard global and national pricing frameworks. Examples would be corn grain for food, different grades of rice, soy and corn oils, supermarket potatoes and tomatoes, and cuts of pork for supermarket consumption.
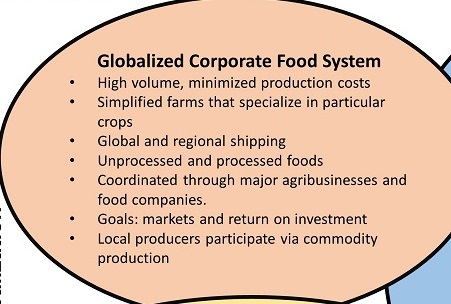
Figure 10.1.6.: Summary of characteristics for the globalized corporate food system, taken from the previous page. Credit: Steven Vanek and Karl Zimmerer.
- Click for a text description of the globalized corporate food system.
-
Globalized Corporate Food System
High volume, minimized production costs simplified farms that specialize in particular crops global and regional shipping unprocessed and processed foods coordinated through major agribusiness and food companies goals: markets and return on investment local producers participate via commodity production
Calling this a ‘corporate’ system may obscure the fact that production for this national/global scale system occurs most commonly not on corporate property or company farms, but in family farm enterprises like the thousands of dairy and grain farms that populate many regions of the United States. For example, family farms still constitute about 97% of farms in the United States by number, although the acreage in company-owned farms and the value earned by these company-owned farms is larger than this numerical count suggests (top pie-charts within Figure 10.1.8a below). Also, in some areas of the country, ‘large’ and ‘very large’ family farms have mean farm sizes of many thousands of acres, which contradicts the traditional image of a small family enterprise, and illustrating the pressures for farms to become large in modern industrialized food systems, in order to take advantage of economies of scale in farming (economies of scale refers to the idea that as the size of an enterprise goes up, the efficiency of producing a given item goes up and the cost per item goes down, e.g. baking one tray of muffins every Saturday versus opening a muffin shop making hundreds of muffins every day).
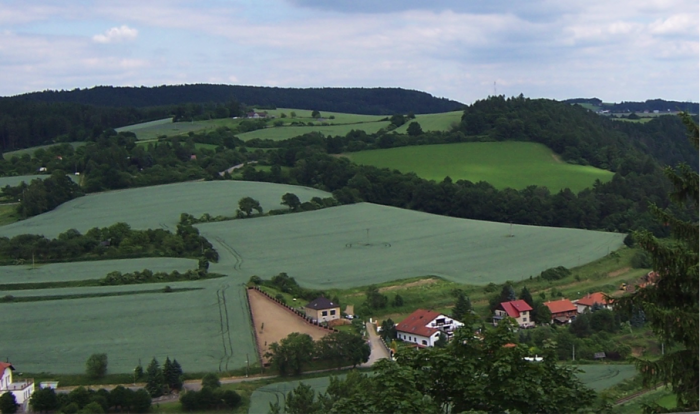
Figure 10.1.7.: This landscape in central Europe appears quite traditional but is, in fact, a production zone for commodity crops in the globalized corporate food system Credit: Steven Vanek
Nevertheless, this portion of the food system is called both ‘global’ and ‘corporate’ because most organizations that coordinate demand and organize processing and distribution of foodstuffs in this layer of the global food system are corporations seeking benefit for their shareholders. In module 3 on nutrition we discussed the way that food has become fiscalized, i.e. it is not only a product working its way through a marketplace to consumers but an active object of investment in the future growth potential of the business of food. These investments are managed through large-scale exchanges like the stock exchange here in the United States. These exchanges allow large swaths of relatively wealthy world citizens (including many in the middle class) to invest in the large-scale production of food and reductions in prices, but can create sustainability issues within the food system because the return on investment rather than food security or environmental sustainability becomes the predominant objective of investors and corporations. Nevertheless, not just corporate entities but also government and civil society (e.g. farmer and community organizations, universities) are also heavily involved in these global systems and can act to reform problems or regulate damaging or unjust practices. They act by way of advocacy and regulation, national/international food policies and support structures such as research on food production and food processing methods.
Within this global system, then, local farmers and fishing communities often act as producers selling into commodity markets, alongside industry-owned farms, feedlots, and other production facilities. In addition to unprocessed food ingredients, the globalized corporate food system has also been largely responsible for the expansion in processed and prepared foods, that seeks to provide convenience for consumers as well as capture the added market value of more prepared foods. Processed foods have been criticized, especially by those advocating community food systems (see description further on), because they displace fresh and whole food components of diets that are important to good nutrition outcomes (see module 3). Processed foods often contain processed industrial ingredients such as corn syrup and processed, low-quality fats along with a lower fiber and vitamin content, which is usually not true of whole unprocessed foods.
Farms and acreage of different crops in United States agriculture:
The pie charts below demonstrate aspects of the description of the globalized food system above. For example, at least in terms of numbers, smaller, family-owned farms with an average size of approximately 240 acres (around 100 hectares with one hectare = 100 x 100 m) dominate the numbers of farms in the United States (Fig. 10.1.8a). Nevertheless, large farms dominate to a greater extent than these smaller farms when considering the total area taken up by farms of different sizes, and a large proportion of income is going to larger operations in a number of classes of farm products (Fig. 10.1.8b). These patterns vary somewhat by what sector of the farming economy is being described, and we include some separate graphs for maize, vegetables, and dairy farms. You will use these graphs in the knowledge check activity below.
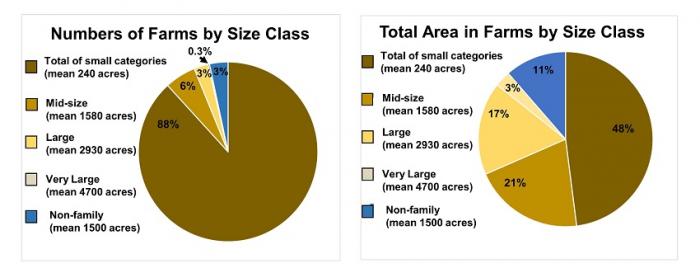
Figure 10.1.8a.: Charts summarizing USDA Census data from the 2012 agricultural census on numbers, size, and earnings of U.S. farms. It is notable that by numbers of farms, smaller farms dominate, but the total area taken up by larger farms is substantially greater than their small numbers would suggest. Image credit: Steven Vanek, based on the United States Department of Agriculture (USDA) 2012 agricultural census
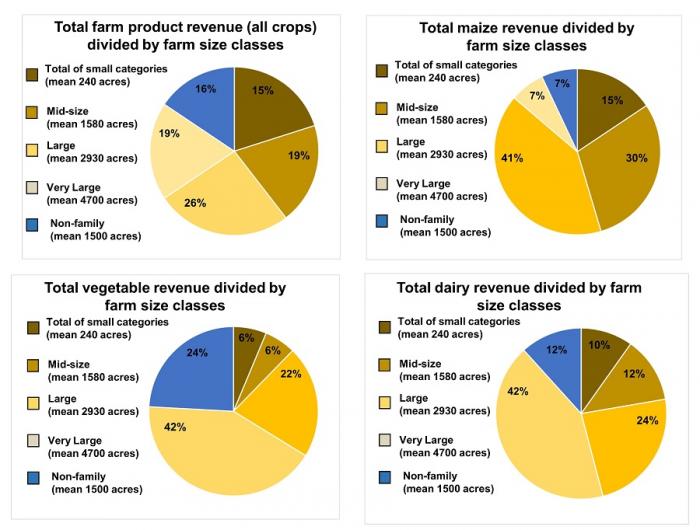
Figure 10.1.8b.: Charts summarizing how the total revenue of farm products breaks down among farms of different size classes. Note that when all farm products are included in the estimates of revenue, there is a relatively even division of revenue among the farms of different size classes. However, the much larger numbers of farms in the small size category (88% of all farms, see figure 10.1.8a above) mean that the revenue per farm for these products is likely less. The graphs allow comparison of different products in terms of how different size classes of farms are participating in the markets for different types of products, e.g. "how do mid-size farms compare in the share of total revenue between maize and vegetables?" Credit: Steven Vanek, based on the United States Department of Agriculture (USDA) 2012 agricultural census.
Knowledge Check: Food products and farm sizes in U.S. agriculture
Choose the correct answers based on the graphs in Figure 10.1.8 above and then click on the space for the correct answers.
Question 1 - Short Answer
Which food product type (maize, vegetables, dairy) above had the largest participation of non-family owned farms, in terms of revenue from sales of that food product type?
(add text box)
- Click for answer
-
Answer:
Vegetables. This means that in Maize and Dairy production, family-owned farms are more important in terms of total earnings.
Question 2 - Short Answer
Which crop type above has the largest participation of family-owned farms in the SMALL category, in terms of value sold?
(add text box)
- Click for answer
-
Answer:
Maize
Question 3 - Short Answer
These charts don’t show the large variation that exists in the distribution of farm sizes around the country, which you will want to incorporate into your capstone project for your capstone region. If you have looked up this information for your capstone, does your capstone region have a smaller or larger average (or median) farm size?
(add text box)
- Click for answer
-
Answer:
Here are some answers for different regions of the country that should help you to estimate how farm size varies: California – in line or larger than these figures; Colorado: in line with these figures on farm size; Pennsylvania: smaller. In particular, the Pennsylvania dairy sector is much less dominated by very large and corporate farm holdings. This is information you will be able to find in the USDA Census county-level reports, which give a breakdown on farmland areas for each county in the United States.
Question 4 - Short Answer
How do you think the “small” category of U.S. farms in land area (236 acres or just under 100 hectares) compares to the average landholdings of the “small” category for countries like Peru, Kenya, or India where smallholders (farmers on relatively small land areas) are a large part of the population?
(add text box)
- Click for answer
-
Answer:
The median small farm size of smallholder farmers in these countries is much smaller, often 10 acres (3-4 hectares) or less, which is less than a tenth of the "small" family farm in the united states.