
13.2.4: Using LCAs, Part Two- Assessing Hot Spots
- Page ID
- 48691

The second main way of using LCA is to assess which steps or process inputs in the production, consumption, and disposal of a product are most responsible for human negative impacts of practices. These “hot spots” in the analysis can then be the focus for better measurement to confirm the findings of the LCA and/or innovations in practices that eliminate these practices or limit their impact. One type of LCA uses the common measure of external energy inputs for food production (i.e., those not related to solar energy that is used by plants "for free") to analyze one aspect of the sustainability of food production. These energy inputs are visualized in Figure 10.2.5.
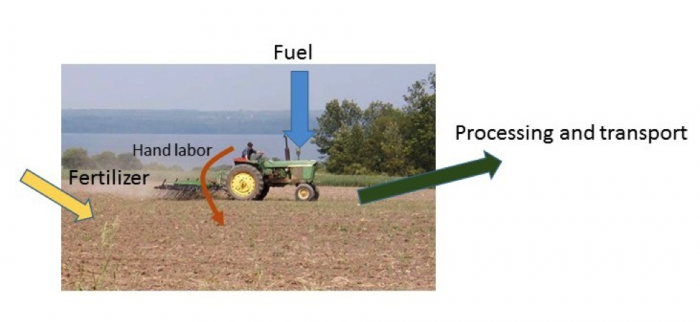
Figure 10.2.5.: Principal human-managed energy inputs involved in food production, in addition to resources of soil and water as well as the solar energy captured by plants. Energy expended in irrigating crops, and in the growing of seed, would be additional flows that might be especially important in other systems. These energy flows are summed up using an LCA approach, noting which ones account for most of the impact, creating "hot spots" that should be researched further and targeted to increase efficiency and reduce the impacts of food production. Credit: Steven Vanek
Dissecting an LCA
An LCA for energy use is illustrated below in Fig. 10.2.6 which shows the comparison of total energy used in different crop production practices in a long-term trial of farming practices in Switzerland. This graph shows the energy used in food production in two formats: stacked colored bars as kilowatt-hours (kWh) energy equivalent per land area under production (i.e. per Ha or 100 x 100 m area) of food production, and also as a total watt-hours (Wh) per kg of food produced (dark green lines and points above the stacked bars).
It's worth considering these results and the units used in more detail. First, for comparison, a typical U.S. home uses about 72 kWh per day for heating, cooling, and electricity, if we boil all these energy uses down to one energy equivalent* (calculations based on the U.S. Energy Information Administration, 2009 data). Some further "ballpark" or rough calculations allow us to see that the fertilizer-based system (bar at right) uses a total of about 100 days of mean household energy**to produce food on one hectare in a year (per year), while the organic system (bar at left) uses a little over half this amount of energy. Meanwhile, if we express this daily household energy use as the energy used for food per kg of food, the 72 kWh become 94 kg of food in the fertilizer-based case at right, and 144 kg of food in the organic management case at left ***. Expressing LCA results as energy per land area and energy per kg food produced are common approaches, analogous to the pollution impact analysis on the previous page. In the summative assessment on the next page, you will use an LCA to calculate energy inputs per kg of potato production in two systems.
* That is the amount of heat and light given off by 30 100-watt light bulbs burning for 24 hours.
** That is, about 7200 kWh (height of rightmost split bar on the left axis showing energy use per hectare), divided by about 72 kWh household use per day, which is equal to 100 days.
*** Dividing 72 kWh by the energy amounts per kg from the green point+line data above the stacked bars, e.g. 72 kWh / 0.77 kWh per kg or 93 kg food for the fertilizer based-case, and 72 kWh / 0.50 kWh per kg, or 144 kg of food, for the organic case.
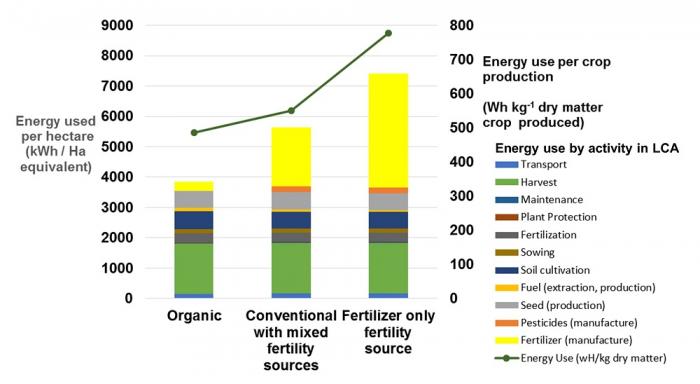
Figure 10.2.6.: Results from a life-cycle analysis on energy use equivalents to compare three farming methods growing a variety of food crops in a long-term research trial (DOK Trial, Therwil, Switzerland). The left Y-axis and stacked colored bars give the energy use per land area (i.e. per Ha or 100 x 100 m land area) and might be helpful to know if we have the total production land area of a farm or region. Meanwhile, the plotted points above each stack and right y-axis give the energy use per kg of dry matter of crops produced, which may be a more useful measure for a food system where we want to adjust for the productivity of different food systems. It is notable that the largest differences between the three systems derive from in the energy used to manufacture chemical fertilizer (yellow bars). Figure adapted from data cited in Nemecek, T. 2005. Life Cycle Assessment of Agricultural Systems: Introduction. Credit: Adapted from data in the study cited in caption (Steven Vanek)
Fertilizer Use as a "Hot Spot" in the Analysis
Two additional observations: first, in this LCA there emerged large differences in energy use that have to do almost completely with the energy used to produce chemical fertilizer, especially of nitrogen fertilizers like those produced in the large fertilizer plant in India shown in Fig. 10.2.2. Energy inputs to fertilizer production are especially high for nitrogen fertilizer because it takes a great deal of energy to fix inert nitrogen in the atmosphere (N2) into reactive forms like ammonium and nitrate that can be easily taken up by crops (see module 5 and other previous modules). Fertilizer use emerges as a "hot spot" in this analysis and might prompt managers or policymakers to work towards reducing fertilizer use by incorporating aspects of the organic and manure-based system into the more conventional, fertilizer-based system. Many energy inputs in agriculture, such as these fertilizer inputs or tractor fuel that are tallied in the LCA above, are important to consider because they represent non-renewable fossil fuel energy sources that contribute to greenhouse gas emissions and anthropogenic climate change through the release of carbon dioxide. The LCA thus helps to measure natural system impacts and sustainability of food systems. Second, this LCA used energy as a yardstick to measure the impact of food production. As we will note for your summative assessment, such an LCA using energy inputs is only ONE measure of sustainability, and may not capture other measures of sustainability, like forest clearing needed to establish agroecosystems, runoff of nutrients that contribute to dead zones, pesticide effects on beneficial insects like pollinators, or whether farming practices provide sustained income and other livelihoods to farmers. As an example of using a different yardstick for LCAs, consider the emissions of greenhouse gases (GHG) by different pork production systems on the previous page, in which the organic management system, in fact, had higher potential to pollute waterways with phosphorus runoff per kg of pork produced, than either conventional or "best practices" red label standard in the European Union. This result contrasts with the favorable result shown on this page for organic management when energy inputs were used as a yardstick.
Knowledge Check: Earth System Impacts and Life Cycle Analysis (short answers)
Question 1 - Short Answer on types of impacts from food system activities
One of the skills involved in building life-cycle analyses is the ability to conceptualize all the different impacts on natural systems related to the different functions of production, transport, and consumption of a product. The activities give below in each question form a part of the functioning of food systems. Identify an impact or impacts on the natural system (e.g. soil erosion, air pollution, water pollution) that would most likely result from these activities, based on the material in this module and previous modules. Then check your answers by clicking on "click for answer" as a review.
Transporting food by ship and truck:
(add text box)
- Click for answer
-
Answer:
greenhouse gas emissions from burning fuel, other air pollution from burning fuel
Applying manure to soils:
(add text box)
- Click for answer
-
Answer:
water pollution from nitrogen and phosphorus drainage and runoff if over-applied, and no measures in place to retain nutrients in soils (cover crops, riparian barriers that keep nutrients out of waterways). Greenhouse gases, especially N2O, will be emitted if manures are applied on waterlogged soils, and methane as a greenhouse gas is associated with the animal production (especially cows) used to produce the manure.
Applying fertilizer to soils:
(add text box)
- Click for answer
-
Answer:
greenhouse gases because of fertilizer manufacturing, greenhouse gas due to denitrification and N20 emission, water pollution if over-applied as in the case of manure above.
Tillage of soils:
(add text box)
- Click for answer
-
Answer:
if practiced irresponsibly, soil erosion; siltation of waterways; greenhouse gas emission from mechanized tillage with tractors; emission of carbon as carbon dioxide that was once part of organic matter in soils.
Pesticide and herbicide application:
(add text box)
- Click for answer
-
Answer:
toxicity to organisms in the environment, e.g. honey bees, other beneficial insects and water pollution; evolving resistance of pests and weeds, greenhouse gas emissions from manufacture, transport to farms, and application with tractors
Question 2 - Short Answer
As preparation for doing your own life-cycle analysis, make a list of all of the energy needs you can think of that go into both manufacturing and operating a car. You may want to also refer to the NCAT/ATTRA required reading to review an example life cycle analysis:
(add text box)
- Click for answer
-
Answer:
mining and refining metal ore to make steel, refining oil and synthetic production of plastics and paint, energy for water supply to all manner of production processes, burning gasoline or diesel in the engine for running the car, etc.