
4.5: Measurement of Gaseous Emissions from Animal Housing
- Page ID
- 46854

Mélynda Hassouna
UMR Sol, Agro et hydrosystèmes et Spatialisation, INRAe, Agrocampus, France
Salvador Calvet
Institute of Animal Science and Technology, Universitat Politècnica de València, Valencia, Spain
Richard S. Gates
Agricultural & Biosystems Engineering, and Animal Sciences, Iowa State University, Ames, Iowa, USA
Enda Hayes
Air Quality Management Resource Centre, Department of Geography and Environmental Management, University of the West of England, Bristol, United Kingdom
Sabine Schrade
Ruminants Research Unit, Federal Department of Economic Affairs, Education and Research EAER, Agroscope, Ettenhausen, Switzerland
| Key Terms |
| Emission processes | Mass balance | Ammonia |
| Measurement techniques | Validation | Greenhouse gases |
| Sampling | Ventilation |
Variables
Introduction
Animal housing and manure storage facilities are two principal on-farm sources of gaseous emissions to the atmosphere. The most important pollutants emitted are ammonia (NH3), methane (CH4), and nitrous oxide (N2O).
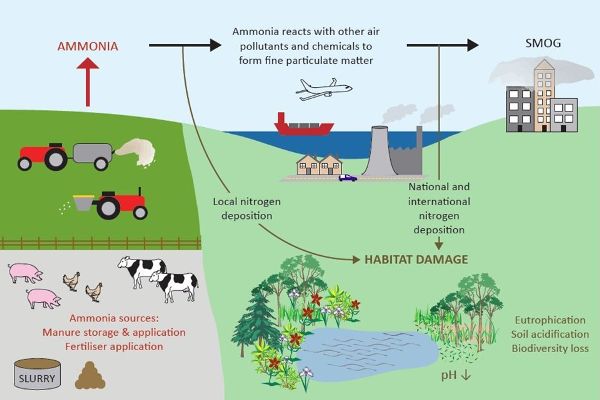
Ammonia (NH3) is a colorless gas with a pungent smell that can have impacts on environmental and human health (Figure 4.5.1). Ammonia is emitted by many agricultural activities, including crop production as well as animal production. Ammonia plays a key role in the formation of secondary particulate matter (PM) by reacting with acidic species such as sulfur dioxide (SO2) and nitrogen oxides (NOx) to form fine aerosols, and is thus called a particulate precursor. The PM created by the reaction of NH3 and acidic species in the atmosphere contributes to poor air quality including regional haze. These particles have an aerodynamic diameter of less than 2.5 microns and are generally referred to as “PM-fine.” They are readily inhaled and populations exposed to PM-fine have greater respiratory and cardiovascular health risks such as asthma, bronchitis, cardiac arrythmia and arrest, and premature death. Some emitted NH3 is subsequently deposited on land and water downwind of facilities, and can acidify soils and freshwater. The addition of available nitrogen (N) to low-nutrient ecosystems disturbs their balance and can alter the relative growth and abundance of plant species.
Nitrous oxide and CH4 are potent greenhouse gases (GHGs) which contribute to global warming. The global warming potential (GWP) is a factor specific to each GHG and allows comparisons of the relative global warming impacts between different GHGs. This factor indicates how much heat a given gas traps over a certain time horizon (usually 100 years), compared with an equal mass of carbon dioxide (CO2). Nitrous oxide GWP for a 100-year time horizon is 265 with a lifetime in the atmosphere of 114 years. Methane GWP for a 100-year time horizon is 28 with a lifetime in the atmosphere of 12 years.
Nitrous oxide, also known as “laughing gas,” is colorless and odorless, and contributes to the destruction of the atmospheric ozone layer. In agriculture, the main source of N2O emissions is soil, from crop fertilizer use, soil cultivation, and spreading of urine and manure. Other sources include industrial processes, and natural processes involving soils and oceans.
Methane is a volatile organic compound, odorless and flammable. In agriculture, the main sources are enteric fermentation (fermentation that takes place in the digestive systems of animals) and the degradation of manure. Methane contributes to ozone formation in the lower atmosphere, and to ozone layer depletion in the upper atmosphere.
Researchers and engineers have developed different approaches to reliably measure and quantify emissions of NH3, N2O, and CH4 from animal production facilities. The implementation of these methods helps to understand the production processes, to identify the influencing factors, and to develop mitigation techniques or practices. The specific characteristics of animal housing and the variability of the houses and animal production systems make the development and implementation of the different methods a real challenge.
Concepts
Animal Houses
Animal housing is designed to provide shelter and protection with control of feed consumption, diseases, parasites, and the interior thermal environment. An animal house is designed to take into account animal heat and moisture production, building characteristics (e.g., insulation and volume), and outdoor climate. Inside the house, animals produce the following critical components that affect emissions:
- • sensible heat that is transferred to the interior air by means of convection, conduction, and radiation, and causes an increase of air temperature;
- • latent heat that is generated through the evaporation of moisture from the lungs, skin, urine, and fecal material, and through increases of air humidity;
- • mixtures of feces and urine, which become a source of gaseous emissions (NH3, N2O, CO2, water vapor, CH4), and heat; and
- • CO2 from animal respiration.
The control of temperature, moisture, gas concentrations and dust concentrations inside the house is essential to achieve optimal conditions for animal growth and production. The optimal conditions vary as a function of animal age, species, and breed, and rely on the implementation of ventilation systems. The ventilation system partly controls the rate and total emissions from the building. There are two types of ventilation systems: mechanical and natural. The RAMIRAN European network (RAMIRAN, 2011) defines the two systems as:
- • mechanical ventilation, which is ventilation of a building, usually for pigs, poultry, or calves, through the use of electrically powered fans in the walls or roof that are normally controlled by the temperature in the building; and
- • natural ventilation, which is ventilation of a building, e.g., for cattle, by openings or gaps designed into the roof and/or sides of the building.
NH3, N2O, and CH4 Emissions Processes in Animal Housing and Influencing Factors
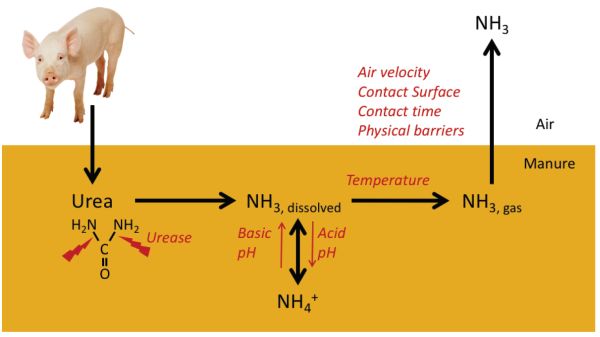
Ammonia is volatilized as a gas during manure management. It is mainly derived from the urea excreted in urine (or uric acid in the feces, in the case of poultry). The process of forming NH3 from urea is relatively fast and is outlined in Figure 4.5.2. Once excreted, urea is decomposed within a few hours to a few days into ammonium (NH4) by means of the enzyme urease, which is widely present in feces and soils. Ammonium is in equilibrium with dissolved NH3 enhanced at high pH values. A second physical equilibrium exists between dissolved and free NH3 in the manure matrix. Finally, the free NH3 can be released to the atmosphere. This is a mass transfer process affected by air velocity, diffusion from beneath the surface, and exposure to air on the surface of the manure.
This is a continuous process that starts in the animal housing itself and continues during manure management and land application. Several factors are involved in the amount of NH3 emitted to the atmosphere:
- • manure composition; the most relevant factors are the amount of urea excreted by the animals, the pH of the manure, and its moisture content;
- • the environmental conditions, particularly temperature and wind speed above the emitting surface;
- • the facilities for animal housing and manure management; and
- • management practices, particularly those altering the contact of manure with air, and urine with feces, by reducing time of exposure or contact surface.
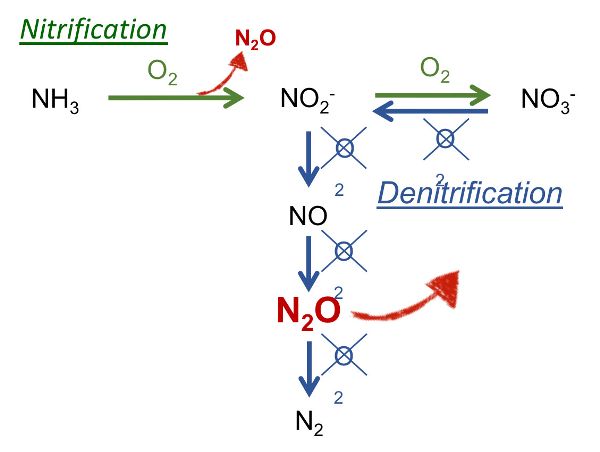
On farms, N2O originates from the management of manure and its application to land as fertilizer. Emission of N2O occurs from the successive nitrification and denitrification of NH4. A first aerobic phase is required for the nitrification, while anoxic conditions are required for denitrification (Figure 4.5.3). These conditions are characteristic of the following situations:
- • composting with alternative wetting, mixing, and drying periods;
- • aerobic treatment of slurry;
- • air cleaners at the air exhaust of the animal house based on biological scrubbing of air; and
- • application of manure to soil and subsequent drying-wetting events.
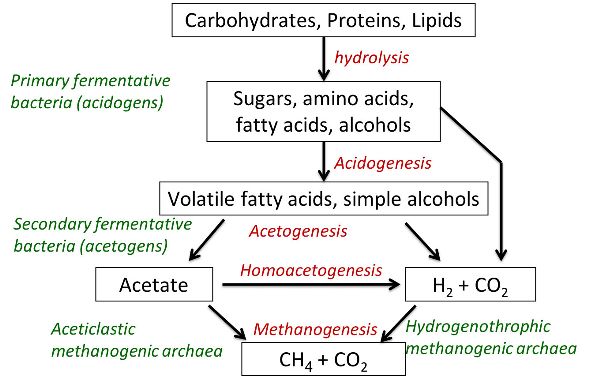
Methane is produced during the anaerobic decomposition of organic matter. This occurs mainly during digestion in ruminants and decomposition of manure. In this process, the microbial breakdown of organic matter occurs in different stages, from more complex molecules to the simplest. The main mechanism is presented in Figure 4.5.4. Apart from the presence of organic matter and anoxic conditions, time (a few weeks) is needed to complete the process, and the process may be inhibited due to certain conditions, such as NH3 accumulation. In contrast to NH3, CH4 has very low solubility in water and, once produced, is released to the atmosphere through a characteristic bubbling, in the case of slurries.
For enteric fermentation in ruminants, key factors are feed composition and genetics. More digestible feeds reduce the amount of CH4. Feed constituents such as lipids or essential oils may reduce CH4 production through inhibition. Genetics also influence the amount of CH4 produced and can be modified through animal genetic selection.
CH4 emission during manure management is due to the presence of organic matter subjected to anaerobic conditions for sufficient time (about one month, at least) for methanogenic bacteria to develop. The amount and composition of organic matter determines the maximum potential for CH4 formation. Manure management practices that interrupt anaerobic conditions, reduce the load of organic matter, or feature biogas capture are potentially effective for mitigating emissions.
Measuring Emissions from Animal Housing
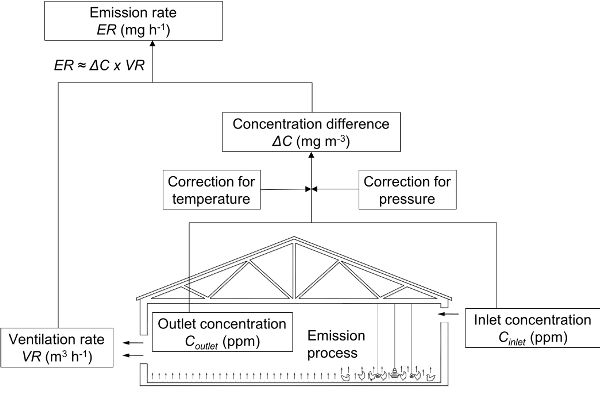
The most common approach used to determine gas emission rates from animal houses is based on quantifying ventilation rates and inlet and outlet concentrations of the gas (Figure 4.5.5). The mass flow rate of emitted gas (emission rate or ER) is proportional to the ventilation rate and the concentration difference between exhaust and outside air. Several different techniques are available to measure gas concentrations inside and outside the house and the ventilation rate.
Gas Concentration Measurement Techniques
The techniques used most often to measure NH3, CH4, and N2O concentrations of animal houses are either physical (optical, gas chromatography, chemiluminescence) or chemical (acid traps, active colorimetric tubes).
Optical Techniques
Optical techniques are based on the Beer-Lambert absorption law, which indicates that the quantity of light of a given wavelength absorbed is related to the number of gas molecules in the light’s path that are able to absorb it.
Optical techniques rely on the use of a light source, a chamber to contain the air sample during measurement, and a detector to quantify the target gas absorption. The main techniques used in animal houses are infrared (IR) spectroscopy (photoacoustic or Fourier transform), tunable diode laser absorption spectroscopy (TDLAS), off-axis integrated cavity output spectroscopy (OA-ICOS), and cavity ring-down spectroscopy (CRDS). Differences between these techniques include the detection principle of absorption and the type and wavelength of light sources (quantum cascade laser, tunable diode laser, or IR source). Techniques using lasers (a monochromatic source with a narrow band of wavelengths) are more selective, accurate, and stable than techniques with a polychromatic IR source (i.e., large band of wavelengths) because selection of the absorption of a specific wavelength from a polychromatic IR source is difficult to achieve.
One main advantage of optical techniques is that they make monitoring of concentration dynamics in near real time possible, including monitoring several gases with different concentrations at the same time (Powers and Capelari, 2016). Advantages of optical instruments include linear responses over a wide range of concentrations and the ability to measure concentrations both inside (where there could be a high concentration level) and outside (low concentration level) the animal house with the same instruments. Most optical instruments have response times adapted to measurement in animal houses. They are portable and can be used on site. Nevertheless, they can be expensive, must be calibrated, and still require accurate estimation of ventilation rate.
Gas Chromatography
A gas chromatograph separates components in the sample and measures their concentrations. The equipment has four basic elements: an injector, a column, an oven surrounding the column, and a detector. The sample is vaporized in the injector and swept by the carrier gas through a heated column. The column separates each compound according to its polarity and boiling point. The detector identifies and quantifies the compounds separated. The detectors include a flame ionization detector for CH4 and CO2 and an electron capture detector for N2O. This technique is accurate if the detector has been calibrated for the range of concentrations measured. It requires use of a carrier gas and regular calibration, which makes on-site implementation and continuous measurement difficult. It is often used to measure previously collected samples.
Chemiluminescence
Chemiluminescence is used to measure NH3 concentration. NH3 in the sample is first oxidized to N2O by a catalytic converter, and then the N2O is further oxidized to nitric oxide (NO) at high temperature and an elevated energy state. As the molecules return to a lower energy state, they release electromagnetic radiation at a specific wavelength, which is measured and quantified.
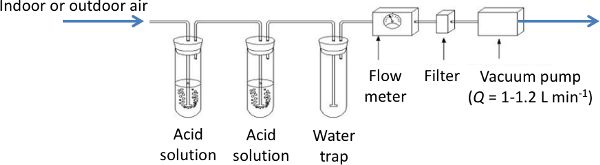
Acid Traps
An acid trap is a standard reference technique for measuring NH3. A known volume of air is pumped through an acid solution and recorded (Figure 4.5.6). The acid solution is later analyzed in the laboratory with a colorimetric or photometric method (Hassouna et al., 2016) to estimate the amount of NH3 trapped in the solution, as:
\[ NH_{3,trapped} = [N-NH_{4}^{+}]_{acid\ solution} \times m_{acid\ solution} \]
where NH3,trapped = amount of NH3 trapped in the solution (kg)
[N-NH4+]acid solution = concentration of ammonium in the acid solution (kg kg−1)
macid solution = mass of the solution (kg)
From this, NH3 concentration in the air sample (\(C_{N-NH_{3}, air}\) in kg m−3) can be calculated as:
\[ C_{N-NH_{3, air}} = \frac{NH_{3, trapped}}{V_{sample}} \]
where Vsample (m3) is the volume of air that passed through the solution.
Strong acid solutions are used, such as boric acid, orthophosphoric acid, nitric acid, and sulfuric acid. The trap can be used for a few hours or a few days depending on the NH3 concentrations in the incoming air, the acid concentration, and volume of acid solution in the vials. Sampling time and concentration should be determined before the experiment as a function of the expected NH3 concentrations. Two vials with acid solution are used sequentially to avoid saturating a single solution. This technique provides a mean NH3 concentration over the sampling period and thus is not suitable for studies that require monitoring dynamics of NH3 concentrations in a house. Nevertheless, as it is not expensive or too time-consuming, it can be used to check the consistency of measurements made, for instance, with optical techniques.
Active Colorimetric Tubes
Active colorimetric tubes are a manual technique that can be used to estimate NH3, NO, volatile organic compounds (VOC), and CO2 concentrations. Tubes are manufactured to react to a specific range of concentrations of a specific target gas. Before measurement, both ends of a sealed test tube are cut open. The tube is connected tightly to a hand pump, which draws air through the tube. If present in the air, the target gas reacts with reagents in the tube. The strength of the reaction is proportional to the concentration of the gas in the air. A graduated scale is used to read the degree of color change in the tube, which indicates the concentration of the target gas. Many of the reactions used are based on pH indicators, such as bromophenol blue to measure NH3 concentrations. Gas concentration is expressed in ppm or mL m−3. This technique is reliable and simple to use. It can be used to estimate concentrations, but not to measure them continuously or accurately.
Ventilation Rate
In mechanically ventilated houses with modern ventilation control systems, ventilation rate could be one of many data recorded continuously. In such situations, the data are thus easily available for emission calculations. For other houses, or if the time step of recording is not suitable or recorded data are not reliable, the ventilation rate must be measured or assessed. Different methods to estimate the ventilation rate have been evaluated and described in the literature (Ogink et al., 2013; Wang et al., 2016). The method chosen depends on the type of ventilation (natural or mechanical), the accessibility of the exhaust to make physical measurements, the level of ventilation rate, and the desired degree of accuracy. Some techniques are indirect (tracer gas, heat balance), while others are direct (fan wheel anemometer, specialized instruments).
Tracer Gas Techniques Using Artificial Tracer Gases
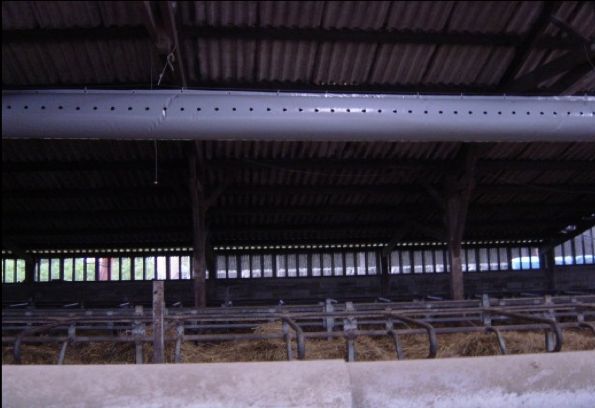
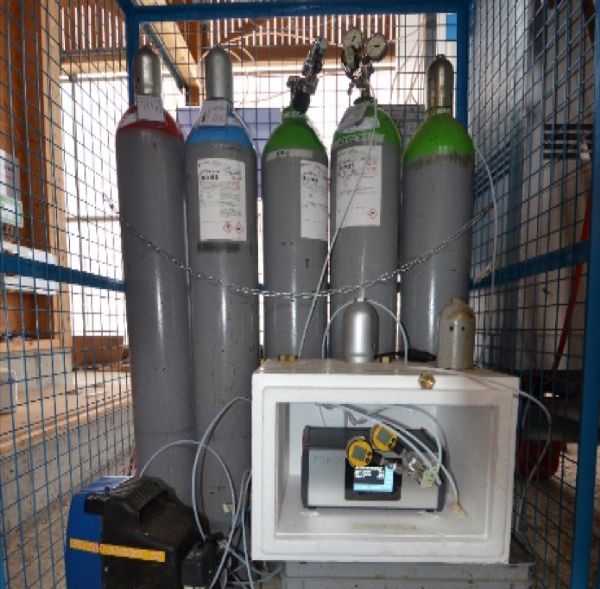
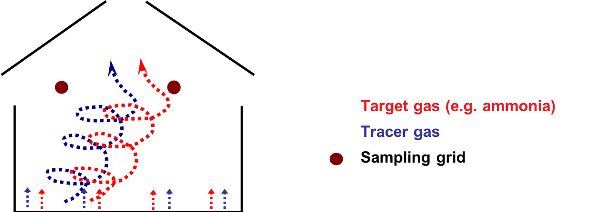
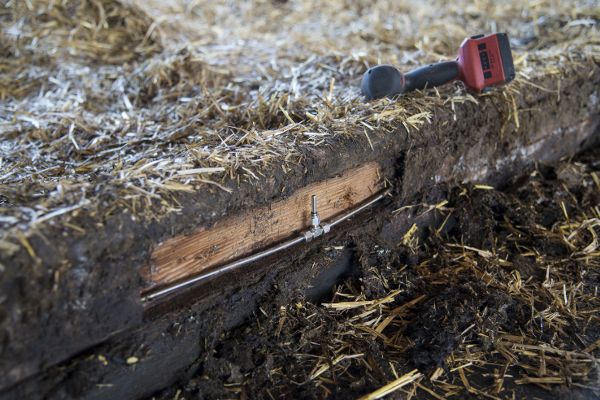
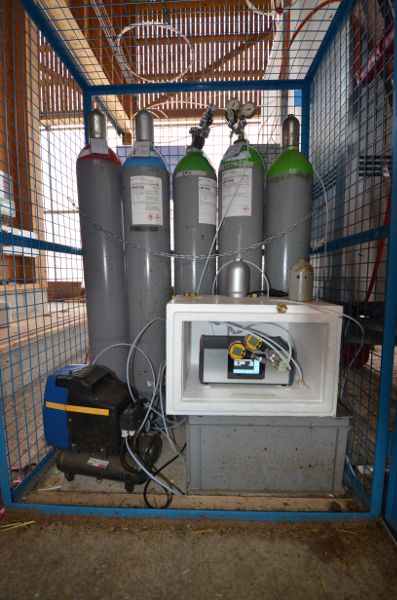
Tracer gas techniques are commonly used to quantify the ventilation rate in many kinds of houses, but mainly those with natural ventilation. An external tracer gas should be safe, inert, measurable, not produced in the house, and inexpensive (Phillips et al., 2001; Sherman, 1990). The most common tracer gas used in animal houses is sulfur hexafluoride (SF6) (Mohn et al., 2018). A critical requirement is that of near-perfect air mixing inside the animal house to ensure that the tracer gas and the targeted gas (for emission calculations) being measured both disperse in a similar way. Air can be mixed artificially using a purpose-built ventilation duct (Figure 4.5.7). Tracer gases can be dosed automatically using a mass flow controller and critical orifices (Figure 4.5.8).
The basic principle for tracer gas techniques is conservation of mass (of both target gas and tracer gas). By monitoring the dosed mass flow and concentration at the sampling points of the tracer gas, the ventilation rate can be determined (Figure 4.5.9). A tracer gas release technique is chosen based on the ventilation rate, the detection limit of the device used to monitor tracer gas concentration, and the ability to control and monitor the dosed mass flow accurately. According to Ogink et al. (2013), three tracer gas release techniques can be distinguished:
- • constant injection method: tracer gas is injected at a constant rate, and its concentration is measured directly over a period of time and used to estimate the ventilation rate;
- • decay method: tracer gas is injected until its concentration stabilizes, then injection is stopped and the decay in concentration is used to calculate the ventilation rate; and
(a)
(b)
Figure \(\PageIndex{8}\): (a) Tracer-gas dosing by steel tubes with critical orifices protected by steel elements next to the floors in a dairy housing; (b) gas bottles with mass-flow controller.
- • concentration method: tracer gas is distributed in the air of a house to a certain concentration to be constant.
Only the constant injection method and the decay method are common for measurements in animal houses.
To calculate the emission or mass flow of the target gas (e.g., NH3, CH4), a background correction of the concentration (Cx) must first be calculated for the target gases and the tracer gases:
\[ C_{x} = C_{x, id} - C_{x, bgd} \]
where x = T (tracer gas) or G (target gas)
Cx,id = indoor gas concentration (μg m−3)
Cx,bgd = background gas concentration (μg m−3)
The ratio of the background concentrations of emitted (target) gas, CG, and tracer gas, CT, then corresponds to the ratio of their mass flow rates (\(\dot{m}\), g d−1):
\[ \frac{\dot{m}_{G}}{\dot{m}_{T}} = \frac{C_{G}}{C_{T}} \]
and thus
\[ \dot{m}_{G} = \frac{\dot{m}_{T}C_{G}}{C_{T}} \]
Carbon Dioxide (CO2) Mass Balance or Tracer Gas Methods Using an Internal Tracer
The CO2 mass balance method is sometimes considered a tracer gas technique in which CO2 is used as an internal tracer, that is, not dosed but produced by animal respiration and manure. It can be used in naturally or mechanically ventilated houses. It is based on the hypothesis that ventilation rate determines the relationship between CO2 production in the house and the difference in CO2 concentrations between the inside and outside of the house. This method has been widely described (Blanes and Pedersen, 2005; Estellés et al., 2011; Samer et al., 2012) and is more accurate in buildings with no litter and no gas heating system.
The ventilation rate for the house can be calculated as:
\[ VR = \frac{\text{total heat per house}\times \text{ventilation flow per hpu}}{1000} \]
where the total heat produced for the entire house is expressed in heat production units (hpu; 1 hpu is 1 kW of total animal metabolic heat production at 20°C) and the ventilation flow per hpu is in m3 h−1 hpu−1.
The International Commission of Agricultural Engineering provides a method to calculate total heat production (sensible plus latent) for different animal categories (Pedersen and Sällvik, 2002). For instance, for fattening pigs, the total heat produced for the entire house is calculated by multiplying the total heat per animal (in W animal−1) by the number of animals and converting to heat production units as:
\[ \text{total heat per house} = \text{total heat per animal} \times \text{number of animals} \]
\[ \text{total heat per animal} = (5.09\times m^{0.75} +[1-(0.47+0.003 \times m)] \times [(n \times 5.09 \times m^{0.75}) - (5.09\times m^{0.75})] \]
where m = animal mass (kg)
n = feed energy in relation to the heat dissipation due to maintenance (g d−1)
Ventilation flow per hpu varies as a function of animal activity at different times of the day and difference between indoor and outdoor CO2 concentrations:
\[ \text{Ventilation flow per hpu} = \frac{c \times (\text{relative animal activity})}{(CO_{2,indoors}-CO_{2,outdoors})\times 10^{-6}} \]
where c = CO2 production (m3 h−1 hpu−1); varies as a function of animal type (Pedersen and Sällvik, 2002; Pedersen et al., 2008).
\( CO_{2, indoors} \text{ and } CO_{2, outdoors} = \text{measured indoor and outdoor } CO_{2} \text{ concentrations at time h (mL m}^{-3}) \)
Relative animal activity is calculated as:
\[ \text{Relative animal activity} = 1-a\ sin[(\frac{2\pi}{24} \times (h+6-h_{min})] \]
where a = constant expressing amplitude with respect to the constant value 1, which is a scaling factor based on empirical observation and which varies depending on the animal type (Pedersen et al., 2008)
h = time at sampling (this should be a decimal number 0 ≤ h ≤ 24), e.g., (2:10 = 2.2)
hmin = activity factor that relates to the time of day with minimum activity (hours after midnight) (Pedersen and Sällvik, 2002)
Use of Sensors
Fan wheel or hot wire anemometers can be used to quantify ventilation rate in mechanically ventilated houses that draw outlet air through ducts or exhaust fans. One important requirement is having access to exhaust flow where the measurements are to be made, which is not possible in many animal houses.
The anemometer measures air velocity, and ventilation rate (VR) is calculated as follows:
\[ VR=sA \]
where s = mean airspeed (m h−1)
A = cross-sectional area of the ventilation duct or air stream (m2)
Proper methods must be utilized to obtain representative mean air velocity over the flow area, for example by selecting a sufficient number of measurement points and applying either log-linear or log-Tchebycheff rules (ISO 3966, 2008) for measurement points spacing.
Use of anemometers is not recommended in naturally ventilated houses because of their rapid change in air fluxes and large size of the open area, which would require many sensors to obtain a representative estimate of the ventilation rate.
In mechanically ventilated houses, continuous monitoring of the static pressure differential and the operating status (on-off) of each fan can be used to estimate the fan’s ventilation rate based on its theoretical or measured performance characteristics. Ideally, the in situ performance of each fan is determined first, and the house ventilation rate can be estimated by summing all operating fan flow rates. For example, Gates et al. (2004, 2005) developed and improved a fan assessment numeration system (FANS) to measure the in situ performance curve of ventilation fans operating in a negative pressure mechanically ventilated animal house (Figure 4.5.10). This unit is placed either against a fan on the inside of the house, or at the fan exterior with appropriate flexible ducting (Morello et al., 2014) to direct all airflow through the unit. A series of anemometers traverse the entire flow area to obtain a single mean air velocity, which is multiplied by the calibrated unit cross sectional area. A series of these measurements taken at different building static pressures provides an empirical fan performance curve, obtained, for example, from the regression equation of measured flow on building static pressure. Then, measurements of fan run-time and concurrent static pressure can be used to determine reasonably accurate airflow rates for each fan, and their sum is the building ventilation rate. Previous work has clearly shown that neglecting to account for building ventilation by means of direct measurement results in substantial loss in accuracy of estimates for ER, due to the variation among fans.
The Mass Balance Approach for a Global Estimation of N and C Emissions and Emissions Measurement Validation
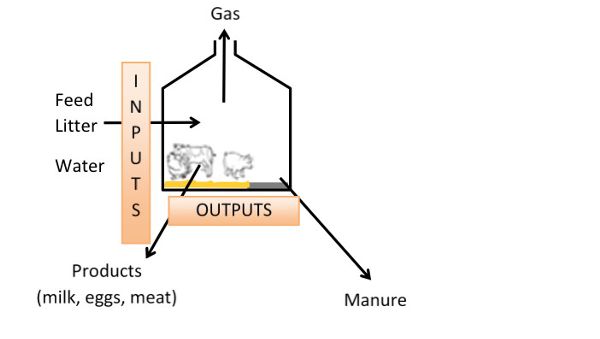
A mass balance approach estimates emissions based on changes in livestock over time, without the need to measure emissions directly (Figure 4.5.11). The approach estimates total N or C emissions rather than emissions of specific gases (e.g., N-NH3, N-N2O, N2, C-CH4, C-CO2) or emission dynamics. The accuracy of mass balance calculations depends on the technical and livestock management data available, characterization of the manure and feed, and, in certain cases, the length of the period considered. To test the validity of the data used to calculate an N or C mass balance, those of non-volatile elements such as phosphorus (P) and potassium (K) must be calculated. As the latter elements are non-volatile, their mass balance deficits (difference between inputs and outputs) should be zero, but the data used in calculations will have uncertainty, especially under commercial conditions. If the mass balance deficit for P and K is too high (e.g., > 15%), then the estimates of total N and C emissions must be reconsidered.
The estimation of N, C, or water emissions (X emissions, where X is for N, C, or water) over the production period can be calculated according to the following equation:
\[ X_{inputs}-X_{outputs} = X_{emissions} \]
Xinputs and Xoutputs are the quantity of X in all inputs and outputs. The estimation of these quantities requires careful data collection (quantities, chemical compositions) concerning animals, feed, eggs or milk (a function of animal production), litter, manure, and animal mortality. Models should be used to estimate the quantity of X in animals as a function of their weight.
Applications
Implementing the different emissions measurement methods in an animal house requires the development of a protocol based on the objectives of the project, the specifics of the animal house, the interior environment, and outdoor weather. Three important points that should be considered in a protocol concern the sampling, the data acquisition, and the validity check of the measurements.
Sampling and Sensor Locations
Evaluation of gas emissions requires measurement of inlet and outlet gas concentration. Sampling at air inlets or outlets is recommended if they can be identified, if their locations are fixed over the measurement period, and if they can be easily reached. When these conditions cannot be fulfilled, multiple locations inside the house are usually selected to provide a mean indoor concentration to accommodate spatial variability of indoor concentration. The same should be done for outdoor concentration.
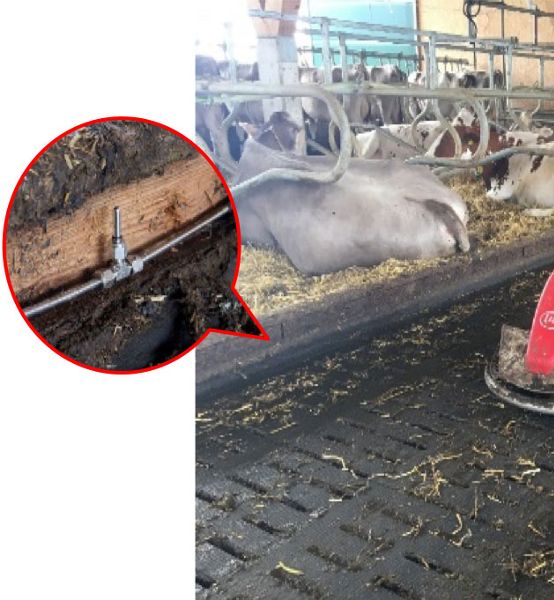
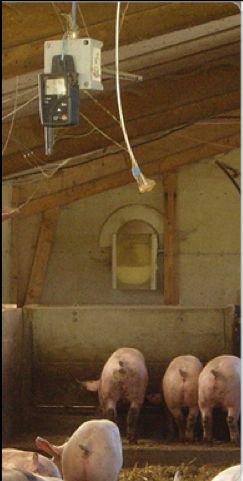
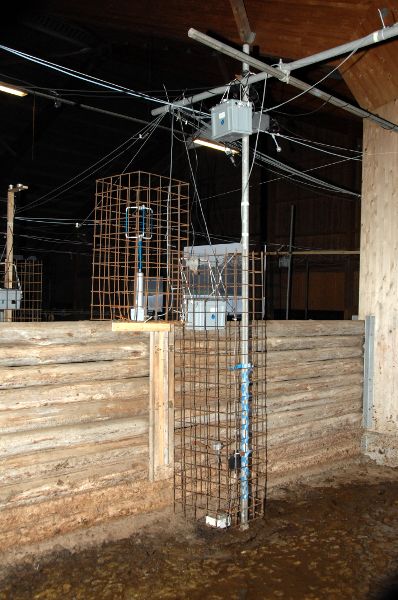
The presence of animals inside the animal area makes installation of gas sensors or sampling tubes more complicated. Ideally, they should be installed when no animals are in the house, such as during an outdoor or vacancy period. They should be located where animals cannot bite, bump, or move them, and should be carefully protected from animals (Figure 4.5.12). Successful sensor placement requires a trade-off between minimizing animal disturbance and maximizing the representativeness of measurements.
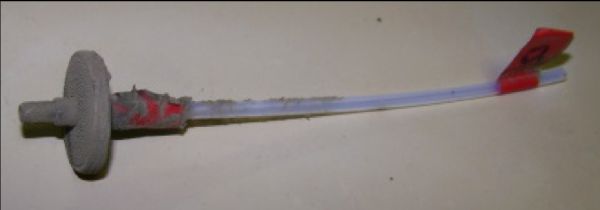
The environment inside animal housing is generally harsh for sensors and the air sampling system. Direct exposure to the combination of humidity, NH3, and suspended particulate matter can damage the sensors (Figure 4.5.13). Furthermore, indoor air is generally warmer and more humid than outdoor air because of animal heat production or the use of a heating or cooling system inside the house. These differences should be considered when sampling indoor air; for example, sampling tubes should be heated and insulated if air samples are analyzed in a cooler place and condensation within sampling lines might be expected.
Data Acquisition
During the production period, emissions can vary greatly during a 24-hour cycle and over longer time intervals. Variability is due to the same parameters that affect spatial variability, changes in animal behavior, their excretion patterns and quantity, and whether or not they have outdoor access. For instance, fattening pigs and poultry will excrete more total ammonia nitrogen (TAN) each day as they grow, yielding ever higher potential for NH3 emissions. These two kinds of temporal dynamics (daily and production period) must be considered when measuring gas emissions.
Information concerning the production conditions (number of animals, feed and water consumption, animal mortality) and outdoor climate are also required for validation of measurements and comparison with emissions data already published. All operations made by the farmers or operators (for instance, feeding changes, litter supply, or cooling system implementation) and specific events (for instance, electric power shutdown) during the measurement period should be noted because they will be helpful for data analysis and interpretation.
Validation of Measurements
In order to achieve good quality measurements, data validation steps are necessary at several levels:
- • Validation measurements for parts or the whole measuring setup should be carried out in advance, especially if the setup, single components, and/or the measurement objective (e.g., housing system) was not measured in this configuration before.
- • Calibration of analytical devices and sensors has to be performed according to their specifications. For some analytical instruments, measurements with a reference method (e.g., acid traps for NH3) are recommended.
- • Frequent checks of operational mode and measurement values as well as housing and management conditions are necessary.
- • Plausibility checks of raw data and emission values (e.g., comparison of courses of gas concentrations and wind speed, data check in view of a predetermined plausible range based upon user scientific and technological knowledge) help to find outliers, non-logical values, etc. These incorrect values have to be eliminated according to predefined criteria.
- • Redundancy in measurements can enhance the reliability of the values. For instance, CO2 concentrations could be measured with both a gas chromatograph and an optical gas analyzer during startup or periodically over the project.
- • Comparison of the cumulative emissions for N and carbon (C) with N and C mass balance deficits over the measuring period.
Examples
Example \(\PageIndex{1}\)
Example 1: Calculate ammonia (NH3) emission rate from a mechanically ventilated pig house using the carbon dioxide mass balance approach
Problem:
The following case study is based on a project undertaken on behalf of the Irish Environmental Protection Agency to test the suitability of existing NH3 emission factors currently being used for different pig life stages and to explore the potential impact on Natura 2000 sites (i.e., Special Areas of Conservation and Special Protection Areas that may be sensitive to N). The monitoring equipment is described in detail by Kelleghan et al. (2016).
The house used mechanical ventilation, with air inlets along the side of the house and ceiling exhaust fans, but no access to the exhaust stream for direct measurement of ventilation rate. Gas concentrations were measured at 10 a.m. in a house with 406 fattening pigs of 81.25 kg animal−1 reared on a fully slatted floor. Indoor NH3 concentrations in the house were measured using a Los Gatos Research ultraportable ammonia analyzer (UAA) in combination with an eight-inlet multiport unit allowing for multiple sampling points. Outdoor concentrations were not measured; for the purposes of this study and the calculations, they were assumed to be zero. Indoor and outdoor CO2 was measured in the sample gas drawn by the UAA using a K30 CO2 sensor (Senseair, Sweden). Measured gas concentrations are presented in Table 4.5.1. Additional parameters adapted for finishing pigs are included in Table 4.5.2. Calculate the building ventilation rate and the NH3 emission rate.
Solution
Calculate the building ventilation rate using the CO2 mass balance approach expressed by Equation 4.5.6:
| Measured | |
|---|---|
|
CO2,indoors |
915 ppm (mL m−3) |
|
CO2,outdoors |
403 ppm (mL m−3) |
|
NH3,indoors |
3.73 (mg m3) |
|
NH3,outdoors |
0 (mg m3) |
\( VR=\frac{\text{total heat per house} \times \text{ventilation flow per hpu}}{1000} \) (Equation \(\PageIndex{6}\))
To calculate the total heat per house, first, calculate the relative animal activity with Equation 4.5.10 using the given values:
| Parameter | Value for This Experiment |
|---|---|
|
a (Equation 4.5.11) |
0.53 |
|
hmin (Equation 4.5.11) |
1:40 AM = 1.7 in equation |
|
n (Equation 4.5.9) |
3.38 (g day−1) |
|
c (Equation 4.5.10) |
m3 h−1 hpu−1 |
\( \text{Relative animal activity} = 1-a\ sin[(\frac{2\pi}{24})\times(h+6-h_{min})] \) (Equation \(\PageIndex{10}\))
\( \text{Relative animal activity} = 1-0.53\times sin[(\frac{2\pi}{24})\times(10+6-1.7)] = 1.2994 \)
Next, calculate the total heat production per animal with Equation 4.5.8:
\( \text{Total heat per animal} = 5.09 \times m^{0.75} + [1-(0.47+0.003\times m)]\times [(n \times 5.09\times m^{0.75})-(5.09\times m^{0.75})] \) (Equation \(\PageIndex{8}\))
\( \text{Total heat per animal} = 5.09 \times 81.25^{0.75} + [1-(0.47+0.003\times 81.25)]\times [(0.00338 \times 5.09\times 81.25^{0.75})-(5.09\times 81.25^{0.75})] = 231.6\ W \text{ animal}^{-1} \)
Thus, with 406 pigs, the total heat production for the house is:
\( 406 \times 231.6 = 94026.5\ W \)
Next, calculate ventilation flow per heat producing unit (hpu) with Equation 4.5.9:
\( \text{Ventilation flow per hpu} = \frac{c \times (\text{relative animal activity})}{CO_{2,indoors}-CO_{2,outdoors} \times 10^{-6}} \) (Equation \(\PageIndex{9}\))
\( \text{Ventilation flow per hpu} = \frac{0.185 \times (1.2994)}{(915-403) \times 10^{-6}} = 469.5 \)
Ventilation flow per hpu will equal 469.5 m3 h−1 hpu−1.
Finally, substitute the computed values into Equation 4.5.6 to calculate the building ventilation rate:
\( VR = \frac{\text{total heat per house} \times \text{ventilation flow per hpu}}{1000} \) (Equation \(\PageIndex{6}\))
\( VR = \frac{94026.5 \times 469.5}{1000} = 44,145.2 \)
The building ventilation rate is 44145.2 m3 h−1.
To calculate NH3 emission rate, note that the NH3 emission rate for the house is proportional to the difference between indoor and outdoor NH3 concentrations multiplied by the ventilation rate:
\( \frac{(3.73-0)\times 44,145.2}{3600} = 45.7 \)
The NH3 emission rate for this example is 45.7 mL s−1. This equates to 9.7 g day−1 animal−1.
Example \(\PageIndex{2}\)
Example 2: Calculate methane (CH4) emissions from a naturally ventilated dairy cattle house using tracer gas (SF6) measurement data
Problem:
This example is based on investigations carried out in experimental dairy housing for emission measurements (Mohn et al., 2018). The housing consists of two experimental compartments, each for 20 dairy cows, and a central section for milking, technical installations, an office, and analytics. The experimental compartments are naturally ventilated without thermal insulation and with flexible curtains as facades.
The diluted tracer gas, SF6, was dosed continuously through steel tubes with critical capillaries (every third meter) next to the aisles to mimic the emission sources. Stainless steel tubes and critical orifices were protected with metal profiles from damage by animals and contamination with excrement. To adjust analyzed tracer gas concentration in an optimal range (> 0.05 μg m−3, < 1.5 μg m−3SF6), tracer gas flow was set according to meteorological and ventilation conditions (e.g., curtains open/closed) by mass flow controllers. Integrative air samples at a height of 2.5 m with a piping system consisting of Teflon tubes and critical glass orifices (every second meter) allow a representative sample. Teflon filters protected the critical orifices from dust and insects. Flow rates for individual orifices of the dosing and sampling systems were monitored before and after every measuring period using mass flow meters. The analytical instrumentation for CH4 (cavity ring-down spectrometer, CRDS, Picarro Inc., Santa Clara, CA, USA) and SF6 analysis (GC-ECD, Agilent, Santa Clara, CA, USA) was located in an air-conditioned trailer in the central section. The two compartments were sampled alternately for 10 min. each. Further, once per hour, the background (approximately 25 m from housing, unaffected by the housing) was sampled, so at least two 10-min samples per compartment were obtained every hour.
To describe the measurement situation, relevant accompanying parameters such as housing and outdoor climate, animal parameters (e.g., live weight, milk yield, milk composition, milk urea content, urine urea content), and feed (quality and quantity, amount of trough residue) were recorded.
Calculate the CH4 emissions during one 10-min measurement taken on 23 September at 12:40 p.m. in a compartment with perforated floors holding 20 cows. The measured gas concentrations are presented in Table 4.5.3.
Solution
Calculate the background correction (Cx) according to Equation 4.5.3 using measured concentrations of SF6 \((C_{SF6})\) and CH4 \((C_{CH4})\):
| Parameter | Value |
|---|---|
|
SF6 mass flow |
2.879 g d−1 |
|
SF6 background |
0.052 μg m−3 |
|
SF6 housing, sampling points |
1.820 μg m−3 |
|
CH4 background |
1384.2 μg m−3 |
|
CH4 housing, sampling points |
9118.6 μg m−3 |
\( C_{x}=C_{x,sp}-C_{x,bgd} \) (Equation \(\PageIndex{3}\))
\( C_{CH4}=9118.6-1384.2=7734.4\ \mu g \ m^{-3} \)
\( C_{SF6}=1.820-0.052=1.768\ \mu g \ m^{-3} \)
Calculate emission or mass flow calculation of CH4 using Equation 4.5.5:
\( \dot{m}_{G} = \frac{\dot{m}_{T} \times C_{G}}{C_{T}} \) (Equation \(\PageIndex{5}\))
\( \dot{m}_{CH4} = \frac{2.879\ g \ d^{-1} \times 7734.4\ \mu g\ m^{-3}}{1.768\ \mu g\ m^{-3}} = 12,597.9\ g\ d^{-1} \)
ER per cow (20 cows per compartment): 629.7 g d−1
Image Credits
Figure 1. Department for Environment Food & Rural Affairs. (CC By 4.0). (2018). Environmental impacts of ammonia emissions. Retrieved from https://www.gov.uk/government/publications/code-of-good-agricultural-practice-for-reducing-ammonia-emissions/code-of-good-agricultural-practice-cogap-for-reducing-ammonia-emissions
Figure 2. Calvet, S. (CC By 4.0). (2014). Process leading to ammonia emission and contributing factors. Adapted from Snoek et al.
Figure 3. Calvet, S. (CC By 4.0). (2001). Reactions leading to N2O emissions: nitrification (in green) and denitrification (in blue). Adapted from Wrage et al.
Figure 4. Calvet, S. (CC By 4.0). (2020). Process and microorganisms involved in methane formation.
Figure 5. Calvet, S. (CC By 4.0). (2020). Direct emission measurement in an animal house. The difference in concentration between indoors and outdoors and the ventilation rate must be measured (adapted from Calvet et al., 2013).
Figure 6. Hassouna, M. (CC By 4.0). (2020). Acid trap configuration.
Figure 7. Hassouna, M. (CC By 4.0). (2020). Duct for dispersing a tracer gas within an animal house.
Figure 8. Agroscope, Schrade, S. (CC By 4.0). (2020). (a) Tracer-gas dosing by steel tubes with critical orifices protected by steel elements next to the floors in a dairy housing; (b) gas bottles with mass-flow controller. Photos adapted from Agroscope. [Fair Use].
Figure 9. Agroscope, Schrade, S. (CC By 4.0). (2020). Principle of the tracer gas method.
Figure 10. Gates, R. (CC By 4.0). (2020). Fan Assessment Numeration System (FANS) developed by Gates et al. (2005) to describe the performance curve of a ventilation fan in an animal house. Note the unit can be used on either the inlet or exhaust side of the ventilation fan.
Figure 11. Hassouna, M. (CC By 4.0). (2016). The mass balance approach in animal houses.
Figure 12. Right. Agroscope, Schrade, S. (CC By 4.0). (2020). Sensors must be installed beyond the reach of animals.
Figure 12 Left. Hassouna, M. (CC By 4.0). (2020). Sensors must be installed beyond the reach of animals.
Figure 13. Hassouna, M. (CC By 4.0). (2020). Clogging of a sampling tube and its dust filter after three months of measurement in a dairy cattle house.
References
Blanes, V., & Pedersen, S. (2005). Ventilation flow in pig houses measured and calculated by carbon dioxide, moisture and heat balance equations. Biosyst. Eng., 92(4), 483-493. https://doi.org/10.1016/j.biosystemseng.2005.09.002.
Calvet, S., Gates, R. S., Zhang, G., Estelles, F., Ogink, N. W. M., Pedersen, S., & Berckmans, D. (2013). Measuring gas emissions from livestock buildings: A review on uncertainty analysis and error sources. Biosyst. Eng., 116(3), 221-231. https://doi.org/10.1016/j.biosystemseng.2012.11.004.
Estelles, F., Fernandez, N., Torres, A. G., & Calvet, S. (2011). Use of CO2 balances to determine ventilation rates in a fattening rabbit house. Spanish J. Agric. Res., 9(3), 8. doi.org/10.5424/sjar/20110903-368-10.
Gates, R. S., Casey, K. D., Xin, H., Wheeler, E. F., & Simmons, J. D. (2004). Fan assessment numeration system (FANS) design and calibration specifications. Trans. ASAE, 47(5), 1709-1715. https://doi.org/10.13031/2013.17613.
Gates, R. S., Xin, H., Casey, K. D., Liang, Y., & Wheeler, E. F. (2005). Method for measuring ammonia emissions from poultry houses. J. Appl. Poultry Res., 14(3), 622-634. https://doi.org/10.1093/japr/14.3.622.
Hassouna, M., Eglin, T., Cellier, P., Colomb, V., Cohan, J.-P., Decuq, C., . . . Ponchant, P. (2016). Measuring emissions from livestock farming: Greenhouse gases, ammonia and nitrogen oxides. France: INRA-ADEME.
ISO 3966. (2008). Measurement of fluid flow in closed conduits. Velocity area method for regular flows using Pitot static tubes.
Kelleghan, D. B., Hayes, E. T., & Curran, T. P. (2016). Profile of ammonia and water vapor in an Irish broiler production house. ASABE Paper No. 162461252. St. Joseph, MI: ASABE. https://doi.org/10.13031/aim.20162461252.
Mohn, J., Zeyer, K., Keck, M., Keller, M., Zahner, M., Poteko, J., . . . Schrade, S. (2018). A dual tracer ratio method for comparative emission measurements in an experimental dairy housing. Atmospheric Environ., 179, 12-22. https://doi.org/10.1016/j.atmosenv.2018.01.057.
Morello, G. M., Overhults, D. G., Day, G. B., Gates, R. S., Lopes, I. M., & Earnest Jr., J. (2014). Using the fan assessment numeration system (FANS) in situ: A procedure for minimizing errors during fan tests. Trans. ASABE, 57(1), 199-209. https://doi.org/10.13031/trans.57.10190.
Ogink, N. W. M., Mosquera, J., Calvet, S., & Zhang, G. (2013). Methods for measuring gas emissions from naturally ventilated livestock buildings: Developments over the last decade and perspectives for improvement. Biosyst. Eng., 116(3), 297-308. https://doi.org/10.1016/j.biosystemseng.2012.10.005.
Pedersen, S., & Sallvik, K. (2002). 4th Report of working group on climatization of animal houses. Heat and moisture production at animal and house levels. Research Centre Bygholm, Danish Institute of Agricultural Sciences.
Pedersen, S., Blanes-Vidal, V., Jorgensen, H., Chwalibog, A., Haeussermann, A., Heetkamp, M. J., & Aarnink, A. J. (2008). Carbon dioxide production in animal houses: A literature review. Agric. Eng. Int.: CIGR J.
Phillips, V. R., Lee, D. S., Scholtens, R., Garland, J. A., & Sneath, R. W. (2001). A review of methods for measuring emission rates of ammonia from livestock buildings and slurry or manure stores, Part 2: Monitoring flux rates, concentrations and airflow rates. J. Agric. Eng. Res., 78(1), 1-14. https://doi.org/10.1006/jaer.2000.0618.
Powers, W., & Capelari, M. (2016). Analytical methods for quantifying greenhouse gas flux in animal production systems. J. Animal Sci., 94(8), 3139-3146. https://doi.org/10.2527/jas.2015-0017.
RAMIRAN. (2011). Glossary of terms on livestock and manure management. Retrieved from http://ramiran.uvlf.sk/doc11/RAMIRAN%20Glossary_2011.pdf.
Samer, M., Ammon, C., Loebsin, C., Fiedler, M., Berg, W., Sanftleben, P., & Brunsch, R. (2012). Moisture balance and tracer gas technique for ventilation rates measurement and greenhouse gases and ammonia emissions quantification in naturally ventilated buildings. Building Environ., 50, 10-20. https://doi.org/10.1016/j.buildenv.2011.10.008.
Sherman, M. H. (1990). Tracer-gas techniques for measuring ventilation in a single zone. Building Environ., 25(4), 365-374. https://doi.org/10.1016/0360-1323(90)90010-O.
Snoek, D. J. W., Stigter, J. D., Ogink, N. W. M., & Groot Koerkamp, P. W. G. (2014). Sensitivity analysis of mechanistic models for estimating ammonia emission from dairy cow urine puddles. Biosyst. Eng., 121, 12-24. https://doi.org/10.1016/j.biosystemseng.2014.02.003.
Wang, X., Ndegwa, P. M., Joo, H., Neerackal, G. M., Stockle, C. O., Liu, H., & Harrison, J. H. (2016). Indirect method versus direct method for measuring ventilation rates in naturally ventilated dairy houses. Biosyst. Eng., 144, 13-25. https://doi.org/10.1016/j.biosystemseng.2016.01.010.
Wrage, N., Velthof, G. L., van Beusichem, M. L., & Oenema, O. (2001). Role of nitrifier denitrification in the production of nitrous oxide. Soil Biol. Biochem., 33(12), 1723-1732. https://doi.org/10.1016/S0038-0717(01)00096-7.