
6.5: Packaging
- Page ID
- 46861

Scott A. Morris
Departments of Agricultural & Biological Engineering and Food Science & Human Nutrition
University of Illinois at Urbana-Champaign
Champaign, Illinois, USA
| Key Terms |
| Product protection | Permeation | Packaging cycle |
| Packaging design | Shelf life | Information cycle |
| Packaging materials | Packaging damage |
Variables
Introduction
Packaging is an engineering specialization that involves a systems-oriented means of preparing and distributing goods of all types. Packaging is responsible for several fundamental functions as well as having broad reach and wide impact beyond the consumer’s immediate purchase. It is a much more complex system than most consumers (and many producers) realize and requires skills drawn from all facets of engineering. For that reason, integration of concepts is absolutely essential, and this chapter is best understood by considering the systems-cycle concepts laid out in the Applications section first, before pursuing isolated topics or calculations.
Packaging makes it possible to have a broad distribution of perishable items such as food and medicine. By considering the complete cycle of usage, conditions, handling, storage, and disposal, appropriate packaging can be designed for nearly any application, market, and regulatory structure. Thus, it is important for packaging to be included as early as possible in the product development cycle so that the proper packaging can be created and tested in time to meet production deadlines, and to highlight problems in the product that might make it susceptible to shipping damage or other harm.
Outcomes
After reading this chapter, you should be able to:
- • Describe the large-scale packaging system, both physical and informational, beyond development of a simple container
- • Apply basic materials data to calculate simple permeation (mass-transfer) problems for polymeric packaging applications
- • Estimate shelf life of products and recognize some of the problems of relying solely on data-projection based estimation
- • Describe how packaging designs and solutions vary depending on economics, available resources, and infrastructure, and how mimicking a solution from one market may be unproductive in another due to material availability or differing cost structure, particularly in different geographical regions
Concepts
Package Types
There are three package types: primary, secondary, and tertiary. The primary package material directly contacts the product, such as the plastic bottle containing water or a bag holding potato chips. For food, pharmaceuticals, cosmetics, and similar types of products, regulations require that the packaging material not transfer harmful material into the product (and the term primary package is usually used in relevant legislation) (Misko, 2019; USFDA, 2019). Current debates over bis-phenol A (BPA) content in packaging (for example, water bottles), and its health effects when consumed, is an example of this kind of material transfer that may cause material components to be banned in certain products or markets.
The secondary package usually surrounds the primary package. A box of cereal is a good example, with the product contained in the interior pouch (the primary package) and the exterior printed carton acting as the secondary package. The secondary package may act as advertising space on a store shelf, or to give a good first impression in e-commerce, and also carries information for point of sale (POS) operations.
Most often, the tertiary package is the shipping carton, carrier, or tray that carries unitized packages, i.e., packages that have been collected into groups for shipping, through the distribution system. In many cases, it is a corrugated shipping container, but for very strong types of packages such as glass jars and metal cans, it may be a simple overwrapped tray. This package must usually carry shipping information, and must frequently comply with relevant shipping regulations, rules, tariffs, and labeling requirements.
Material Types
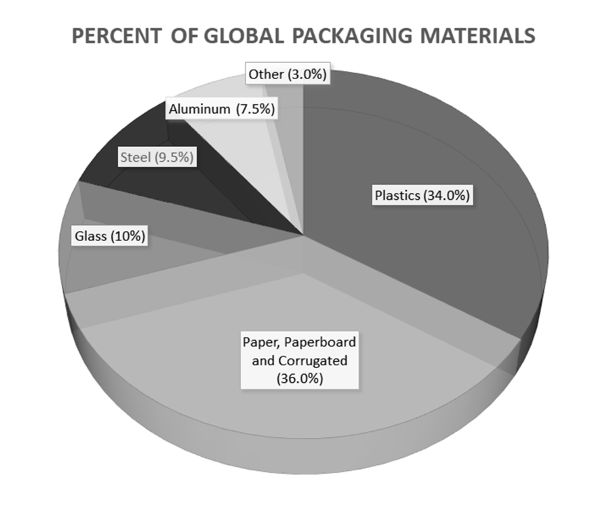
Packaging is often described in terms of primary materials that make up the body or structure of the package. The most common primary packaging materials are plastics, metals (steel and aluminum), glass, and paper. Global use of material types is shown in Figure 6.5.1. Other materials include traditional low-use materials such as structural wood in crates, as well as printing inks, adhesives, and other secondary materials. Secondary materials and components of the package are usually added to the primary structure and are often used for assembly, such as adhesives or a “closure”—the cap or lid on a container. Other components, such as inks used for printing, spray pumps, and other secondary features, may be included in the latter group.
Plastics
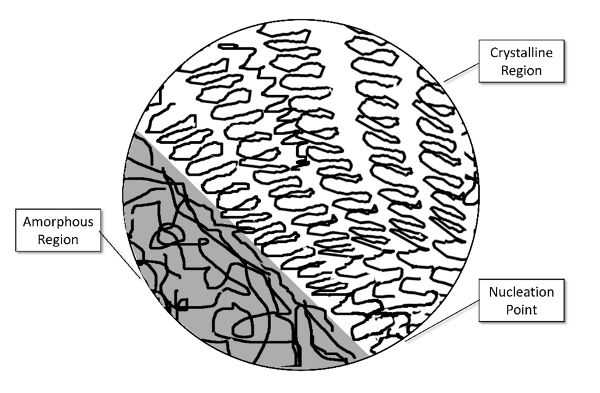
Plastics are most often created by the polymerization of petrochemical hydrocarbons, though there is substantial effort to create useful versions from naturally occurring carbohydrates, particularly from plant and algal sources as well as genetically engineered bacterial cultures. These polymers typically contain long carbon “backbone” chains of considerable length, and may or may not have bonds forming cross-links between the chains. A rule of thumb is that more cross-linking will create a stiffer, more brittle material. Additionally, plastics exhibit “crystallinity,” which does not necessarily follow the strict definition of a crystal in the typical sense of a completely bound structure and very sharp melting point, but does exhibit a high degree of ordering: backbone chains arranged in regular patterns, usually emanating from a central nucleation site (Figure 6.5.2). Polymers that have a low degree of ordering in their chain orientation are typically termed “amorphous,” much like a bowl of cooked noodles. Additionally, melting would occur at a narrow range of temperatures depending on factors such as molecular weight distribution and additives rather than the broader, less well-defined softening and liquification range that an amorphous phase would exhibit.
For a given chain length, an ordered, crystalline polymer will have higher density, be more resistant to absorbing or permeating materials through the structure, and may be more brittle than amorphous materials, which will be tougher, more flexible, and more likely to absorb or transmit material through the molecular structure. For example, polyethylene is suitable for forming simple flexible structures such as milk cartons, but does not resist stress cracking while flexing, so polypropylene is used for “living hinge” structures that are often seen as flip caps on containers.
Polymers may also have their structure altered by post-processing the sheet, film, or structure in a process called “orienting.” This involves mechanically deforming the material so that the chains are pulled into alignment, creating a higher degree of crystallinity and better mechanical strength and barrier properties. This orientation may affect the density as well, since it will create order in the backbone chain. The relationship of chain length/molecular weight and crystallinity is illustrated in Figure 6.5.3 (Morris, 2011).
For example, a polyethylene terephthalate (PET) soda bottle is first created as a molded “preform,” roughly resembling a test-tube, with the threaded “finish” that the lid is attached to already formed. In the bottling plant, the preforms are heated to a very specific temperature and then rapidly inflated with compressed air inside a shaped mold. This “stretch-blow” process aligns the molecular structure of the body into a tight, two-way basket weave of polymer chains that is capable of resisting the tendency of the carbon dioxide (CO2) to dissolve into the polymer and escape through the structure.

If a type of polymer is too brittle to be used properly in its intended function, it may also be modified by the addition of plasticizers that act as lubricants or spacers in the internal molecular structure and make the structure more ductile. This might be done for a squeeze dispenser or a structure that is too brittle at low temperatures.
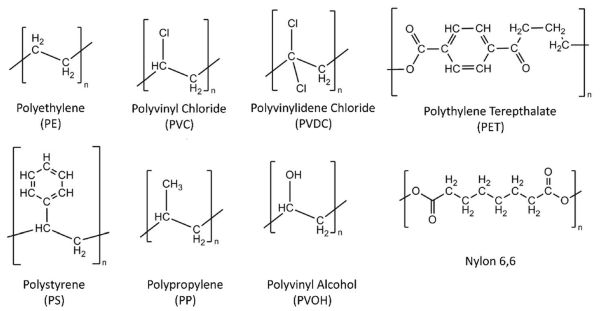
Side groups bonded to the main carbon-carbon “backbone” chain usually define plastics that are commonly used in packaging. Since writing the entire structure of hundreds of thousands of units would be impractical, the structure is often represented by the repeat units that comprise the polymer backbone chain (Figure 6.5.4). Several of these polymers may exhibit branching of the structures from the central backbone, but again, these are also composed of repeat units. For example, polyethylene has a simple side-structure of two hydrogen atoms, while polystyrene has a cyclic phenyl structure. The interaction of these rings with one another as long chains are produced results in the stiff, brittle behavior of unplasticized polystyrene.
Steel
Steel is used almost exclusively as cans for food, as well as larger drums for many types of products. When used as a food container for thermally processed foods, steel cans have an internal lining to reduce corrosion and reduce interaction with the product. Typically, the coating is of tin, which creates an anodic protection layer in the absence of oxygen, is non-toxic, and does not affect the flavor or texture of most products. There is usually an additional supplementary coating of some type of lacquer or synthetic polymer. Cans are formed either as two-piece or three-piece structures. The bottom and body of two-piece cans are formed from a single piece of material by progressive forcing through dies, with a seamed-on lid. The body of three-piece cans, which are increasingly uncommon since they are more costly to produce, is formed from a single piece of tinned sheet with a welded side-seam, a seamed-on bottom, and the lid seamed on after filling, as with the two-piece can. Steel cans have the advantage of resisting substantial loads both from stacking of many layers during storage and from the internal vacuum that is formed from condensing steam during the filling and lidding process that eliminates deteriorative oxygen in the headspace of the container.
Aluminum
Aluminum containers are used almost exclusively with beverages, since aluminum is quite ductile and relies on pressurization, either from the carbonation of a beverage or from the addition of a small quantity of pressurizing gas (typically nitrogen), to achieve sufficient strength. Aluminum cans are formed as two-piece cans and the interior of the can is coated with a sprayed-on resin to resist corrosion by the contents. For highly acidic products such as cola drinks, this critical step prevents the cans from corroding in a matter of days. The lid for aluminum cans has evolved as a masterpiece of production engineering since it attaches the tab with a formed “rivet” from a protrusion of the lid material rather than a third piece that would add prohibitive cost, and has a scored opening that reliably resists pressure until opened by the consumer.
Aluminum has two other substantial uses in packaging: foils and coatings. Since metal is inherently a very good barrier against gasses, light, and water, flexible foil layers are included in many types of paper/plastic laminates to provide protection for products. Similarly, an evaporated coating of aluminum is a common feature with flexible films, particularly with snack foods whose oily composition is susceptible to light, oxygen, and moisture.
Glass
Glass is formed by the fusion of sand, minerals, and recycled glass at temperatures above 1500°C. Forming a thick liquid, it is then dispensed in “gobs” that are carried to a mold that forms a preliminary structure called a “parison,” then on to a final mold where the parison is inflated with air and takes its final form while still quite hot. Since glass has the combination of poor heat conduction and brittleness, the formed containers must then be cooled slowly in an annealing process, usually done in a slow conveyor-feed structure called a “lehr” that contains progressively lower temperature zones. This allows the molded container to cool slowly over a long period and prevents failure from residual thermal stress.
Once formed, glass containers are quite strong, although susceptible to brittle failure, particularly as the result of stress concentration in scratches or abrasion. For this reason, the containers have thicker areas called “shock bands” molded in and also are coated to reduce contact damage. Many glass-packaged products, particularly beverages, are shipped with an internal divider of inexpensive paperboard to separate the containers and prevent scratching. Glass is otherwise strong enough that it is often shipped with a simple tray and overwrap to unitize the containers until they are shelved at retail.
Glass is being replaced with plastic in many applications for several reasons, primarily fragility and weight. Since ingested glass shards represent an enormous hazard to the consumer, breakage during filling and handling operations requires stopping production and thorough cleaning for every occurrence and discarding nearby product whether contaminated or not (American Peanut Council, 2009). Additionally, weight savings can be significant: one peanut butter filling operation saved 84% of package weight by replacing glass containers with plastic containers (Palmer, 2014). Generally, the substitution of plastic for glass has resulted in both cost and liability reduction, although for products intended for thermal processing after filling, the designs can demand precise control of material properties and forming (Silvers et al., 2012).
Paper, Paperboard, and Corrugated Fiberboard
Paper materials are created from natural fibers, primarily from trees and recycled content. Other sources, such as rice straw, hemp, and bamboo, may be used. There is directionality in paper’s preference for tearing, bending, and warping since the fibers will preferentially separate rather than break, causing paper to tear preferentially along the direction that the forming machine laid the fiber slurry (termed the “machine direction”). Since paper is a natural, fibrous material, there will be changes in the strength of the material because of moisture content. Since fibers typically swell in diameter (at right angles to the machine direction, termed the “cross machine direction”) without significantly changing length, surface exposure to water or steam may cause the paper to curl around the machine direction axis.
While paper fibers can be processed in many ways, the basic approach is to separate the fibers into a slurry, then reform the slurry into long sheets (called “web”) in one of two ways. The earliest process, the Fourdrinier process (named for the Fourdrinier brothers who developed it) mimics early hand-laid paper in that it pours the fiber slurry through a continuous wire-mesh belt (the “wire”). As the water drains, the web is eventually peeled from the wire, and put through rollers in several finishing and drying steps. This process is limited by drainage in its ability to create thick materials and only a few layers are possible.
A later development, the cylinder process, uses rotating cylinders to adhere fibers from the slurry to a continuous moving belt of absorbent material from underneath, circumventing the previous drainage limitation. This has the advantage of being able to form many layers for thick-section papers and paperboard. Paperboard, i.e., paper that is thicker than approximately 0.3 mm, is usually die-cut into cartons, dividers, or other more rigid structures. Paperboard is used in all types of consumer packaging from hanging cards to cartons, while paper is typically used in pouch structures and bags to add strength and good printing surfaces.
Corrugated fiberboard (colloquially called “cardboard”) is a manufactured product that assembles paper into a rigid structural sheet, usually consisting of two outer “linerboard” layers and a crenulated internal “corrugating medium” layer. The linerboard may be pre-printed to match the product; this can allow much more sophisticated graphics to be used compared to printing after manufacture, which is limited by the irregular surface of the material. The medium is continuously formed using steam and a shaped roller and adhered between the linerboard sheets using starch-based glue. The sheets of corrugated board are then usually die cut into the necessary shapes for forming boxes, shipping containers, and other structures. Multiple layers are possible and are used for specialized applications such as household appliance shipping containers.
Product Protection
Packaging serves several functions. Protection of the product is of primary importance, particularly with products such as food. Fresh foods often require vastly different types of protection than processed and shelf stable foods that are meant to be stored for much longer periods of time. Proper packaging protects products from physical damage and reduces costs due to waste. Additional functions of packaging include utilization, communication, and integration with ordering, manufacturing, transportation, distribution, and retail systems as well as return logistics networks.
Definition of Food Damage or Quality Loss
Defining damage, spoilage, or unsuitability of food can be very difficult. While microbial contamination levels can be quantified, the effects of texture or color changes are often subtle and subjective. Far too often, a food product is considered spoiled based on a qualitative measure that is entirely subjective and may be motivated by other factors. It is important that the definition of unacceptable product be carefully considered (and perhaps contractually defined) to avoid subsequent conflict. Ingredients, components, and materials supplied to other manufacturing operations should always have quality criteria carefully and quantitatively defined to avoid arguments that may be motivated by an attempt at renegotiation of price or other commercial considerations (Bodenheimer, 2014; Pennella, 2006).
Since defining food product failure may be a difficult task, it can be useful to focus on the most easily degraded or damaged component that will cause the product to become unsafe or unacceptable if it fails—the critical element (Morris, 2011). This critical element may be defined as an easily degraded ingredient, a significant color change, mechanical failure, or an organoleptic quality (usually defined by a taste, texture, or odor, most often identified by human evaluators in a blind test) that fails an objective criterion for failure. The critical element to be used in a sampling plan must meet two criteria: its state must be determinable by objective analysis, and its failure conditions must be defined by objective criteria rather than subjective anecdote.
This approach can have several shortcomings. It is easy to focus on a particular aspect of quality to the more general detriment of the product, and it is tempting to choose the quality element because of its ease of assay rather than its impact or importance. Finally, this may be a moving target, as the critical element may become some other factor as circumstances change.
Transportation and Storage Damage
Damage resulting from static and dynamic effects during manufacture, storage, handling, and distribution may range from simple compression failure of a container to complex resonance effects in a vehicle-load of mixed product. An understanding of storage conditions and the transportation environment can help in the design of an efficient package capable of surviving distribution without over-packaging.
Light and Heat Damage
Damage to a food product may occur because of exposure to light or to temperature extremes, both high and low. Ultraviolet light may cause fading of the external printed copy and an unappealing appearance, but by itself does not penetrate into a transparent package. Certain products, however, are extremely sensitive to visible light. Skim milk exhibits a marked decrease in Vitamin A with exposure to fluorescent lights common in retail environments and beer’s isohumulone flavoring will degrade into the compound 3-MBT (3-methyl-2-butene-1-thiol) causing a sulfurous “skunked” or “lightstruck” flavor to develop (deMan, 1981; Burns et al., 2001).
Thermal or heat damage may result from the long-term effects of both very high and very low temperature exposure, though low temperature exposure of a fragile product is more associated with the breakdown of texture and structure, usually from ice crystal growth or emulsion failure, than chemical changes. High temperatures will accelerate any thermally dependent degradation processes and may cause other problems, such as unexpectedly high permeation rates in packaging materials, because of transition from a glass to an amorphous state in polymers.
Gas and Vapor Transmission Damage
Gas and vapor transmission problems are very product-specific and may be situational. A carbonated drink may suffer from loss of carbonation, while another product may oxidize badly because of oxygen transmitted through the package. A confectionary product may have rapid flavor change because of loss of volatile flavor components that self-plasticize the packaging material. Volatile organic chemicals (VOCs) ranging from diesel fumes to flavor components may be transferred in or out through the package. Water vapor gain may cause spoilage of food or degradation of pharmaceuticals, while water vapor loss may cause staling of bread products. A good understanding of both the product properties and of the environment that it will face in distribution are important for proper design (Zweep, 2018).
Permeation in Permeable Polymeric Packaging Material
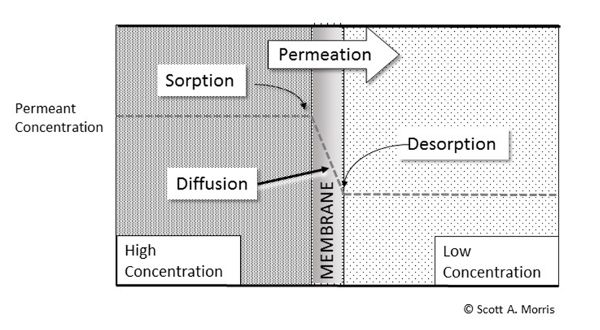
Permeation is the ability of one material (the permeant) to move through the structure of another. Many amorphous materials such as natural and artificial polymers are permeable because of substantial space between their molecular chains. Figure 6.5.5 shows this in schematic form, with permeation of vapor progressing from the high-concentration side to the low-concentration side via sorption into the high-concentration side, diffusion through the bulk matrix of the film membrane, and then desorption on the low-concentration side, all driven by the concentration differential across the material. Glass and metal packaging, on the other hand, are impermeable to everything except hydrogen because of their ordered structure or dense packing. Polymers in a highly ordered state also exhibit very low permeability relative to disordered structures.
The rate of permeation depends on the species of permeant, the type and state of the polymer, and any secondary factors such as coatings. The polymer may be glassy—essentially a low-order crystalline state (a good example of this is a brittle polystyrene drink cup)—or rubbery, which allows segmental motion of the polymer chains. With most polymers, this will have a measurable shift at a particular temperature, the glass transition temperature, with elasticity and permeation increasing when the polymer is above the glass transition temperature of the polymer.
Permeability can be modeled as the concentration-gradient driven process (mass transfer process) of dissolving into the high-concentration surface, diffusing through the film membrane matrix materials, and then desorbing from the low-concentration surface, much in the same way that heat is transmitted by conduction through the thickness of a wall (Suloff, 2002).
Mass-transfer equations can be constructed to create a simple model of the diffusive flux of the permeant (gas) based on the linear Fickian diffusion model (Equation 6.5.1) (Fick, 1855). For movement of a permeant through a layer of material per surface area:
\[ (\frac{\text{Quantity permeated per unit of time}}{\text{Area}}) = J =-D\frac{\delta c}{\delta x} \]
where J = diffusive flux (mol m−2 s−1)
D = diffusion coefficient (m2 s−1)
c = concentration (mol m−3)
x = position (m); in Figure 6.5.5, this would be the position within the cross section of the film membrane.
The transmission rate through composite structures, i.e., structures having several layers, can be calculated in a manner similar to thermal systems using Equation 6.5.2:
For n layers of material,
\[ TR_{\text{total}}=\frac{1}{TR_{\text{layer 1}}+TR_{\text{layer 2}}+…+TR_{\text{layer n}}} \]
where TRtotal = total transmission rate (mol s−1)
TRlayer n = transmission rate of layer n
If the permeation of the material is known (or can be estimated), then estimating the permeation of a package design is a function of temperature, surface area, and partial pressure gradient, ∆p. Partial pressure is defined as the pressure that would be exerted by a gas in a mixture if it occupied the same volume as the mix being considered. Usually ∆p is defined by Dalton’s law, i.e., in a mixture of non-reacting gases, the total pressure exerted is equal to the sum of the partial pressures of the individual gases, and, thus, the partial pressure is the product of both the partial pressure of the permeant species and the hydrostatic pressure (Dalton, 1802). Henry’s law, which says that the amount of gas absorbed in a material is proportional to its pressure over the material, and the combination of hydrostatic pressure and permeant species prompts the selective nature of permeation by gasses that have differing partial pressures in a given polymer (Sanchez & Rogers, 1990).
Equations 6.5.1 and 6.5.2 are for idealized circumstances—a constant rate of permeation without chemical reaction between the polymer and the permeant at constant temperature and without physical distortion of the film—and are only valid for diffusion-based permeation. With holes, perforations, voids, or defects, the gas flow is explained by simple fluid-flow models. In real world applications, many conditions, such as temperature changes, fabrication methods, and handling stresses, will compromise this assumption. Diffusion in polymers is an ongoing field of research, and with the great array of volatile compounds in foods, the system may be complicated by several types of deviation from the ideal case. From a practitioner’s standpoint, the permeation data provided by a supplier may be under idealized circumstances or for an initial production run, and will likely not accommodate variations that occur during manufacturing.
Permeability (frequently designated \(\bar{P}\)) has units that have been described as “. . . a nightmare of units” (Cooksey et al., 1999). The SI standard unit for this property of polymeric materials is mol/(m⋅s⋅Pa), though it is used inconsistently, even in academic literature and certainly in commercial data. Rates may be reported in any number of formats and improper mixes of US customary units, SI, cgs, or other measures, in results provided by various tests and manufacturers, so the practitioner will find it necessary to convert units in order to make use of the data. Most of these roughly conform to this format:
\[ \bar{P} = \frac{\text{(quantity of permeating gas)(thickness)}}{\text{(time)(membrane area)(partial pressure difference across membrane)}} \]
Experimental Determination of Permeation Rate
Experimental determination of permeation rates and their derived constants is usually done using a test cell of known surface area with concentrated permeant (e.g., oxygen or CO2) on one side of the package film (generally between 0.06 mm and 0.25 mm in thickness) and inert gas or air on the other side. As permeation progresses, the lag time (the time to achieve a steady rate of permeation) and the rate of concentration increase on the non-permeant side can be measured and used to calculate the solubility and diffusion coefficients (Mangaraj et al., 2015). Typical values of oxygen and water transmission rates and glass transition temperatures are shown in Table 6.5.1.
For moisture permeation tests, a similar arrangement is used, except that a desiccant usually provides the partial pressure differential with a stream of humidified air circulating on the other side of the film membrane. The moisture gained by the desiccant, measured by weight change, is used to calculate the permeation rate (ISO, 2017). Additionally, there are dedicated test devices for oxygen and water permeability that rely on real-time determination of permeation rate using heated zircon and infrared-absorption detectors, respectively.
Permeation Modification in Packaging Films
Using the simple sorption-diffusion-desorption model of permeation shown in Figure 6.5.5, one can find several ways to modify the barrier characteristics of packaging films, either by modifying the surface (sorption/desorption) characteristics or by affecting the diffusion characteristics of the overall film structure. Coatings and surface treatments can be used to modify sorption/desorption characteristics of polymer films. Foremost among these treatments is metallization, which is the evaporation of a thin layer of aluminum in a vacuum chamber. This may be done on either side of the film, but is most often done inside the package to avoid abrasion loss and may be laminated to prevent transfer of aluminum that would discolor the product. There are other surface chemistry modifications, such as fluorination, which, though challenging to implement in production, can convert the surface of simple polyolefins to a polyfluorinated compound with markedly better barrier characteristics. Other surface coatings and laminations are common. Printing, labeling, and other surface decorations may provide a degree of barrier properties over part of the product as well (Nakaya et al., 2015).
| Polymer Type | Oxygen Transmission Rate1 | Water Vapor Transmission Rate2 | Glass Transition Temperature (°C) |
Comments |
|---|---|---|---|---|
|
Polyethylene (PE) |
194 |
18 |
−25 |
Polyethylene properties vary significantly with density, branching, and orientation. |
|
Polyvinyl chloride (PVC) |
5 |
12 |
81 |
Both PVC and PVDC must be food grade (i.e., demonstrating no extractable vinyl chloride monomers) to be used with food products. Concerns over chlorinated films in the popular press reduced their use starting in the early 2000s. |
|
Polyvinylidene chloride (PVDC) |
5 |
30 |
−18 |
|
|
Polyethylene terepthalate (PET) |
5 |
18 |
72 |
PET will reduce its transmission rate drastically when it is oriented during fabrication. |
|
Polystyrene (PS) |
116–155 |
24 |
100 |
Polystyrene is very brittle, and must be plasticized to be useable in most applications. This increases transmission rates significantly. |
|
Polypropylene (PP) |
93 |
4 |
−8 |
Very impact resistant; used for snap caps and other multiple-use applications |
|
Polyvinyl alcohol (PVOH) |
0.8 |
8000+ (see note) |
85 |
Water soluble; polyvinyl alcohol is a high oxygen barrier material, but must be kept dry, typically by layering between moisture barrier layers. Adsorption of moisture destroys barrier characteristics. PVOH film is also used by itself for water-soluble packets of household detergents and other consumer products. |
|
Nylon 6,6 |
1.7 |
135 |
50 |
Hygroscopic; transmission rate varies with moisture content. |
1 In units of \(\frac{cc \cdot \mu m}{m^{2}\cdot 24h\cdot atm}\) tested at STP
2 In units of \(\frac{g \cdot \mu m}{m^{2}\cdot 24h\cdot atm}\) tested at 37°C and 90% relative humidity
For a given polymeric material, modifying the internal structure of the polymer will change the diffusivity coefficient. Intentional modifications typically involve orienting the material by drawing it in one or more directions so that the polymer chains pack into a more orderly, denser structure (National Research Council, 1994). This produces better strength and barrier characteristics such as in the previously described stretch-blow molding of carbonated beverage bottles.
Polymers may also be modified with plasticizers—soluble polymer-chain lubricants—that reduce brittleness but allow chain mobility and create opportunities for permeants to penetrate the structure more readily. Plasticizers that contact food material must be approved for food use since they will likely migrate to the product in microscopic quantities. This has been the subject of several controversies as there is evidence of potential teratogenic (causing birth defects) activity in some plasticizers (EFSA, 2017). Food materials themselves, oils and fats most notably, may be plasticizers and may cause a package’s material to change its barrier or physical characteristics.
Permeation Changes during Storage
Product ingredients or components dissolving into the package structure may result in decreased mechanical strength, reduced barrier properties and shelf life, or even the selective removal of flavor compounds (termed “flavor scalping”). This may create a mysterious reduction of shelf life because of synergistic effects. For example, a citrus flavoring compound rich with limonene may plasticize the packaging material and increase loss of both flavor and water, creating what appears to be a moisture loss problem (Sajilata et al., 2007). Similarly, volatile flavorings can increase oxygen permeation rates with harmful effects for the product, or may increase CO2 loss rates in carbonated beverages.
Other Packaging Damage Occurring During Storage and Distribution
Corrosion of Tin-Plated Steel Cans
The electrochemistry of the tin-plated steel can is complex and depends on several factors in order to maintain the extraordinary shelf life that most consumers expect. Canning operations typically displace headspace air with live steam to both reduce oxygen in the can and provide vacuum once the steam condenses. After lidding, the can end is sealed by crimping the edge in a series of steps to provide a robust hermetic seal, and the environment in the package typically traverses three stages (Mannheim and Passy, 1982; Wu, 2016):
- 1. Initial oxidizing environment—Residual oxygen inside the freshly-sealed can and dissolved into the product is bound up in oxidation products in the product and can material. The tin layer is briefly cathodic, providing a positive charge during this stage and provides little protection until the oxygen is depleted. This typically takes a few days to conclude, depending on the composition of the product and processing conditions.
- 2. Reducing environment—In the absence of free oxygen, the electrochemistry then reverses, and the tin or chromium layer is anodic, slowly dissolving into the canned product to protect the steel of the can wall. This stage may last years, but may be affected by many factors, particularly product composition (e.g., pH level, acidifying agents, salts, and nitrogen sources). Each product must be considered unique, and product reformulation may cause significant changes in can corrosion properties.
- 3. Terminal corrosion—At the end of service life, the environment may still be anaerobic, keeping the electrochemistry anodic, but the protective coating of tin will have been depleted, allowing corrosion and pitting of the can. This can result in staining of the product or can surface, gas formation (hydrogen sulfide, producing so-called “stinkers”) and, finally, pinholing of the can body and loss of hermeticity. Depending on the product, this may take from several months for highly acidic products, like pineapple juice and sauerkraut, to many decades.
Brittle Fracture and Glass Container Failure
Several failure modes are important to understand when working with glass packaging, particularly considering that there may be legal liabilities involved in their failure. Additionally, persistent glass failures in food production facilities can wreak havoc since dangerous glass shards are produced. As a brittle material, glass concentrates stress around thickness changes and scratches, since these provide a location for stress magnification as illustrated in Equation 6.5.4 (Griffith, 1921):
\[ \sigma_{max} = 2\sigma_{app}(\frac{d}{r})^{1/2} \]
where σmax = maximum stress at crack tip (N m−2)
σapp = applied stress (N m−2)
d = depth of crack (m)
r = radius of crack tip (m)
A tiny scratch can create an enormous concentration of stress, and once the critical stress of the material is exceeded, a crack will form that will continue in the material until it fails or until it encounters a feature to re-distribute the stress. Stresses may occur as the result of thermal expansion or contraction since glass is not only brittle, but has poor thermal conductivity, so a section-thickness change may create a steep thermal gradient that causes a container to fail after fabrication or heat treatment. For carbonated beverages, the internal pressure combined with a surface scratch created during manufacture or handling may provide enough pressure and resultant stress in the package material to cause it to burst.
A stress concentration factor (K) can be developed from Equation 6.5.4 as:
\[ K = \frac{\sigma_{max}}{\sigma_{app}} = 2(\frac{d}{r})^{1/2} \]
The stress concentration factor (K) becomes very large with scratches that have a very small crack tip, and even modest depth. The effects of scratches are avoided in design and manufacturing by providing “shock bands,” which are thicker sections of material that are added to contact other bottles in manufacturing and handling, as well as by adding external surface coatings and putting dividers in shipping cartons.
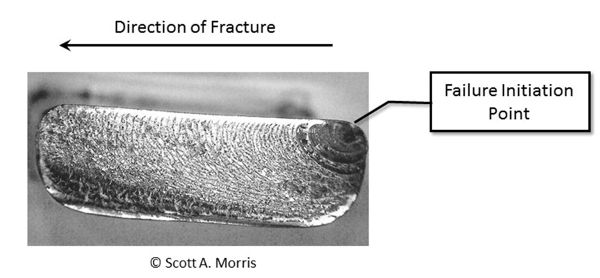
Failure analysis on a broad scale is a specialty unto itself, but when determining the origin of the fracture, there are characteristic features that help identify the point of origin and direction of travel (Figure 6.5.6). The point of origin in both ductile and brittle materials often has a different and distinct texture, usually mirror smooth, and as the failure progresses it will typically leave a distinctive pattern that radiates outward from the point of origin (Bradt, 2011).
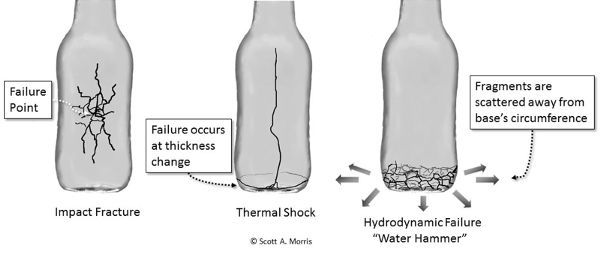
When examining a failed glass container’s reconstructed pieces, it is useful to consider the different failure modes that are common in glass structures. The most common failures are impact and pressure fractures, thermal failure, and hydrodynamic (“water hammer”) failure (Figure 6.5.7). Impact and pressure fractures often originate from a single point in the structure, with the fracture originating on the outer surface from impact, and from the inside from pressure, as determined by observation of magnified fracture edges at the point of initiation.
Thermal failure typically starts at a section thickness change (from thick to thin) as the container is heated or cooled abruptly and a large thermal differential generates shear stress in the material. This manifests itself most often in bottles and jars with a bottom that falls out of the rest of the container at the thickness change, perhaps with other cracks radiating up the sidewall.
Water hammer failure is the result of hydraulic shock waves propagating through the product (usually from an impact that did not break the container directly) and causing localized formation of vapor bubbles that then collapse with enough force to break the container. This usually has the distinctive feature of a shattered ring completely around the container at a particular height (usually near the bottom) with obvious fragmentation outward from the pressure surge. Products with lower vapor pressures, particularly carbonated and alcoholic beverages, will fail with less energy input than liquid or gel products with high vapor pressures (Morris, 2011).
Shelf Life of Food Products and the Role of Packaging
Products have two shelf lives. The first is where the product becomes unusable or unsafe because of deterioration, contamination, or damage. The second shelf life is one of marketability; if the product’s appearance degrades (such as color loss in food that can be seen while still on the shelf), then it will not appeal to consumers and will be difficult or impossible to sell.
The primary concern with packaged processed foods is usually microbial contamination, followed by the previously discussed gain or loss of food components. Since the food is not actively metabolizing, the usual problems apart from microbial growth result from oxidation, gain or loss of moisture or other components, and discoloration from light exposure. While barrier films and packaging can help with some of these problems, it may be useful to include active components such as sachets or other materials or devices that will bind up oxygen or moisture that infiltrates into the package. These are commonly seen on refrigerated-fresh products such as pasta, prepared meats, and others. Other types of active films or structures may incorporate an oxygen-absorbing barrier to extend shelf life. Light barriers may be a tough problem to contend with since many regulations prohibit packaging from hiding the product from view. Processed meat products such as sandwich meat, which is normally a pinkish color from the nitric oxide myoglobin formed during the curing process, will turn brown or grey under prolonged light exposure and will appear to be spoiled. Bacon has a substantial problem with light-promoted fat oxidation and in some countries is allowed to have a flip-up cover over the product window.
Unprocessed foods, such as fresh meat and vegetables, should be regarded as metabolically active. Fresh fruits and vegetables after harvest typically metabolize as they ripen, slowly consuming oxygen and stored carbohydrates and giving off CO2, and may be ripening under the influence of ethylene gas self-production. It is possible to manipulate the oxygen level and strip ethylene from the products’ environment—this is done on a large scale in commercial controlled-atmosphere (CA) storage facilities—but at the individual package level, the cost of specialized wrapping film and an ethylene adsorbent sachet may be prohibitive in markets with ready access to fresh fruits and vegetables. Other markets may find these expensively packaged fruits and vegetables appealing because of the ability to distribute fresh produce at great distance or in regions where it may be difficult to do directly. Since the early 2000s, the use of 1-methylcyclopropene (MCP), an ethylene antagonist, has allowed ripening prevention, but overexposure may permanently prevent ripening of some species (Chiriboga et al., 2011).
Freshly butchered meat will absorb oxygen, converting purple-colored reduced myoglobin to red oxymyoglobin and then to brown metmyoglobin. Most customers are not accustomed to seeing the purple color of very fresh meat, and expect it to be red in color, although the redness occurs through oxidation. This leads to the problem of extending the shelf life of meat products beyond a few days, since the packaging must allow oxygen in to provide the expected red coloration yet at the same time preventing the ongoing brownish discoloration as metmyoglobin is formed from oxygen. Work is ongoing with this. Many centralized meat packing facilities for large retailers may use carbon monoxide gas in the package to provide a near-fresh red color. This has created some controversy as it may disguise the age of the product and prevent some spoilage indication, but the practice is being widely adopted in order to take advantage of centralized processing facilities. Similar processes are being investigated for other meat and seafood products.
Shelf Life Testing and Estimation
In most practical applications, there is not enough time to actually wait for several iterations of the product’s long intended shelf life in order to develop and refine a package. Once the initial design is laid out, it is often subjected to accelerated shelf life testing in order to allow an approximate assessment of protection over a shortened period. Shelf life modeling should be followed up with substantial quality-assessment data from actual distributed product over time, and attention should also be paid to errors in estimation methods, and their effect on longer-term predictions.
Q10 Accelerated Shelf Life Testing
For food and related products, shelf life testing may involve storing the test packages at high temperatures in order to accelerate the degradation that will occur over time. The core assumption with Q10 testing is that with an Arrhenius type reaction (Equation 6.5.6), increasing the temperature by 10°C will cause the quality loss rate to increase by a scaling factor (k). The k value can be thought of as a magnification of effect over time by increasing the temperature of the test, within moderation. The general approach is commonly termed Q10 testing (Ragnarsson and Labuza, 1977):
\[ k=Ae^{\frac{-E_{a}}{RT}} \]
and
\[ Q_{10} = \frac{\text{Time for product to spoil at temperature T }^\circ C}{\text{Time for product to spoil at temperature }(+10^\circ C)} \]
where k = reaction rate constant, in this context effectively the rate of quality deterioration
A = pre-exponential constant for the reaction
Ea = activation energy for the reaction (same units as RT)
R = universal gas constant
T = absolute temperature (kelvin)
Q10 = quality-loss scaling factor (dimensionless)
Typically Q10 values are in the range of 1.0 to 5.0 but must be verified by testing. Remember that shelf life is the result of many overlapping reactions, all of which may have very different kinetics, so the range of valid estimation is narrowly limited and the method and its results should be treated with great caution. There is a danger of attempting to do rapid testing at senselessly high temperatures, leading to grossly inaccurate estimations because of phase changes in the product, exceeding the packaging material’s glass transition temperature, thawing, vaporization of compounds, and similar non-linear temperature effects that violate the simple Arrhenius kinetics assumed in many shelf life studies (Labuza, 2000).
Applications
The Packaging Cycle
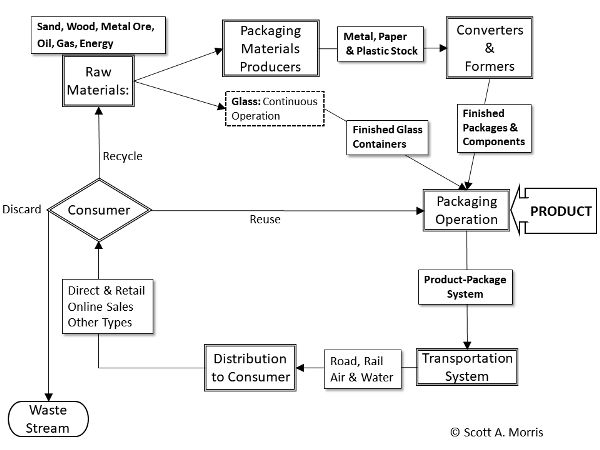
Given the enormous variety of materials, structures, and components of packages (e.g., rigid vs. flexible, cans vs. pouches) for a global range of products, it is useful to consider packaging as a material-use cycle (Figure 6.5.8) (Morris, 2011). This cycle originated with large-scale, industrialized types of packaging, but can be used to visualize the use of materials and design factors in other, smaller, or more specialized types of operations. When considering a new type of packaging material or new design, it provides a useful means for analyzing the resulting changes in sourcing and disposition beyond the immediate demands of the product.
Raw Materials
Raw materials of a full spectrum of major packaging materials and components consist of the resources needed to create the basic packaging materials. Raw materials are included in the packaging cycle because shifts in global resource production or supply may markedly affect package design and choice.
Conversion of Materials
Material conversion takes bulk, refined materials such as steel ingots or plastic resin pellets and converts them to an intermediate form, such as plastic film or metal foil, which is sent to manufacturers who create the finished package. Special processing may occur at this step, such as the plating of tin-plated steel for steel cans, or the aluminizing of plastic films for snack packaging. Because of the difficulties in molding molten glass, glass containers move directly from the refining furnace to finished containers in a single operation.
Finished Packages
Converted materials are made into ready-to-fill packages and necessary components such as jars, cans, bottles, boxes, and their lids or other closures. This step may occur in many places depending on the product involved. For example, a dairy operation or soft drink bottler in a rural area may find it advantageous to be able to produce containers directly on-site. Other operations, such as canneries in crop producing areas, may have a nearby can or pouch fabricator serving several different companies to take advantage of local demand, or there may be a range of local producers working on contract to serve a large-scale local operation.
Package Filling Operation
The package filling operation brings together the package and the product to form a system intended to maintain and protect the product. In this step, the package is filled and sealed. Packaged products are then sent to any secondary treatment such as thermal sterilization, irradiation, or high-pressure treatment (omitted from Figure 6.5.8). Once ready for shipment, the packages are usually unitized into multiples for greater handling and distribution efficiency.
This step also includes critical operations such as sealing, weight verification, label application, batch marking and “use by” date printing. Correct operation is imperative to deliver a consistent level of quality. Improvements in data management and control systems have offered efficiency improvements in this stage. For example, intra-system communication protocols, such as ISA-TR88.00.02 (often referred to as PackML, for packaging machine language), have been developed that define data used to monitor and control automated packaging and production systems and allow high levels of control and operation integration and increased production efficiency.
Transportation System
The unitized product is sent out through a multitude of channels to distribution points, and is increasingly diverse with the rise of e-commerce. Typical modes of transportation are long-haul trucks, railcars, ships and barges, and aircraft. Each of these has a range of applicability and an economic envelope for efficient use. In areas with less developed infrastructure, distribution may operate very differently and high-value items, such as critical, perishable medication, may be flown in and then quickly distributed by foot, motorbike, or on pack animals. This “last mile” of distribution has become increasingly important in all markets. Even with e-commerce, distribution is left in the hands of delivery or postal services where products were previously handled by retail outlets and the customers themselves, and this introduces uncertainty and the possibility of different damage sources. Therefore, when designing a packaging system, the distribution chain must be considered to account for sources of damage. Additionally, each transportation type may have specific rules and regulations that must be followed to be considered acceptable for shipment and to limit liability.
Distribution to Consumer
Final distribution varies widely, and may have several modes in a single marketplace, such as direct-to-consumer (D2C), online retail, and traditional “shelved” retail outlets. All of these may vary in size and complexity depending on the culture, economy, market, and location. Rural markets in some countries have often responded well to small, sachet-sized manufactured products that are usually sold in larger containers elsewhere (Neuwirth, 2011), while large “club” stores may require large-volume packages, or unitized groups of product that are sold directly to consumers.
Consumer Decision about Disposal
When the product has been completely used, the final step for the packaging is disposal. The end user decides which form of disposal to use, with the decision being affected by economic incentives, cultural and popular habits, and available infrastructure. Discarded packaging is one of the most visible types of waste, since many people do not dispose or recycle it properly even when facilities are available, but is often a minority component of total municipal solid waste (MSW) relative to non-durable goods or other waste components. While collection and reuse of materials can be profitable when well-organized and when transportation and re-manufacturing infrastructure is available, many places do not have this in any functional sense. In addition, certain materials have fallen away from recyclability because of market changes. A good example is the recycling of EPS foam (expanded polystyrene, typically called Styrofoam™) in the United States. When fast food restaurants transitioned away from using EPS sandwich containers because of their environmentally unfriendly image, the ability to recycle any EPS was largely eliminated because of the loss of the largest stream of material, making most EPS recycling operations unprofitable.
Discarding into the Waste Stream
Packaging can be discarded via a collection system that collects MSW efficiently, either as landfill or as part of an energy conversion system, or it may be part of a less-centralized incineration or disposal effort. In the worst cases, there is no working infrastructure for collection, and packaging waste—particularly used food packaging—is simply left wherever is convenient and becomes a public health hazard. Recent concerns have emerged over the large-scale riverine dispersion of plastic waste into mid-oceanic gyres that create a Sargasso of waste that photodegrades very slowly, if at all, and may be a hazard to ocean ecosystems. Even in many locations with operating infrastructure, discarded materials are entombed in carefully constructed landfills that do not offer the possibility of degradation, while in others, MSW is used as an energy source for power generation. In some areas, organic material such as food and garden waste may be composted for use as fertilizer.
Reuse
Informal reuse schemes have been around as long as containers have existed. In more modern times, reuse of containers for various purposes is common, but the market for refilling in developed economies is somewhat limited to simple products such as filtered water. In some markets, the beverage industry requires that bottles be returned, with reused bottles recirculating for decades. Reuse has complications and liability concerns because of cleanliness issues and requires washing to remove secondary contaminants, such as fuels and pesticides, and inspection for contaminants that are not removed during the washing cycle.
Recycling
Recycling brings materials back into the cycle, and reuse of materials in some form is common in all cultures. The trajectory the materials take may vary widely, however. For example, the German Environment Ministry operates a “Green Dot” recycling system that requires manufacturers of packaged goods to pay into a system that collects and recycles used packaging. As of 2018, the city of Kamikatsu, Japan, which has taken on the mission of being the world’s first “zero waste” community, had 45 different categories of recycling to be collected (Nippon.com, 2018). When properly conducted, recycling is the most efficient continued use of materials, but it depends on market demand and the ability to reprocess and reuse materials. For example, aluminum, which is intrinsically much cheaper to reuse from scrap than to reduce from bauxite ore, has had efficient recycling in place for more than half a century, whereas glass is often not recycled. Recycling is, in general, a function of economics, infrastructure, and regulations; in some markets, the waste disposal sites themselves are considered a resource for extracting materials such as steel and aluminum.
The Information Cycle
The information cycle (Figure 6.5.9) is often as important as the actual material production cycle in that machine-readable coding allows the packages themselves to interface directly with point of sale (POS) systems, inventory and ordering software, and distribution infrastructure. Increasingly, this information is also used to create user profiles for product preferences, to optimize response to variations in demand, and to allow targeted marketing and distribution into niche markets.
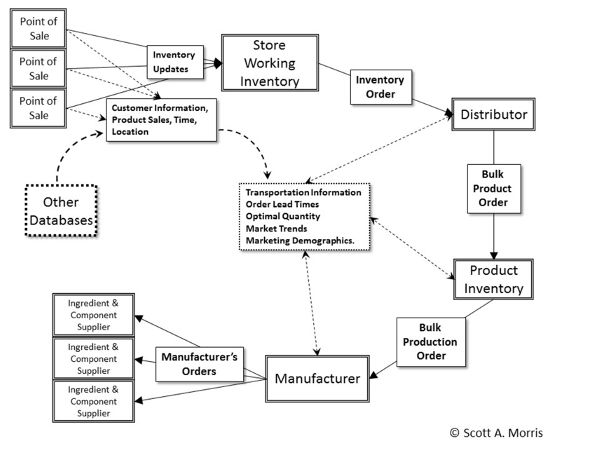
Information continuously flows back from many points in the system to automatically create orders for store inventory, to track orders, and to forecast production levels for product manufacturers. Of course, this is not tightly integrated in all cases, but serves as an idealized representation. Other useful information is derived from the correlation of other data such as credit cards, loyalty programs, phone data, and in-store tracking. This is done to assist with marketing and demographic predictions, and to automate the creation of order lead-timing with the ultimate result of reducing store inventory to those items kept on the shelf, which is constantly replenished through various “just in time” systems to meet demand. This type of distribution system is appealing but can be brittle, breaking down in the event of large-scale disruption of the distribution chain unless large-scale contingencies are considered.
The current trend is to glean marketing information from combinations of this type of data and social media metrics. Extended use of informatics in distribution systems may also serve to locate diversion or counterfeiting of product, losses and theft, and other large-scale concerns in both commercial and aid distribution (GS1.org).
Examples
Example \(\PageIndex{1}\)
Example 1: Calculation of permeation failure in a package
Problem:
Consider a fried snack chip product that will fail a test for oxidative rancidity under STP when reacting with 1.0 × 10⁻⁴ mol of oxygen and working with a polymeric film material that has \(\bar{P} = 23.7\frac{cc \cdot \mu m}{m^{2} \cdot atm \cdot day}\) and an exposed area of 0.1 m2 at STP. It is assumed that there is no oxygen in the product or package headspace, and that the partial pressure of oxygen, from Dalton’s law, is 0.21 atm. The maximum amount of permeant allowed (Q), as determined by product lab tests, is Q = 1.0 × 10⁻⁴ mol of oxygen = 2.24 cc at STP. Determine the film thickness necessary at STP to provide a shelf life of 180 days by keeping the oxygen uptake below Q.
Solution
Solve Equation 6.5.3 for quantity of permeating gas:
\( \bar{P} = \frac{\text{(quantity of permeating gas)(thickness)}}{\text{(membrane area)(time)(partial pressure difference across membrane)}} \) (Equation \(\PageIndex{3}\))
where area = 0.1 m2
\( \(\bar{P} = 23.7\frac{cc \cdot \mu m}{m^{2} \cdot atm \cdot day}\) \)
\(\Delta P = 0.21 \text{ atm}\)
\( \text{Quantity permeated} = (23.7 \frac{cc \cdot \mu m}{m^{2} \cdot atm \cdot day})(0.1\ m^{2})(0.21\ atm)\)
\( = 0.498 \frac{cc \cdot \mu m}{day} \)
\( \frac{2.24\ cc}{(0.498 \frac{cc \cdot \mu m}{day})} = 4.501 \frac{day}{\mu m} \)
For a 6 month (180 day) shelf life,
\( \frac{180 \text{ days}}{(4.501 \frac{\text{day}}{\mu m})} = 39.994\ \mu m \text{ or } 0.040\ mm \)
Example \(\PageIndex{2}\)
Example 2: Calculation of transmission rate (TR) of multi-layer film
Problem:
A composite plastic film with four layers is proposed as a packaging material. To determine its suitability, the overall transmission rate must be determined. The transmission rates, in units of (cc μm m−2 atm−1day−1), of the individual layers are the following: Film A: 5.0, Film B: 20.0, Film C: 0.05, and Film D: 20.0. What is the overall transmission rate of the film?
Solution
Calculate transmission rate (TR) using Equation 6.5.2.
\( TR_{\text{total}} = \frac{1}{TR_{\text{layer 1}}+TR_{\text{layer 2}}+…+TR_{\text{layer n}}} \) (Equation \(\PageIndex{2}\))
\( TR_{\text{total}} = \frac{1}{\frac{1}{5}+\frac{1}{20}+\frac{1}{0.05}+\frac{1}{20}} = 0.0493 \)
All rates are in \( \frac{cc \cdot \mu m}{m^{2} \cdot atm \cdot day}\).
Example \(\PageIndex{3}\)
Example 3: Stress concentration in brittle materials (the case of a glass container)
Problem:
A packaging engineer knows that the stress concentration in a scratch can affect the initiation of a fracture in the materials of a container. In order to add enough additional material in the shock band to help prevent failure, the stress concentration factor must be determined. For a scratch in the sidewall of a glass container, with a depth of 0.01 mm and a crack tip radius of 0.001 mm, what is the stress concentration factor (K)?
Solution
Calculate K using Equation 6.5.5:
\( K = \frac{\sigma_{max}}{\sigma_{app}} = 2(\frac{d}{r})^{1/2} \) (Equation \(\PageIndex{5}\))
or simply
\( K = 2(\frac{d}{r})^{1/2} \)
where d = depth of crack = 1.0 × 10⁻⁵ m
r = radius of crack tip = 1.0 × 10⁻⁶ m
\( = 2(\frac{1.0 \times 10^{-6}\ m}{1.0 \times 10^{-5}\ m})^{1/2} \)
\( \cong 6.32 \text{ times the applied stress} \)
Example \(\PageIndex{4}\)
Example 4: Identify the type of failure in glass
Problem:
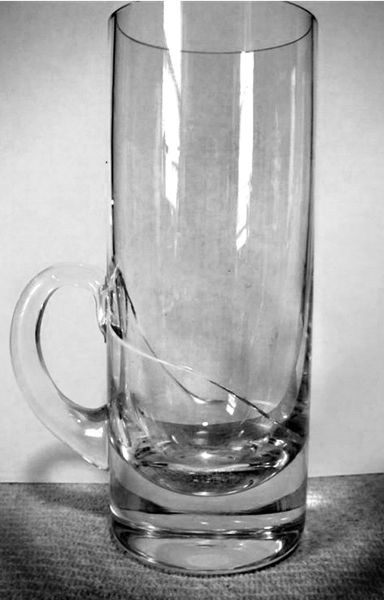
Identify the type of failure experienced by the fractured glass in Figure 6.5.10.
Solution
The glass failed from thermal shock as evidenced by the crack traversing the region of transition from very thin sidewall to very thick base, the thickness change at the handle attachment point, and the lack of secondary fragmentation. The thick sections change temperature much more slowly than the thin sidewall, creating shear stress from differential expansion and failure in the material.
Example \(\PageIndex{5}\)
Example 5: Q10 determination and shelf life estimation
Problem:
A new food product is being introduced, and a 180-day shelf life has been determined to be necessary. Because of the short timeframe for production, years of repeated long-term shelf-life tests are not practical. Spoilage of the food product is determined by testing for discoloration using a color analyzer. Shelf life estimations are conducted at temperatures of 25°C and 35°C for 15 days, and the time for the discoloration criteria to be exceeded is projected from the short-term data to be 180 days at 25°C and 60 days at 35°C. These values are useful for estimating the Q10 value for the new product. For a more accurate estimate of the 180-day shelf life when stored at 25°C, an accelerated test at a higher temperature is planned to determine if the product fails or not. Estimate the time required for the complete accelerated test of the 180-day shelf life at 25°C with testing conducted at 45°C.
Solution
The first step is to calculate Q10 using Equation 6.5.7:
\( Q_{10} = \frac{\text{time for product to spoil at temperature T}_{1}}{\text{time for product to spoil at temperature T}_{2}}^{\frac{10}{(T_{1}-T_{2})}} \) (Equation \(\PageIndex{7}\))
\( Q_{10} = \frac{180\text{ days}}{60\text{ days}}^{\frac{10}{(35^\circ -25^\circ)}} = 3.0 \)
Under the simplest of linear-data circumstances (see cautionary note in text), the product shelf life will decrease by 1/Q10 for each Q10 interval (10°C in this case) increase in storage temperature. Thus, when stored at 45°C, which is two times the Q10 interval, the product would have a shelf life of 180 days × (1/3) × (1/3) = 20 days. The test time can also be calculated by using the Q10 value of 3.0 to solve Equation 6.5.7 for the time for the product to spoil at 45°C:
\( 3.0 = \frac{180\text{ days at }25^\circ C}{\text{X days at } 45^\circ C}^{\frac{10}{(45 -25)}} = 3.0 \)
\( X= \frac{180}{9} = 20 \text{ days} \)
This procedure allows the simple-case projected estimation of a 180-day shelf life using only 20 days of exposure at 45°C to estimate shelf life at 25°C. Such accelerated testing allows an approximate estimation of shelf life using increased temperatures and is useful for testing when product formulations or packaging change as well as contributing to ongoing quality control.
Note that errors in measurement or procedure at 45° will be amplified. A 5% error in measurement at 45°C will produce 5% × 180 days = ±9 days of error in the estimated shelf life. Results from accelerated testing are often very simplified, and may produce spurious results or failure from another condition not included in the model. Follow up tests with real-world products is an essential part of validating and correcting deficiencies in the model and is a common practice with many products.
Image Credits
Figure 1. Morris, S. A. (CC By 4.0). (2020). Global Use of Packaging Materials by Type. (Created with data from Packaging Distributors of America, 2016).
Figure 2. Morris, S. A. (CC By 4.0). (2020). Illustration of highly ordered polymer chains in crystalline regions and disordered chains in amorphous regions.
Figure 3. Morris, S. A. (CC By 4.0). (2020). Relationship of crystallinity, molecular weight (which increases with chain length in this example), and physical properties for a typical linear polyolefin (polyethylene shown). ρ is density in g/ml. Morris, S. A. (2011). Food and package engineering. New York, NY: Wiley & Son.
Figure 4. Morris, S. A. (CC By 4.0). (2020). Repeat unit structures of common packaging polymers.
Figure 5. Morris, S. A. (CC By 4.0). (2020). Permeation through packaging film membrane.
Figure 6. Morris, S. A. (CC By 4.0). (2020). Fracture failure in a brittle material.
Figure 7. Morris, S. A. (CC By 4.0). (2020). Illustration of glass failure types and significant indications of failure source.
Figure 8. Morris, S. A. (CC By 4.0). (2020). Packaging cycle showing the material use cycle from raw materials through package manufacturing, filling, distribution, and end-of-life (EOL) disposition. Morris, S. A. (2011). Food and package engineering. New York, NY: Wiley & Son.
Figure 9. Morris, S. A. (CC By 4.0). (2020). The information cycle illustrating how information from the point of sale (POS) as well as distribution and transportation sources use machine-readable information to create orders, manage inventory levels and provide secondary information about customers, marketing trends and distribution characteristics Morris, S. A. (2011). Food and package engineering. New York, NY: Wiley & Son.
Figure 10. Morris, S. A. (CC By 4.0). (2020). Fractured Glass Example.
References
American Peanut Council. (2009). Good manufacturing practices and industry best practices for peanut product manufacturers. Retrieved from https://www.peanutsusa.com/phocadownload/GMPs/2009%20APC%20GMP%20BP%20Chapter%207%20Peanut%20Product%20Manufacturers%2016%20Nov%2009%20Final%20Edit.pdf.
Bodenheimer, G. (2014). Mitigating packaging damage in the supply chain. Packaging Digest. Retrieved from https://www.packagingdigest.com/supply-chain/mitigating-packaging-damage-inthe-supply-chain140910.
Bradt, R. C. (2011). The fractography and crack patterns of broken glass. J. Failure Analysis Prevention, 11(2), 79–96. doi.org/10.1007/s11668-011-9432-5.
Burns, C. S., Heyerick, A., De Keukeleire, D., & Forbes, M. D. (2001). Mechanism for formation of the lightstruck flavor in beer revealed by time-resolved electron paramagnetic resonance. Chem. European J., 7(21), 4553–4561. doi.org/10.1002/1521-3765(20011105)7:21<4553:aid-chem4553>3.0.co;2-0.
Chiriboga, M. A., Schotsmans, W. C, Larrigaudière, C., Dupille, E., & Recasens, I. (2011). How to prevent ripening blockage in 1-MCP-treated ‘Conference’ pears. J. Sci. Food Agric, 91(10), 1781–1788. doi.org/10.1002/jsfa.4382.
Cooksey, K., Marsh, K., & Doar, L. H. (1999). Predicting permeability & transmission rate for multilayer materials. Food Technol., 5(9), 60–63. https://www.ift.org/news-and-publications/food-technology-magazine/issues/1999/september/features/predicting-permeability-and-transmission-rate-for-multilayer-materials.
Dalton, J. (1802). Essay IV. On the expansion of elastic fluids by heat. Memoirs of the Literary and Philosophical Society of Manchester, 5(2), 595–602.
deMan, J. M. (1981). Light-induced destruction of vitamin A in milk. J. Dairy Sci., 64(10), 2031–2032. https://doi.org/10.3168/jds.S0022-0302(81)82806-8.
EFSA. (2017). BisPhenol A. European Food Safety Authority. Retrieved from https://www.efsa.europa.eu/en/topics/topic/bisphenol.
Fick, A. (1855). Ueber diffusion. Ann. Physik; 9(4), 59–86.
Griffith, A. A. (1921). VI. The phenomena of rupture and flow in solids. Phil. Trans. Royal Soc. A, 221(1 January 1921), 582–593. http://dx.doi.org/10.1098/rsta.1921.0006.
ISO. (2017). ISO 2528:2017: Sheet materials — Determination of water vapour transmission rate (wvtr) — Gravimetric (dish) method. Geneva, Switzerland: International Organization for Standardization. Retrieved from https://www.iso.org/standard/72382.html.
Labuza, T. (2000). The search for shelf life. Food Testing and Analysis, 6(3), 26–36.
Mangaraj, S., Goswami, T. K., & Panda, D. K. (2015). Modeling of gas transmission properties of polymeric films used for MA packaging of fruits. J. Food Sci. Technol., 52(9), 5456–5469. dx.doi.org/10.1007/s13197-014-1682-2.
Mannheim, C., & Passy, N. (1982). Internal corrosion and shelf life of food cans and methods of evaluation. Crit. Rev. Food Sci. Nutr., 17(4), 371–407. http://dx.doi.org/10.1080/10408398209527354.
Misko, G. G. (2019). The regulation of food packaging. SciTech Lawyer, 15(2). Retrieved from https://www.packaginglaw.com/special-focus/regulation-food-packaging.
Morris, S. A. (2011). Food and package engineering. New York, NY: Wiley & Son.
Nakaya, M., Uedono, A., & Hotta, A. (2015). Recent progress in gas barrier thin film coatings on pet bottles in food and beverage applications. Coatings, 5(4), 987–1001. https://doi.org/10.3390/coatings5040987.
National Research Council. (1994). 3. Manufacturing: Materials and processing. In Polymer science and engineering: The shifting research frontiers (pp. 65–115). Washington, DC: The National Academies Press. https://doi.org/10.17226/2307.
Neuwirth, B. (2011). Marketing channel strategies in rural emerging markets: Unlocking business potential. Chicago, IL: Kellogg School of Management. Retrieved from www.kellogg.northwestern.edu/research/crti/opportunities/~/media/Files/Research/CRTI/Marketing%20Channel%20Strategy%20in%20Rural%20Emerging%20Markets%20Ben%20Neuwirth.ashx.
Nippon.com. (2018). The Kamikatsu zero waste campaign: How a little town achieved a top recycling rate. Retrieved from https://www.nippon.com/en/guide-to-japan/gu900038/the-kamikatsu-zero-waste-campaign-how-a-little-town-achieved-a-top-recycling-rate.html.
Packaging Distributors of America. (2016). The numbers behind boxes and tape. Retrieved from http://www.pdachain.com/2016/11/30/packaging-statistics-that-might-surprise-you/.
Palmer, B. (2014). Why glass jars aren’t necessarily better for the environment than plastic ones. Washington Post, June 23, 2014. Retrieved from https://www.washingtonpost.com/national/health-science/why-glass-jars-arent-necessarily-better-for-the-environment-than-plastic-ones/2014/06/23/2deecfd8-f56f-11e3-a606-946fd632f9f1_story.html?noredirect=on&utm_term=.30ac7c6f77.
Pennella, C.R. (2006). Managing contract quality requirements. Milwaukee, WI: American Society for Quality, Quality Press Publishing.
Ragnarsson, J. O., & Labuza, T. P. (1977). Accelerated shelf life testing for oxidative rancidity in foods—A review. Food Chem., 2(4), 291–308. https://doi.org/10.1016/0308-8146(77)90047-4.
Rogers, C. E. (1985) Permeation of gases and vapours in polymers. In J. Comyn (Ed.), Polymer permeability (pp. 11–73). London, UK: Chapman and Hall.
Sajilata, M. G., Savitha, K., Singhal, R. S., & Kanetkar, V. R. (2007). Scalping of flavors in packaged foods. Comprehensive Rev. Food Sci. Food Saf., 6(1), 17–35. doi.org/10.1111/j.1541-4337.2007.00014.x.
Sanchez, I. C., & Rogers, P. A (1990). Solubility of gases in polymers. Pure & Appl. Chem., 62(11), 2107–2114.
Sigma-Aldrich Inc. (2019). Thermal transitions of homopolymers: Glass transition & melting point. Retrieved from https://www.sigmaaldrich.com/technical-documents/articles/materials-science/polymer-science/thermal-transitions-of-homopolymers.html.
Silvers, K. W., Schneider, M. D., Bobrov, S. B., & Evins, S. E. (2012). PET containers with enhanced thermal properties and process for making same. U.S. Utility Patent No. US9023446B2. Retrieved from https://patents.google.com/patent/US9023446B2/en?oq=US9023446.
Suloff, E. C. (2002). Chapter 4. Permeability, diffusivity, and solubility of gas and solute through polymers. In Sorption behavior of an aliphatic series of aldehydes in the presence of poly(ethylene terephthalate) blends containing aldehyde scavenging agents. PhD diss. Blacksburg, VA: Virginia Polytechnic Institute and State University, Department of Food Science and Technology. http://hdl.handle.net/10919/29917.
Thermofisher Inc. (2019). Physical properties table. Brochure D20823. Retrieved from http://tools.thermofisher.com/content/sfs/brochures/D20826.pdf.
USFDA. (2019). Packaging & food contact substances (FCS). United States Food and Drug Administration. Washington, DC: USFDA. Retrieved from https://www.fda.gov/food/food-ingredients-packaging/packaging-food-contact-substances-fcs.
Wu, Y. W. (2016). Investigation of corrosion in canned chicken noodle soup using selected ion flow tube-mass spectrometry (SIFT-MS). MS thesis. Columbus, OH: The Ohio State University, Department of Food Science and Technology. Retrieved from etd.ohiolink.edu/apexprod/rws_olink/r/1501/6.
Zweep, C. (2018). Determining product shelf life. Food Qual. Saf., October-November 2018. Retrieved from https://www.foodqualityandsafety.com/article/determining-product-shelf-life/.