
3.5: Flow Sensors
- Page ID
- 22377

Introduction
Flow is defined as the rate (volume or area per unit time) at which a substance travels through a given cross section and is characterized at specific temperatures and pressures. The instruments used to measure flow are termed flow meters. The main components of a flow meter include the sensor, signal processor and transmitter. Flow sensors use acoustic waves and electromagnetic fields to measure the flow through a given area via physical quantities, such as acceleration, frequency, pressure and volume. As a result, many flow meters are named with respect to the physical property that helps to measure the flow.
Flow measurement proves crucial in various industries including petroleum and chemical industries. Consequently, flow measurement becomes a major component in the overall economic success or failure of any given process. Most importantly, accurate flow measurements ensure the safety of the process and for those involved in its success.
Before reading about the intricate details of various flow meters it's a good idea to think about aspects other than the design, governing equations, and the mechanism a flow meter uses in identifying a flow profile. To gain more from this section consider the following questions when learning about each flow meter because when choosing a flow meter the two main things to think about are cost and application:
- What mechanism does this flow meter use to measure flow?
- How expensive is it?
- What impact does it have on the system? (How much power does it withdraw from the system and does the disturbance of flow cause significant problems up or downstream?
- What are the accuracy limits of the tool? (Increased accuracy and precision results in higher cost especially for those with automated noise filtering and signal amplifying capabilities.
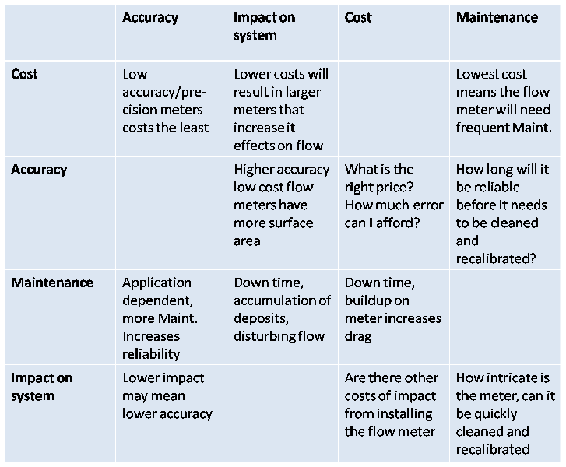
Sometimes you may be given an assignment to purchase a tool for your company's system and given with it a list of qualities to look for in order of importance, sometimes you're going to have to make this list yourself. The following table is a component of the TRIZ method for developing a list of qualities in descending order of importance on the left, perpendicular to the factor it has an impact on, to the right. For a given system you figured out that the cheapest solution for accurately measuring the flow rates of various pipe lines is by placing multiple flow meters in a series of positions. From a few calculations using propagation of error you find a moderate range of accuracy limits necessary for your system to be considered well monitored. You know the accuracy limits are less important than the total cost of all the flow meters because your boss told you not to waste any money. On the table you can see that Cost is at the top of the left column so Cost is the main concern. Accuracy is in the farthest left column on the top row so Cost most dramatically exacerbates the Accuracy of the flow meter when it's minimized. In the intersecting box you see that the lowest price flow meters are the ones with the least amount of accuracy, generally speaking. The next most important quality of your assignment is to get flow meters with the appropriate accuracy, thus Accuracy is below Cost in the left column. Looking to the top row you see that the Accuracy of the flow meter most greatly effects the Impact on the system. If you have a low quality flow meter it may be due to the side of the mechanism used to measure flow or the power the meter draws from the system (through mixing, frictional losses, increase in the turbulence of the flow, or buoyant effects caused from heat transfer). Completing the rest of the table you can decide if there are contradictions to what you thought were the most important qualities based on the inputs in the intersecting cells.
An example where this model is important is for a system containing suspended particles in a fluid. If you want to measure the flow rate it might be cheapest to use a pitot tube yet the increased cost of maintaining the flow meter extends into down time of the system, more work from the technicians for a relatively small aspect of the process and lower profits as a result. For this system, maintenance would be the most important factor followed by accuracy, impact on the system and cost. If cost were least important factor you could afford to install a couple doppler meters, gather accurate measurements and the impact of the measurements on the system would be relatively low.
Common Types of Flow Meters
The flow rate as determined by the flow sensor is derived from other physical properties. The relationship between the physical properties and the flow rate is derived from fundamental fluid flow principles, such as Bernoulli’s equation.
DIFFERENTIAL PRESSURE
These sensors work according to Bernoulli’s principle which states that the pressure drop across the meter is proportional to the square of the flow rate.
\[-\Delta p \propto V^{2} \nonumber \]
Using the pressure drop across a pipe’s cross section is one of the most common manners to determine a flow measurement. As a result, this property has heavy implications for industrial applications. Flow meters characterized by differential pressure come in several different varieties and can be divided into two categories, laminar and turbulent. Differential pressure sensors operate with respect to Bernoulli’s principle. Bernoulli’s principle states that the pressure drop across the meter is proportional to the square of the flow rate.
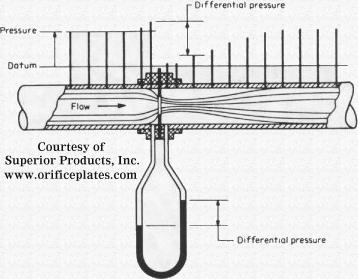
Orifice Meter
Orifice plates are installed in flow meters in order to calculate the material balances that will ultimately result in a fluid flow measurement on the sensor. An orifice plate is placed in a pipe containing a fluid flow, which constricts the smooth flow of the fluid inside the pipe. By restricting the flow, the orifice meter causes a pressure drop across the plate. By measuring the difference between the two pressures across the plate, the orifice meter determines the flow rate through the pipe. The larger the pressure drop, the faster the flow rate would be. There are two types of orifice meters that are usually used in industry, they are the orifice-square edge and the orifice-conic edge. The orifice-square edge has insignificant friction at the interface between the fluid and the orifice plate. These types of orifice plates are recommended for smooth fluid flows, particularly clean liquids and gases such as steam. Generally, drain holes are incorporated in the design so that liquids and gases do not accumulate inside the pipes. Multi-phase fluids are not recommended for the orifice-squared edge because clogging becomes a significant problem as time progresses. The orifice-conic edge is similar to the orifice-square edge, the primary difference being that the orifice-conic edge has a gradually expanding cross-sectional area, and this cross-sectional area is circular in shape. A conic-edge design is often a better choice for low velocity, high viscosity flows. Both types operates best under comparable temperature and pressure conditions, pipe sizes and provide similar accuracies.
Orifice meters used in conjunction with DP (Differential Pressure) cells are one of the most common forms of flow measurement. In addition, an orifice meter can be used to measure flows when there is a significant difference in pressure in the pipe, like between the upstream and downstream sides of a partially obstructed pipe, which is exactly what the orifice meter does on its own. The plate offers a precisely measured obstruction that essentially shrinks the pipe and forces the flowing substance to constrict. A DP cell allows the comparison of pressure on the upstream (unobstructed) side and the downstream (constricted) side. A greater rate of fluid flow would usually result in a larger pressure drop, since the size of the orifice remains constant and the fluid is held longer building potential energy on the upstream side of the orifice. Some of the other types of orifice plates include concentric, eccentric and segmental plates, each having different shapes and placements for measuring different processes. These plates are available in varied shapes so that the meter has the optimum structure for different applications. Moreover, the density and viscosity of the fluid, and the the shape and width of the pipe also influences the choice of plate shape to be used.
Such a pressure drop across the plate is then related to the flow rate using basic fluid mechanics principles that incorporate parameters such as density of the fluid and size of the pipe. The flow rate Q, given by the orifice meter, is usually modeled with the following equation:
Where p1 − p2 is the pressure drop across the plate, ρ is the fluid density, A1 is the pipe cross-sectional area, A2 is the orifice cross-sectional area, and Cd is the discharge coefficient (usually about 0.6). Cd is used to account for energy losses within the system.
The orifice meter is one of the most commonly used flow meters, since it is inexpensive to install and operate, it is uncomplicated and easy to construct, and it is highly robust and long lasting. Orifice meters are not only simple and cheap, they can also be delivered for almost any application and be made of any material. This simplicity of its design and function is one of its paramount advantages, with the meter essentially consisting of just a modified plate. This not only reduces its initial price but also shrinks its operating costs, maintenance expenses, and spare parts expenditure and availability. Lower flow rates reduces their accuracy, whereas higher flow rates combined with high quality, unworn orifice plates increases it. The orifice plate is best when a sharp edge is present towards the upstream side of the meter. Wear reduces the accuracy of orifice plates. The turndown rate of orifice plates are generally less than 5:1. More information about turndown rates is mentioned in a later section.
Venturi Meter
Venturi meters can pass 25 – 50% more flow than an orifice meter. In a Venturi meter setup, a short, smaller diameter pipe is substituted into an existing flow line. Because the Venturi meter is insensitive to changes in the velocity profile of the fluid flow, the pipe design does not need to be straight like the orifice meter. Though initially expensive, the Venturi meter has relatively low maintenance and operation costs.
In the Venturi Tube the fluid flowrate is measured by reducing the cross sectional flow area in the flow path, generating a pressure difference. After the constricted area, the fluid is passes through a pressure recovery exit section, where up to 80% of the differential pressure generated at the constricted area, is recovered.
There are two main types of Venturi meters. The first one, known as the classical Herschel Venturi meter, is a very long meter characterized below. Pressure readings at different points in the meter are combined to provide an average pressure reading. Cleaning the classical Venturi meter is limited. The second type of Venturi meter is known as the short form Venturi meter. This differs from its longer counterpart by reduced size and weight.
By Bernoulli’s principle the smaller cross-sectional area results in faster flow and therefore lower pressure. The Venturi meter measures the pressure drop between this constricted section of pipe and the non-constricted section.
The discharge coefficient for the Venturi meter is generally higher than that used for the orifice, usually ranging from .94 to .99.
The Venturi meter is most commonly used for measuring very large flow rates where power losses could become significant. The Venturi flow meter has a higher start up cost than an orifice, but is balanced by the reduced operating costs.
Due to simplicity and dependability, the Venturi tube flowmeter is often used in applications where higher turndown ratiosor lower pressure drops than orifice plates can provide are necessary. With proper instrumentation and flow calibrating the venturi meter flowrate can be reduced to about 10% of its full scale range with proper accuracy. This provies a turndown ratio of around 10:1.
Flow Nozzle
Another type of differential pressure flowmeter is the flow nozzle. Flow nozzles are often used as measuring elements for air and gas flow in industrial applications. At high velocities, Flow Nozzles can handle approximately 60 percent greater liquid flow than orifice plates having the same pressure drop. For measurements where high temperatures and velocities are present, the flow nozzle may provide a better solution than an orifice plate. Its construction makes it substantially more rigid in adverse conditions and the flow coefficient data at high Reynolds numbers is better documented than for orifice plates. Liquids with suspended solids can also be metered with flow nozzles. However, the use of the flow nozzles is not recommended for highly viscous liquids or those containing large amounts of sticky solids. The turndown rate of flow nozzles is similar to that of the orifice plate. The flow nozzle is relatively simple and cheap, and available for many applications in many materials.
The Sonic Nozzle- Critical(Choked)Flow Nozzle
One type of flow nozzle is the sonic nozzle. The Sonic Nozzle is a converging-diverging flowmeter. It consists of a smooth rounded inlet section converging to a minimum throat area and diverging along a pressure recovery section or exit cone.
The Sonic Nozzle is operated by either pressurizing the inlet (P1) or evacuating the exit (P3), to achieve a pressure ratio of 1.2 to 1 or greater, inlet to outlet. When a gas accelerates through a nozzle, the velocity increase and the pressure and gas density decrease. The maximum velocity is achieved at the throat, the minimum area, where it breaks Mach 1 or sonic. At this point it's not possible to increase the flow by lowering the downstream pressure. The flow is choked. Pressure differences within a piping system travel at the speed of sound and generate flow. Downstream differences or disturbances in pressure, traveling at the speed of sound, cannot move upstream past the throat of the Nozzle because the throat velocity is higher and in the opposite direction.
Sonic Nozzles are used in many control systems to maintain fixed, accurate, repeatable gas flow rates unaffected by the downstream pressure. If you have a system with changing or varying gas consumption downstream and you want to feed it a constant or locked flowrate, a Sonic Nozzle is an excellent way to achieve this.
Pitot Tubes
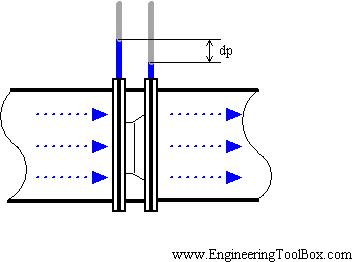
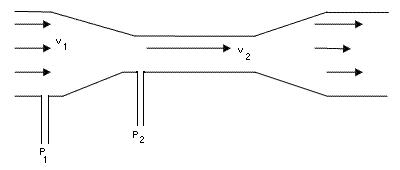
Pitot tubes measure the local velocity due to the pressure difference between points 1 and 2 in the diagrams below. Unlike the other differential flow meters, the pitot tubes only detect fluid flow at one point rather than an overall calculation. The first diagram shows a simple pitot tube configuration while the second shows a compact pitot tube configuration.
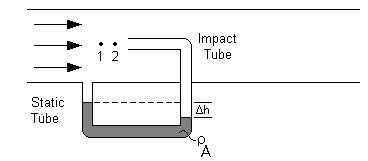
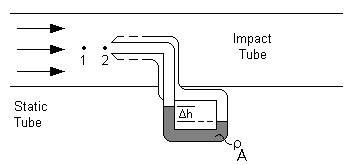
Both tubes work in a similar manner. Each pitot tube has two openings, one perpendicular to the flow and one parallel to the flow. The impact tube has its opening perpendicular to the fluid flow, allowing the fluid to enter the tube at point 2, and build up pressure until the pressure remains constant. This point is known as the stagnation point. The static tube, with openings parallel to the fluid flow gives the static pressure and causes a sealed fluid of known density to shift in the base of the tube. Pressure drop can be calculated using the height change along with the fluid densities and the equation below.
\[\Delta p=\Delta h\left(\rho_{A}-\rho\right) g \nonumber \]
with Δp as the pressure drop, ρA as the known fluid density, ρ as flowing fluid’s density, and g as the acceleration due to gravity.
This pressure drop can be related to the velocity after accounting for the losses throughout the piping in the system, given by Cp. This dimensionless coefficient is found through accurate calibration of the pitot tube. The equation below describes this relationship.
\[v=C_{p} \sqrt{\frac{2\left(p_{1}-p_{2}\right)}{\rho}} \nonumber \]
with v as the fluid velocity, Cp as the loss coefficient, p1 as the pressure at point 1, p2 as the pressure at point 2, and ρ as the flowing fluid’s density.
By placing the tube at the exact center of the pipe, the maximum velocity can be measured and the average velocity can be calculated via the Reynolds number. The governing equation and chart are below.
\[R e=\frac{D v_{\max } \rho}{\mu} \nonumber \]
with Re as the Reynolds number, D as the pipe diameter, vmax as the maximum velocity, ρ as the flowing fluid’s density, and μ as the flowing fluid’s viscosity.
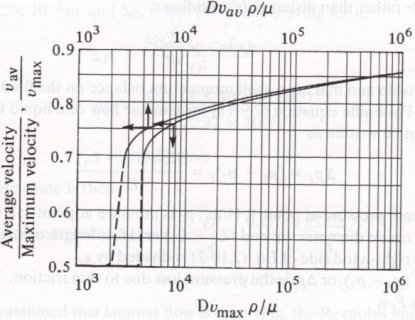
Adapted from Geankoplis.
Finally, the flow rate can be found by accounting for the area of the pipe.
\[Q=v_{\operatorname{avg}} \frac{\pi}{2} r^{2} \nonumber \]
with \(Q\) as the volumetric flow rate, \(v_{avg}\) as the average velocity, and \(r\) as the pipe’s radius.
It should be noted that all the equations apply to incompressible fluids only, but these can be used to approximate gas flows at moderate velocities. This flow meter must also be placed at least 100 pipe diameters in distance, downstream of the nearest flow obstruction. This ensures no unwanted pressure fluctuations and accurate pitot tube readings. Furthermore, fluids containing large particles can clog the pitot tube and should be avoided.
DIRECT FORCE
These flow meters are governed by balancing forces within the system.
Rotameter
A rotameter is a vertically installed tube that increases in diameter with increasing height. The meter must be installed vertically so that gravity effects are easily incorporated into the governing equations. Fluid flows in through the bottom of the tube and out through the top. Inside the glass tube there is a float that changes position with the flow rate. When there is no liquid flow, the float rests in the bottom of the meter.
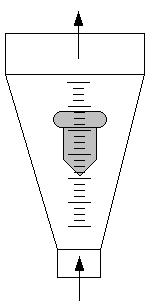
The applied concept for the rotameter is differential area. As the flow rate of the fluid changes, the position of the float changes and annular area change directly, keeping a constant pressure drop across the meter. Changes in float position and annular area are approximately linear with changes in flow rate. Upon achieving a stable flow rate, the vertical forces are balanced and hence the position of the float remains constant. The volumetric flow is given by the following equation:
\[Q=C A_{b} \sqrt{\frac{2 g\left(\frac{V_{f}\left(\rho_{f}-\rho\right)}{A_{f}}-\rho h_{f}\right)}{\rho\left[1-\left(\frac{A_{b}}{A_{a}}\right)^{2}\right]}} \nonumber \]
with C being the discharge coefficient, Ab being the cross sectional area of the top of the float, Vf volume of the float, ρf the density of the float, ρ the density of the fluid hf the height of the float, Aa the cross sectional area of the bottom of the float.
Generally, rotameters are inexpensive and simple to use. This allows them to be used in many plant applications.
Turbine Meter
A turbine wheel is placed in a pipe that holds the flowing fluid. As the fluid flows through the turbine, the turbine is forced to rotate at a speed proportional to the fluid flow rate. A magnetic pick-up is mounted to the turbine wheel, and a sensor records the produced voltage pulses. Voltage information can then be translated into the actual flow meter reading.
The following is the equation used to model the turbine meter:
\[Q=V A=\frac{\omega(\bar{r})^{2} A^{2}}{\bar{r} A \tan \beta-0.037 R e^{-0.2} n\left(R_{o}+R_{i}\right) D \sin \beta} \nonumber \]
with A the pipe area,  the root mean squared radius, ω rotational speed,β the angle between the flow direction and the turbine blades,Ro the outer blade radius, Ri the inner radius, and D the distance between blades.
There are two main advantages of the turbine meter over conventional differential head devices
- The extended are more accurate registration of flow in the low flow range of process operation. This results from the registration being proportional to the velocity rather than the velocity square
- The comparatively low head loss across the meter
Another advantage to using this type of flow meter is reliability. Extensive testing has proven these results. Additionally, the turbine flow meter does not have a high installation cost. However, due to the turbine wheel motion, a low to medium pressure drop can result. Turbine wheel replacement may also be required due to abrasion caused by particles within the fluid.
Propeller Flow Meter
Propeller flow meters have a rotating element similar to the wheel in turbine meters. Again, rotation is caused by fluid flow through the propeller, and voltage pulses are created as the propeller passes a magnetic or optical sensor. Similarly, the frequency of the pulses is proportional to flow rate of the fluid and the voltages can be directly correlated with the fluid flow rate.
Propeller flow meters are often used specifically with water, though other fluids may also be used. Low cost coupled with high accuracy make propeller flow meters a common choice in many applications.
Paddle Wheel Sensors
A kind of propeller sensor is the paddle wheel sensor. Paddle wheel sensors are similar to turbine sensors, except for one thing. The shaft of the paddle wheel sensor is perpendicular to the flow of the fluid while the turbine sensor’s shaft is parallel to the flow of the fluid. This adds several advantages for the paddle wheel flow sensor. Due to the shaft being perpendicular to the flow, it sustains less axial from the fluid, and thus less friction. Paddle wheel sensors also have a smaller number of blades, so there is less force needed to turn the paddle wheel. This means that a paddle wheel can be accurate at lower flows, have a high efficiency, as well as a longer lifetime.
There are two kinds of paddle wheel sensors, insertion and inline sensors. There is more than one design for an insertion sensor, but one popular design has the bearing built into the rotor and the shaft sliding through it as the center axis of spin. The blade sticks out and is inserted into the pipe with the flowing fluid. An inline paddle wheel sensor is used for smaller pipes. It contains a rotor assembly with the magnet sealed inside and a main body.
Coriolis Mass Flow Meter
A Coriolis flow meter harnesses the natural phenomenon wherein an object will begin to “drift” as it travels from or toward the center of a rotation occurring in the surrounding environment. A merry-go-round serves as a simple analogy; a person traveling from the outer edge of the circle to its center will find himself deviating from his straight-line path in the direction of the ride’s rotation.
Coriolis flow meters generate this effect by diverting the fluid flow through a pair of parallel U-tubes undergoing vibration perpendicular to the flow. This vibration simulates a rotation of the pipe, and the resulting Coriolis “drift” in the fluid will cause the U-tubes to twist and deviate from their parallel alignment. This Coriolis force producing this deviation is ultimately proportional to the mass flow rate through the U-tubes.
\[\text{Mass Flow}=\frac{F_{c}}{2 w x} \nonumber \]
where \(F_c\) is the Coriolis force observed, \(w\) is the angular velocity resulting from rotation, and \(x\) is the length of tubing in the flow meter.
Because the Coriolis flow meter measures the mass flow rate of the fluid, the reading will not be affected by fluctuations in the fluid density. Furthermore, the absence of direct obstructions to flow makes the Coriolis flow meter a suitable choice for measuring the flow of corrosive fluids. Its limitations include a significant pressure drop and diminished accuracy in the presence of low-flow gases.
FREQUENCY
These flow meters use frequency and electronic signals to calculate the flow rate.
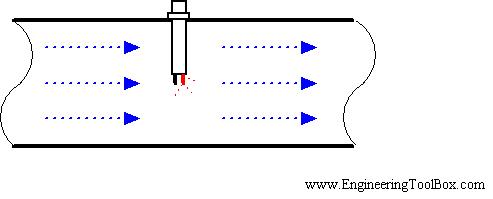
Vortex Shedding Flow Meter
A blunt, non-streamline body is placed in the stream of the flow through a pipe. When the flow stream hits the body, a series of alternating vortices are produced, which causes the fluid to swirl as it flows downstream. The number of vortices formed is directly proportional to the flow velocity and hence the flow rate. The vortices are detected downstream from the blunt body using an ultrasonic beam that is transmitted perpendicular to the direction of flow. As the vortices cross the beam, they alter the carrier wave as the signal is processed electronically, using a frequency-to-voltage circuit. The following diagram shows the basic principle of the vortex-shedding flow meter:
Vortex-shedding flow meters are best used in turbulent flow with a Reynolds number greater than 10,000. One advantage of using this type of flow meter is its insensitivity from temperature, pressure, and viscosity. The major disadvantage to using this method is the pressure drop caused by the flow obstruction.
Ultrasonic Flow Meters
There are two types of Ultrasonic meters, the transit time/time of flight and Doppler models, both of which have unique equations representing the principles behind them. The basis for these meters is monitoring ultrasonic waves in fluid passing through a pre-configured acoustic field. These meters are based on the technique of sound waves that change.
Transit Time/Time of Flight Flow Meters
Transit time meters have two opposing transducers outside of the pipe to measure the time of a signal sent from a transducer upstream to a transducer downstream and vice versa.
This allows the average velocity and hence the flow rate, \(Q\), to be determined.
\[Q=K\left(\frac{\pi d^{3} \tan \alpha}{8}\right)\left(\frac{1}{t_{U D}}-\frac{1}{t_{D U}}\right) \nonumber \]
where d is the diameter of the pipe, α is the angle between direction of the flow and the pipe, tUD is the time for the signal to reach downstream transducer from the upstream transducer, and tDU is the time for signal to reach upstream transducer from the downstream transducer.
With the Time of Flight Ultrasonic Flowmeter the time for the sound to travel between a transmitter and a receiver is measured. This method is not dependable on the particles in the fluid.
Two transmitters / receivers (transceivers) are located on each side of the pipe. The transmitters sends pulsating ultrasonic waves in a predefined frequency from one side to the other. The difference in frequency is proportional to the average fluid velocity.
Downstream pulse transmit time can be expressed as
\[t_d = \dfrac{L}{c + v \cos Φ} \nonumber \]
where \(t_d\) is the downstream pulse transmission time and \(L\) is the distance between transceivers.
Downstream pulse transmit time can be expressed as
\[t_u = \dfrac{L}{c - v \cos Φ} \nonumber \]
where \(t_u\) is the upstream pulse transmission time.
Since the sound travels faster downstream than upstream, the difference can be expressed as
\[t = \dfrac{t_d - t_u) t = \dfrac{ 2 v L \cos Φ}{c^2 - v^2 \cos 2Φ} t = \dfrac{2 v L \cos Φ}{c^2} \label{4} \]
(since \(v\) is very small compared to \(c\))
Doppler Meters
Doppler meters use the frequency shift of an ultrasonic signal when it is reflected by suspended particles or gas bubbles (discontinuities) in motion. The Doppler Effect Ultrasonic Flowmeter uses reflected ultrasonic sound to measure the fluid velocity. By measuring the frequency shift between the ultrasonic frequency source, the receiver, and the fluid carrier, the relative motion are measured. The resulting frequency shift is named the Doppler Effect.
These reflected signals travel at the velocity of light.
\[V_{;}=\frac{V_{s} \Delta f}{2 f_{\text {actual }} \cos \alpha} \nonumber \]
where \(f\) is the actual frequency and \(Δf\) is the change in frequency or frequency shift.
The fluid velocity can be expressed as
\[v = \dfrac{ c (f_r - f_t)}{2 ft \cos Φ} \nonumber \]
where
- \(f_r\) is the received frequency
- \(f_t\) is the transmission frequency
- \(v\) is the fluid flow velocity
- \(Φ\) is the relative angle between the transmitted ultrasonic beam and the fluid flow
- \(c\) is the velocity of sound in the fluid
This method requires that there are some reflecting particles in the fluid. The method is not suitable for clear liquids.
Advantages with the Doppler Effect Ultrasonic Flowmeter
Doppler meters may be used where other meters don't work. This could be in liquid slurries, aerated liquids or liquids with some small or large amount on suspended solids. The advantages can be summarized to:
Limitations with Doppler Effect Ultrasonic Flowmeters
Benefits with Ultrasonic Flowmeters As A Whole
- Doppler flowmeters performance are highly dependent on physical properties of the fluid, such as the sonic conductivity, particle density, and flow profile.
- Non uniformity of particle distribution in the pipe cross section may result in a incorrectly computed mean velocity. The flowmeter accuracy is sensitive to velocity profile variations and to the distribution of acoustic reflectors in the measurement section.
- Unlike other acoustic flowmeters, Doppler meters are affected by changes in the liquid's sonic velocity. As a result, the meter is also sensitive to changes in density and temperature. These problems make Doppler flowmeters unsuitable for highly accurate measurement applications.
- Obstruction less flow
- Pressure drop equal to an equivalent length of straight pipe
- Unaffected by changes in temperature, density or viscosity
- Bi-directional flow capability
- Low flow cutoff
- Corrosion-resistant
Both meters are effective in measuring open channels and partially filled pipes but are very sensitive to flow conditions and hence should be calibrated with care. Also, there is no pressure drop since there are no obstructions in the flow path.
OTHER TYPES
Magnetic Flow Meter
One magnetic model flow meter positions electric coils around the pipe of the flow to be measured. A pair of electrodes is set up across the pipe wall. The fluid flowing has a minimum value of electrical conductivity, the movement of the fluid through the pipe acts as a conductor moving across the magnetic field. There is an induced change in voltage between the electrodes, which is proportional to the flow velocity.
The flow velocity is found by measuring the changes of induced voltage of the conductive fluid passing through a controlled magnetic field at right angles. According to Faraday’s Law, the magnitude of the voltage induced is directly proportional to the product of the magnetic flux, distance between probes and the velocity of the medium (fluid).
\[E=-N \frac{d \phi}{d t}=-N B \frac{d A}{d t}=-N B D \frac{d z}{d t}=-N B D v \nonumber \]
where \(E\) is the voltage of induced current, \(N\) is the number of turns, \(B\) is the external magnetic field, \(φ\) is the magnetic flux, \(D\) is the distance between electrodes and \(v\) is the velocity of the fluid.
Some of the advantages are minimum pressure drop because of minimum obstructions in flow path; low maintenance cost because of no moving parts. One of the disadvantages is that it usually requires a fluid with an electrical conductivity of higher than 3 µS/cm.
Calorimetric Flow Meter
This type of flow meter is suitable for monitoring the flow rates of liquid and gaseous mediums. The calorimetric principle is based on two temperature sensors in close quarters of one another but thermally insulated from one another.
One of the two temperature sensors is constantly heated and the cooling effect of the flowing fluid is used to monitor the flow rate. In a stationary phase fluid condition there is a constant temperature difference between the two temperature sensors. When the fluid flow increases, heat energy is extracted from the heated sensor and the temperature difference between the sensors are reduced. The reduction is proportional to the flow rate of the fluid. The calorimetric flow meter can achieve relatively high accuracy at low flow rates.
Common applications: air compression, argon compression, nitrogen compression, carbon dioxide compression and flow detection of all fluids ( liquids and gases)
Gear Flow Meter
This type of flow meter has oval shaped gears with fitting teeth which control the amount of fluid passing through. The flow rate is calculated by number of times the gears are filled and emptied. These meters have high accuracy and are used for measuring low flow and for high viscosity fluids. It is very easy to install these types of meters because it requires no pipe.
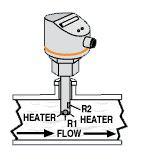
Thermal Flow meters
These flow meters take advantage of the thermal properties of the fluid to measure the flow of the fluid in a pipe. In most thermal flow meters, a measured amount of heat is applied to the heater of the sensor. Portions of this heat is lost to the fluid as it flows. Accordingly, as the fluid flow increases more heat is lost. The amount of heat lost is tracked using a temperature measurement instrument in the sensor. Then an electronic transmitter uses the heat input and temperature measurements to calculate the fluid flow, taking into account the thermal properties of the fluid.
Common applications of thermal flow meters are measuring the flow rate of clean gases like air, nitrogen, hydrogen, helium, ammonia, and argon. Most thermal flow meters are used to measure pure gases that would be used in laboratory experiments or semiconductor production. Mixtures like flue stack flow can also be measured but the mixture compositions must be known to use the appropriate thermal properties of each component in the mixture. The key advantage of this technology is its dependence on the thermal properties which are mostly independent of the gas density.
However caution should be taken if this type of flow meter is used to measure a fluid of unknown or varying composition. Additionally, thermal flow meters should not be used to measure abrasive fluids because they may damage the sensor. Some fluids can coat the sensor causing it to be inoperable and must be regularly cleaned to be useful.
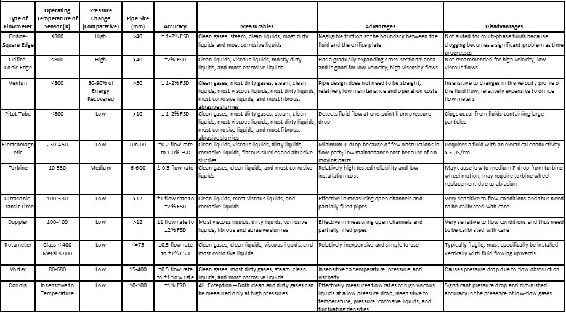
Table of Flow Meters
The following table outlines specifics for most of the flow meters. This may be helpful in answering example 1. Accuracy is given in terms of FSD (full scale deflection) which is the deflection of meter's pointer to the farthest point on the scale. This implies the highest measurement.
Flow Profile Distortion
In the real world, the flow profile is not always symmetrical. Pipe fittings such as elbows, tee-pieces, and reducers can change the flow profile. One example of a fitting that alternates the flow profile is a sharp elbow which causes pure swirls throughout the fluid. Some flow meters are more sensitive to particular types of flow distortion. More complex flow conditions produce better velocity profile but there is a trade off since they are more expensive and give higher pressure drops.
Turndown Ratio
The turndown ratio is a term used to describe the range of accurate operability of a specific flow meter. This rangeability is critical when selecting flow meters for specific applications. Typically, in a plant setting gas flow may not be constant, but accurate measurement of gas flow is needed ranging from no flow to full flow.
For example if nitrogen gas is being used in a plant conducting multiple batch reactions, sometimes the little nitrogen (100 m3/min) will be needed and other times full nitrogen flow (1000 m3/min) will be needed. For this system, the turndown ratio is 10:1. Accordingly, a flow meter must have a turndown ratio of at least 10:1.
For each type of flow meter, the turndown ratio is limited by the theoretical and physical constraints. For example, for an orifice meter the accuracy may be compromised near the limits of the rangeability. Orifice meters create a pressure drop in the measured fluid which is proportional to the velocity squared. If the range of differential pressures becomes too large the overall accuracy of the flow meter at its range limits may be inconsistent.
Turndown ratio can be expressed as:
\[TR = qmax / qmin \label{1} \]
where
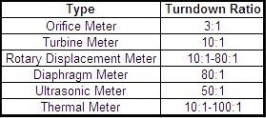
The table below shows a list of typical turndown ratios for different flow meters.
Example - Turndown Ratio for an Orifice Meter
The turndown ratio - TR - for an orifice meter with maximum flow of 12 kg/s and a minimum flow of 3 kg/s can be calculated as:
TR = (12 kg/s) / (3 kg/s) = 4 - normally expressed as turndown ratio of 4:1
This is a typical turndown ratio for a orifice plate. In general a orifice plates has turndown ratio between 3:1 and 5:1.
Turndown Ratio and Measured Signal 
The graph above shows how the turndown ratio effects the measured signal % and flowmeter %. With an increased turndown ratio there is a larger range that the flowmeters can operate within. In a flow meter based on the orifice or venturi principle, the differential pressure upstream and downstream of an obstruction in the flow is used to indicate the flow. According the Bernoulli Equation the differential pressure increases with the square of flow velocity. A large turndown ratio will cramp the measurement signal at low flow rate and this is why venturi and orifice meters are not accurate at low flowrates.
a) Oil is flowing in a medium sized pipe which is insensitive to temperature and pressure. Pressure drop measured is relatively low. Which type of flow meter is recommended?
Coriolis flow meter because it effectively measures flow rates of high viscous liquids at a low pressure drop. Coriolis flow meters are also insensitive to temperature and pressure.
(b) Why is Doppler only recommended for liquids containing suspended solids or gases?
The Doppler sensor transmits sound into the flow stream, which must be reflected back to the sensor to indicate flow velocity. Gas bubbles or suspended solids act as reflectors for the Doppler signal. Doppler flow meters are recommended for liquids containing solids or bubbles with a minimum size of 100 microns and a minimum concentration of 100 ppm.
(c) When would you use Vortex flow meters?
Vortex is mainly used to measure steam flow rates. They are also used to measure gases and liquids with low viscosity that contains hardly any solids.
(d) A conductive liquid is flowing in a pipe (1000 mm size) at the temperature of 430K. Which type of flow meter is recommended to measure the flow rate?
Electromagnetic flow meter is used in this case as it measures flow rates of conductive liquids.
Kerosene at 20 deg C flows at 18 m3 / h in a 5 cm diameter pipe. If a 2 cm diameter thin plate orifice with corner taps is installed, what will the measured drop be in Pa? Why is orifice meter used in this case?
Data given: Cd=0.6030; μ = 192E-3 kg/ (m s) for kerosene; ρ = 804 kg/m^3
Solution
Orifice meter is used in this case because Kerosene is a clean and non viscous liquid.
Usually, pipe velocity is calculated using the velocity formula to calculate Re and Cd values. The pipe velocity is:
\[v=\frac{Q}{A}=\frac{\left(\frac{18}{3600}\right)}{\left(\frac{\pi}{4}\left(0.05^{2}\right)\right.}=2.55 \mathrm{m} / \mathrm{s} \nonumber \]
In this case, we already have the Cd. So,using orifice pressure drop formula, calculate
\[Q=\frac{18}{3600}=0.6030 \frac{(2 \pi)(0.02)^{2}}{\sqrt{1-\frac{(0.04)^{2}}{(0.02)^{2}}}} \sqrt{\frac{2 \Delta p}{804}}=0.005 m^{3} / h \nonumber \]
Final step is to solve for Δp to give 273 kPa.
\[\Delta p=\frac{(0.005)^{2} *\left(1-\frac{(0.04)^{2}}{(0.02)^{2}}\right)(804)}{(0.6030)^{2}(2 \pi)^{2}(0.02)^{4}(2)}=273 k P a \nonumber \]
Sage's Corner
References
Contributors and Attributions
- TR = Turndown Ratio
- qmax = maximum flow
- qmin = minimum flow
- Cole-Palmer Catalog, 2005-2006
- [5]Engineering fundamentals' website
- Perry, Robert H., Perry's Chemical Engineers' Handbook, 7th Edition. McGraw-Hill, 1997.
- Richardson, J.F. and Peacock, D.G., Chemical Engineering, 3rd Edition, Volume 3. Butterworth- Heinemann, 1994.
- [6]Process Measurement and control Products
- [7]Universal Flowmeters Presents Flowmeters.com
- [8]Transactions Volume 4: Flow and Level Measurement
- [9] Wikipedia entry on Coriolis Mass Flowmeters
- [10]Omega Literature: Flow and Level Measurement
- Geankoplis, Christie John, Transport Processes and Separation Process Principles, 4th Edition, Pearson Education, 2003.
- McKetta, John J., Cunningham, William A., Encyclopedia of Chemical Processing and Design: Volume 43 - Process Control: Feedback Simulation to Process Optimization, CRC Press, 1993.
- Authors: (September 14, 2006) Ashwini Miryala, Kyle Scarlett, Zachary Zell, Brandon Kountz
- Stewards: (September 5, 2007) Jeremy Goldfarb, Daniel McClure, Lilian Ngobi, Daniel Wheeler