5.8: Experiments in Dry Sand
- Page ID
- 33735
5.8.1. Hatamura&Chijiiwa(1977B)
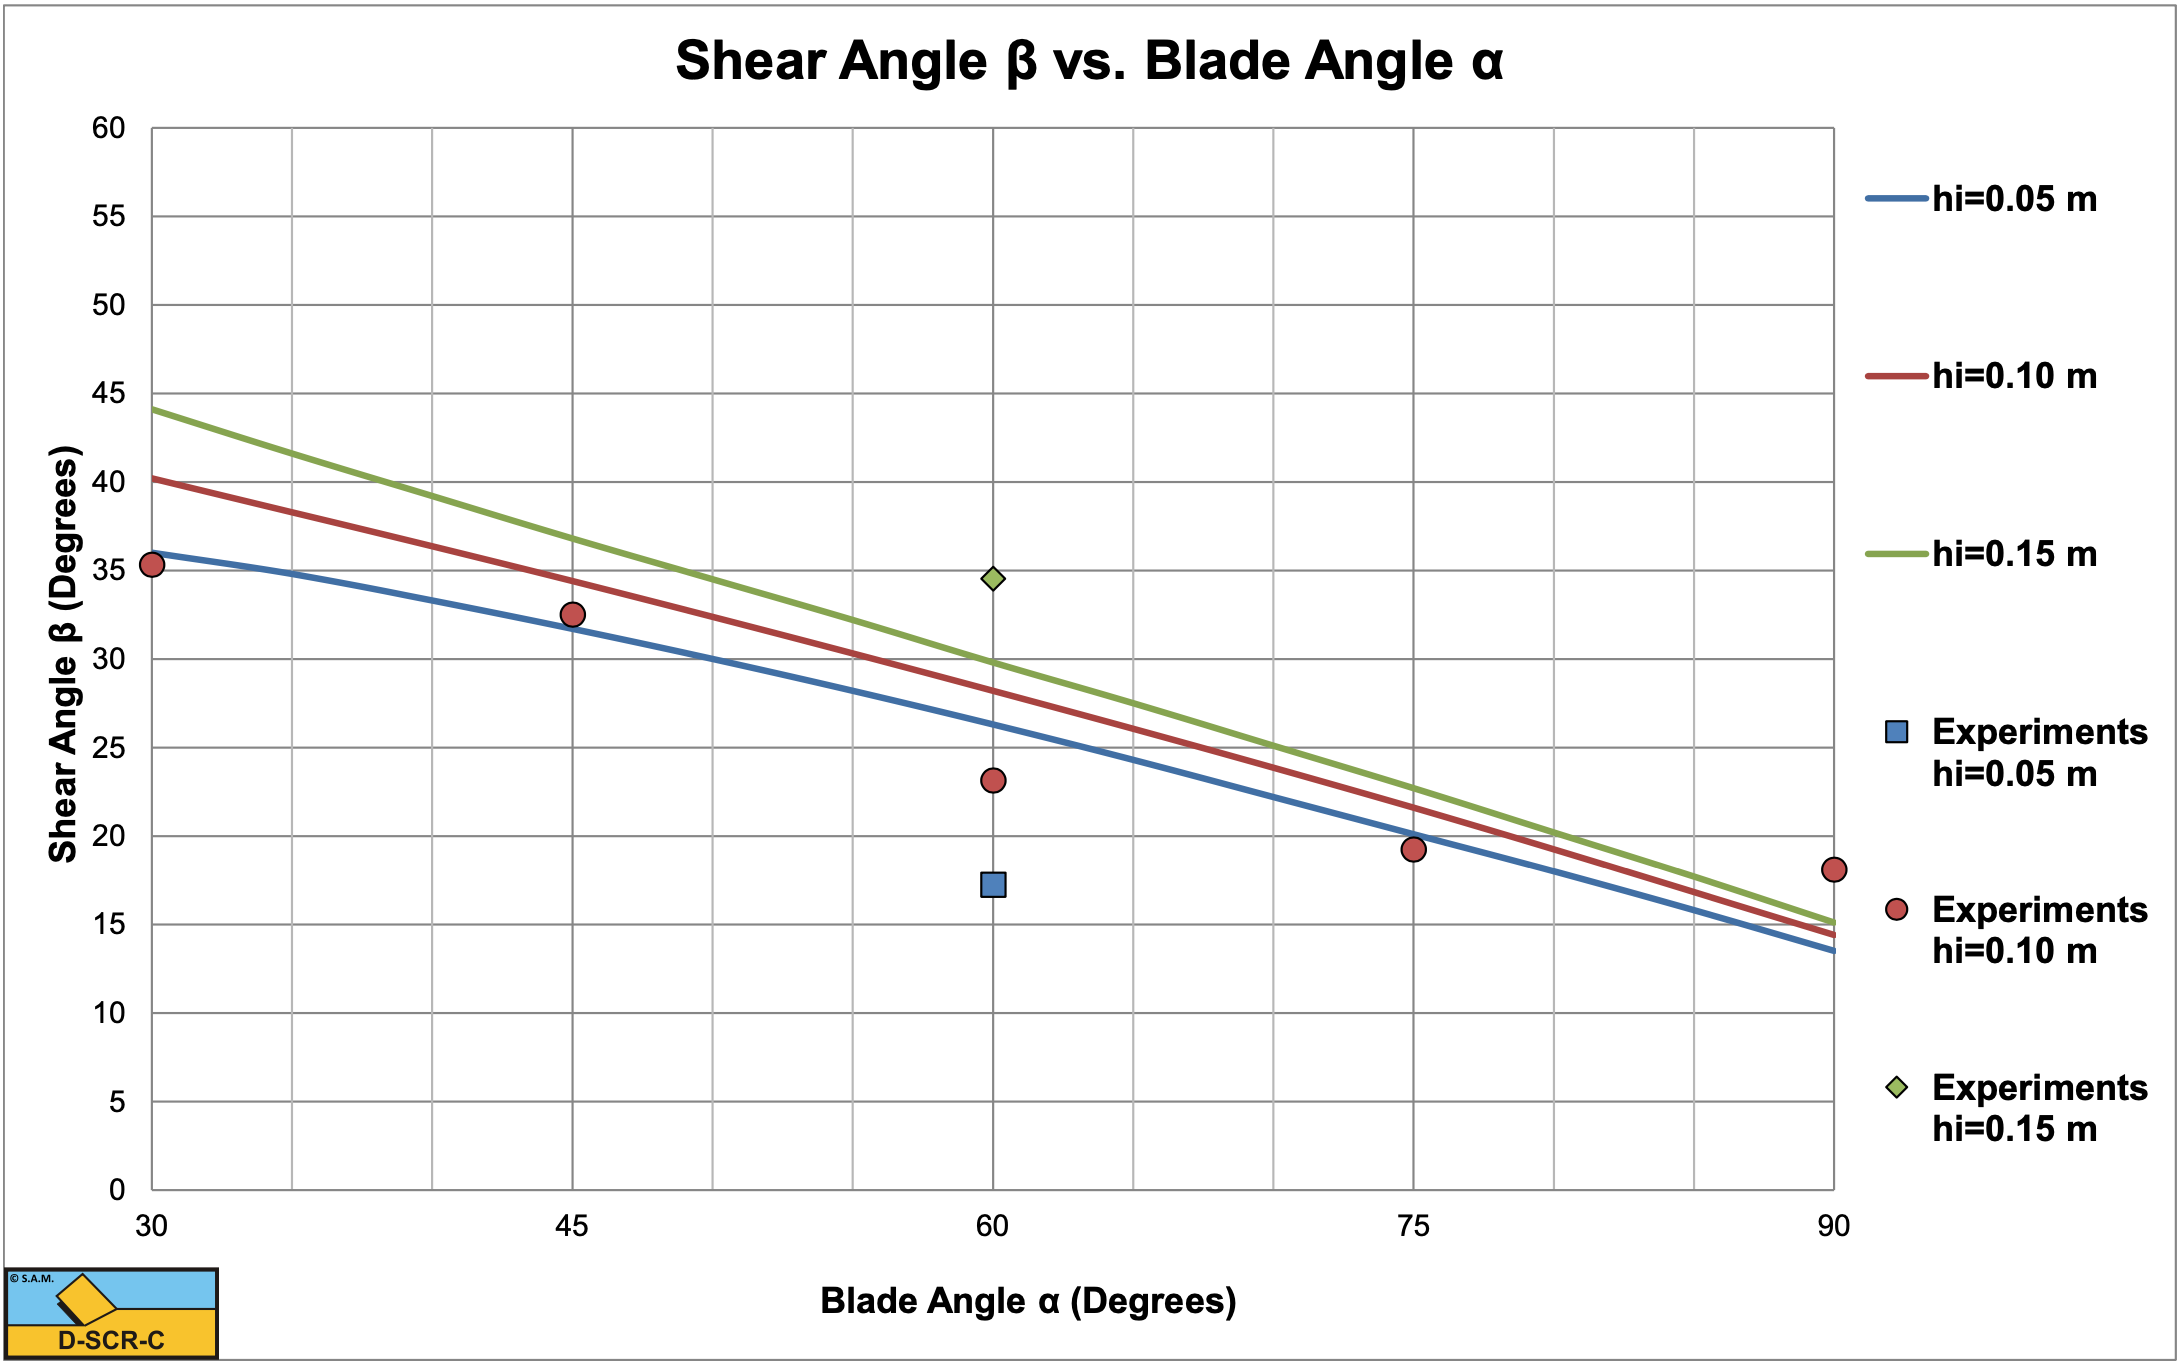
Hatamura & Chijiiwa (1977B) carried out very good and extensive research into the cutting of sand, clay and loam. They did not only measure the cutting forces, but also the stresses on the blade, the shear angles and velocity distributions in the sand cut. For their experiments they used a blade with a width of w=0.33 m, a length of L=0.2 m, blade angles of α=30°, 45°, 60°, 75° and 90°, layer thicknesses of hi=0.05 m, 0.10 m and 0.15 m and cutting velocities of vc=0.05 m/sec, 0.10 m/sec and 0.14 m/sec. The sand they used had an internal friction angle φ=38° and an external friction angle δ=26.6° (almost 2/3·φ). The dry density of the sand was ρs=1.46 ton/m3.
Figure 5-19 shows the shear angles measured versus the shear angles calculated with the current model based on the minimum cutting energy criterion. In general there is a good match, especially for the experiments with a layer thickness of 0.1 m. For the experiments with a layer thickness of 0.05 m the theory overestimates the experimental value while for the layer thickness of 0.15 m, the theory underestimates the experimental value. Now the number of experiments is very limited and more experiments are required to get a better validation.
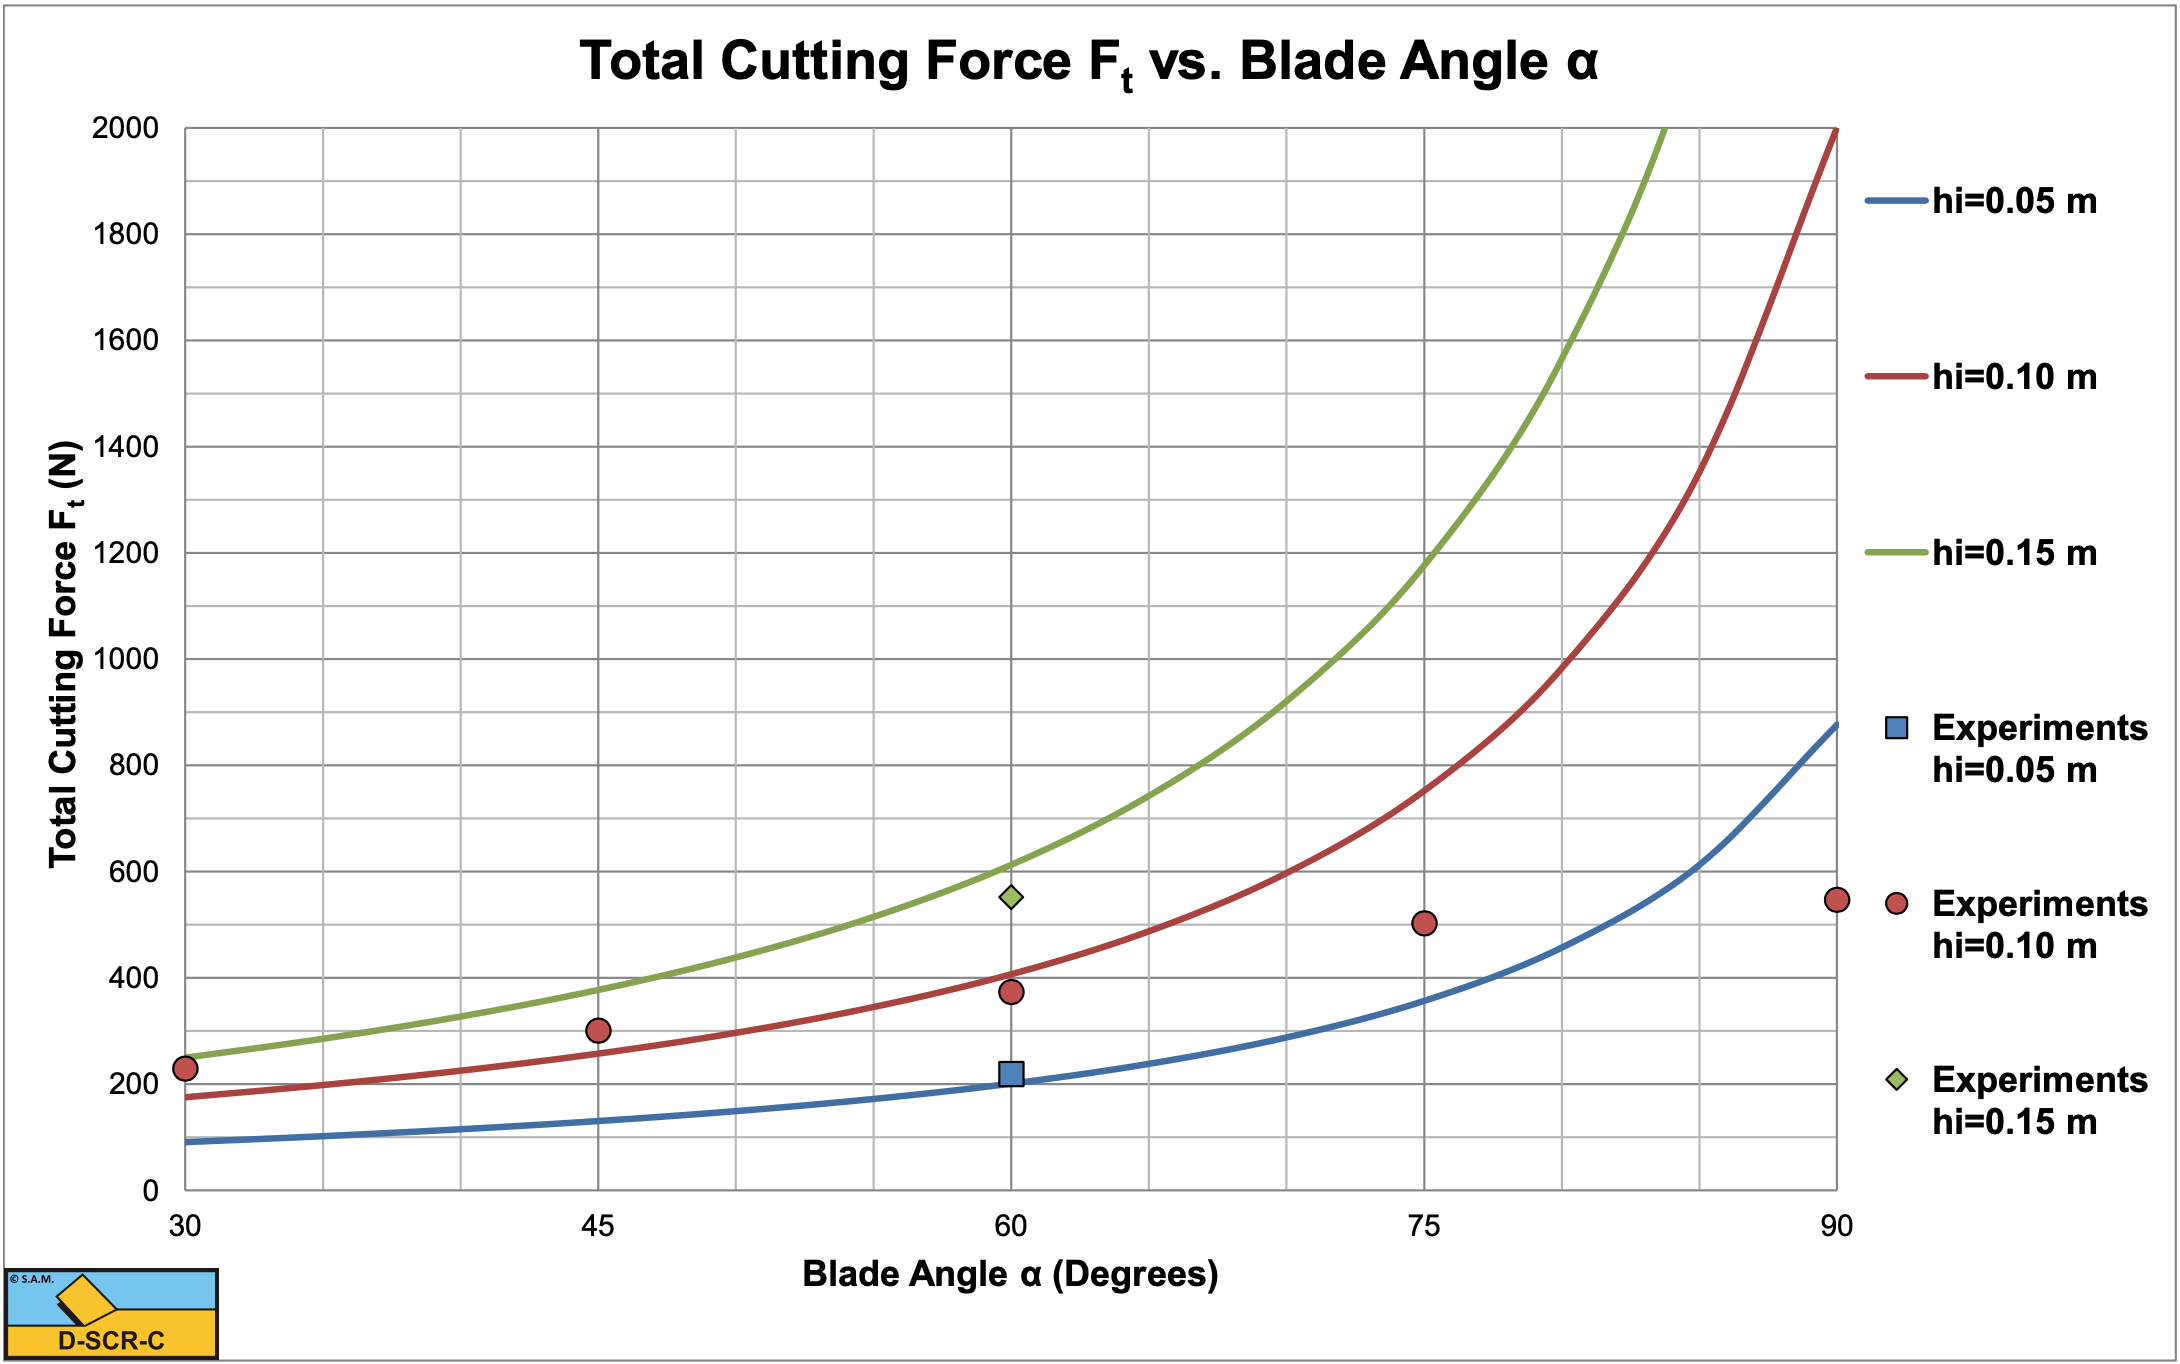
Figure 5-20 shows the total cutting force measured versus the total cutting force calculated. The total cutting force is the vectorial sum of the horizontal and the vertical cutting force. Hatamura & Chijiiwa (1977B) did not give the horizontal and vertical cutting forces, but the total cutting force and the direction of this force. For blade angles up to 60° there is a good match between experiments and theory. However at larger blade angles the theory overestimates the total cutting force strongly. This is most probably caused by the occurrence of a wedge in front of the blade at large blade angles. The occurrence of a wedge will strongly reduce the cutting forces in that case. See also Chapter 11: A Wedge in Dry Sand Cutting.
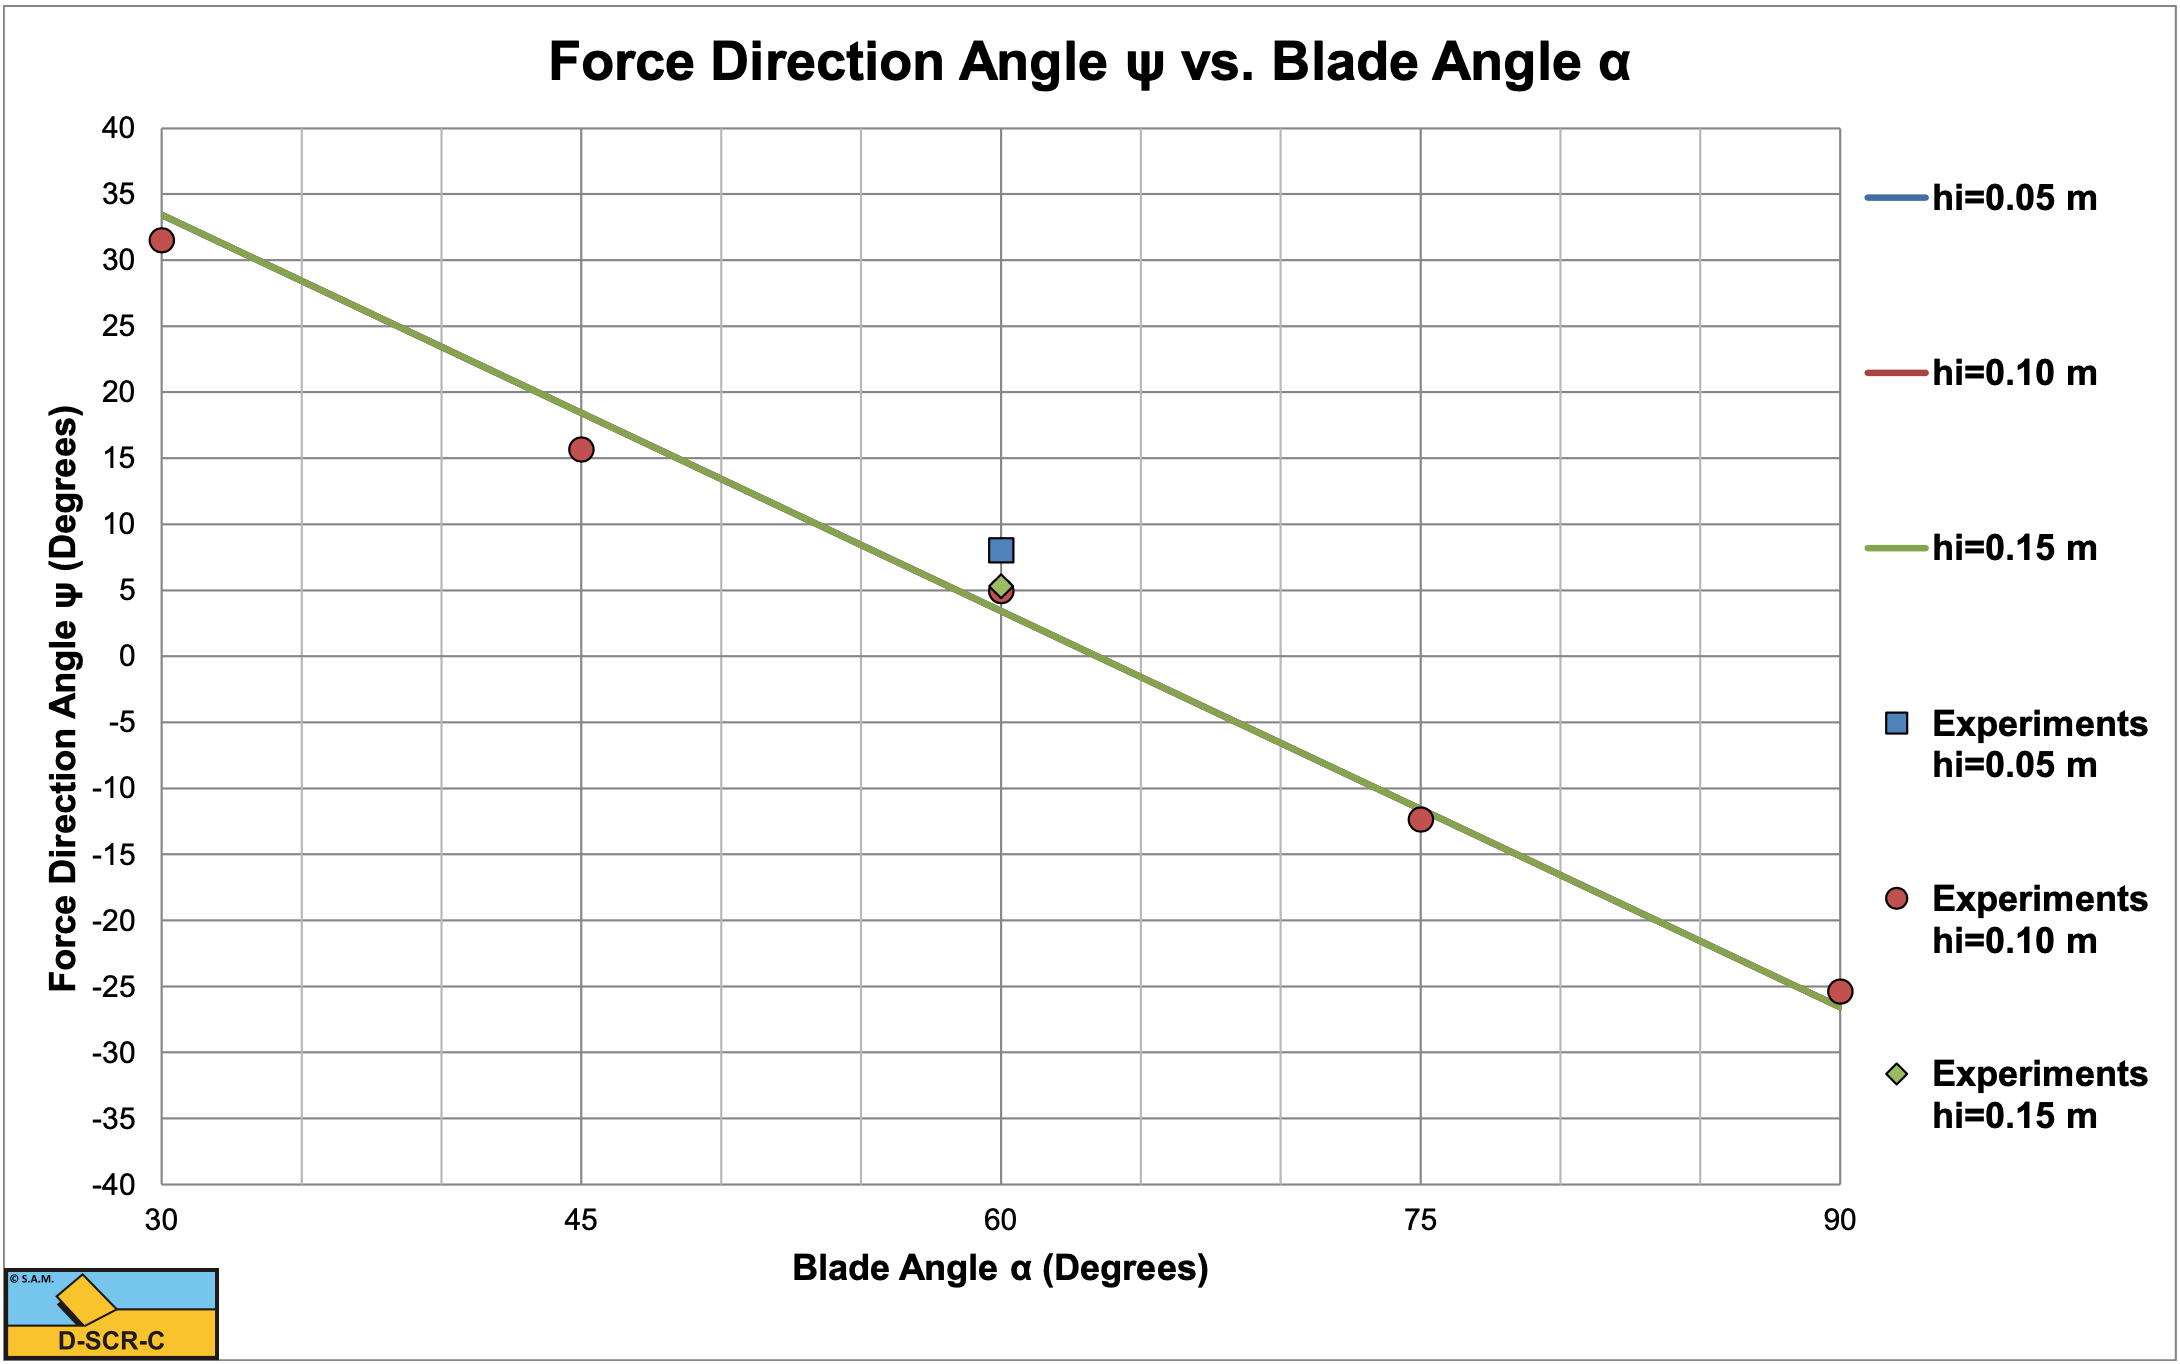
Figure 5-21 shows the direction of the total cutting force, measured versus calculated. There is an almost perfect match, also for the large blade angles where the forces are overestimated.
The conclusion is that the model developed here matches the experiments well for small blade angles, both in magnitude and direction, for large blade angles the wedge theory has to be applied. Hatamura & Chijiiwa (1977B) also carried out some tests with different cutting velocities, but the velocities were so small that there was hardly any inertial effect.
5.8.2. Wismer & Luth (1972B)
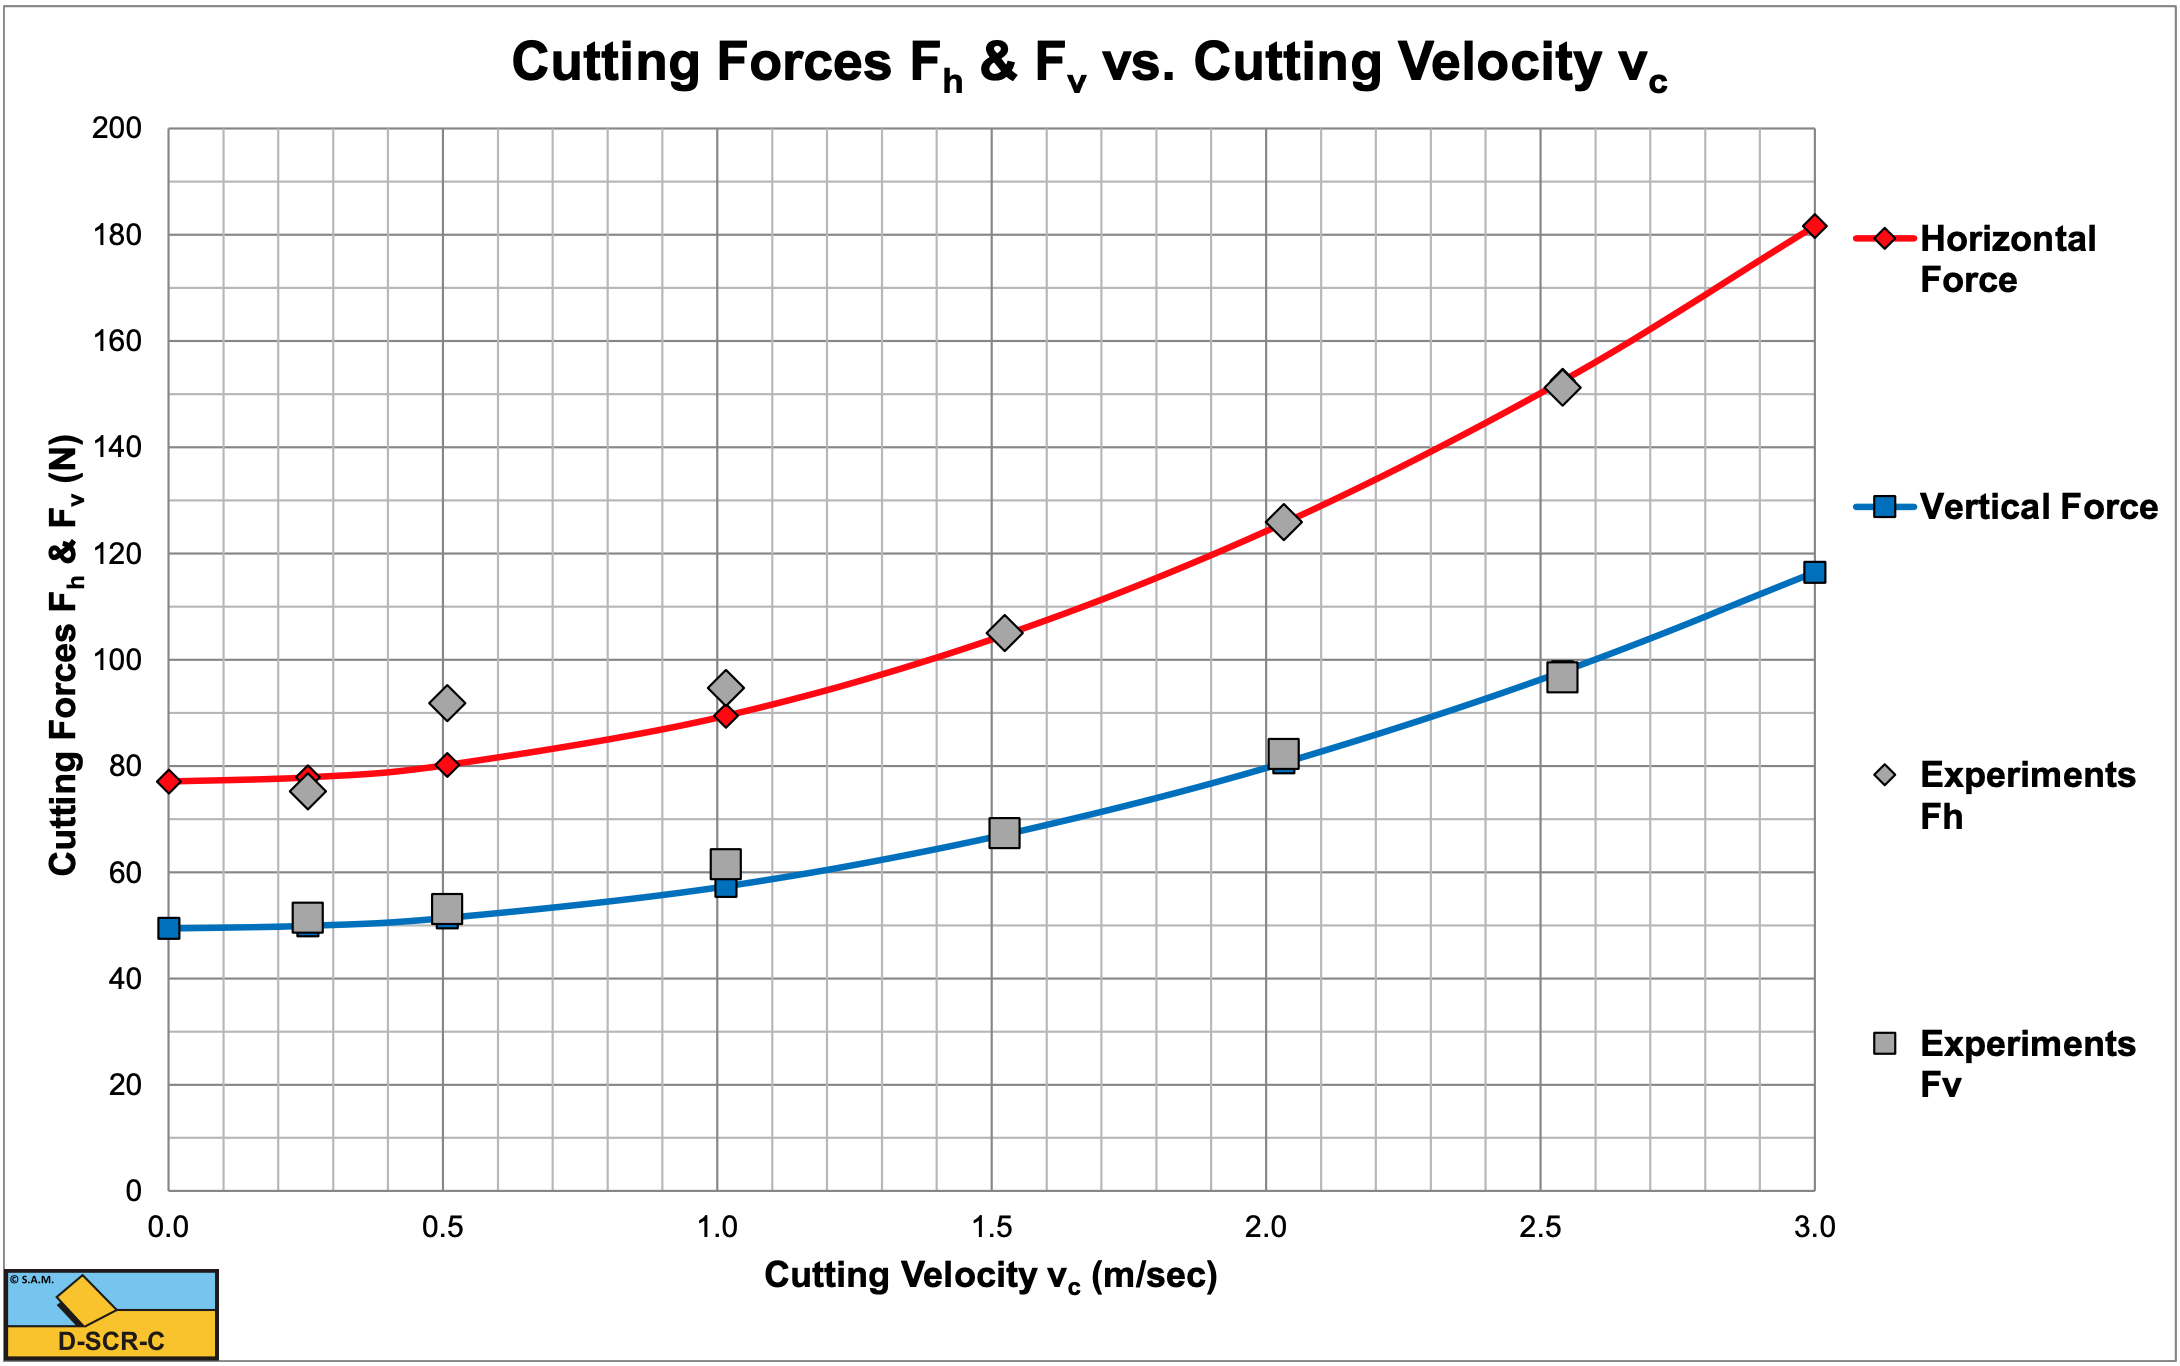
Wismer & Luth (1972B) investigated rate effects in soil cutting in dry sand, clay and loam. They found that in dry quarts sand the cutting forces consist of two components, a static component and a dynamic component. The static component depends on the cutting geometry, like the blade angle and the blade height. The static component also depends on the layer thickness and the soil mechanical parameters, in this case the dry soil density, the internal friction angle and the external friction angle. The dynamic component also depends on the cutting geometry and the soil mechanical properties, but also on the cutting velocity squared. In fact their findings match equations (5-6), (5-7), (5-9) and (5-10), but they use a different formulation for equation (5-8) or (5-15), the cross section of the layer cut. One of the reasons for the latter is that they use a fixed shear angle of β=45-φ/2 resulting in a different weight of the soil cut compared with the theory described here. In the current theory the shear angle depends on the geometry, the operational parameters and the soil mechanical parameters. The test carried out by Wismer & Luth (1972B) were with an α=30° blade with a blade height hb=0.0969 m and a width of w=0.1262 m. The layer thickness was hi=0.098 m. In order to validate the rate effect, first they calibrated the soil mechanical properties, so the cutting forces at zero cutting velocity would match the experiments. This requires an internal friction angle φ=41° and an external friction angle δ=27.3° (δ=2/3·φ), to have the correct ratio between the horizontal and the vertical force. Further, the theoretical cutting forces have to be multiplied by a factor 1.23 in order to match quantitatively. This may be the result of 3D side effects, since the blade used was not very wide compared to the layer thickness and/or the cross section of the layer cut was larger than the here assumed cross section. Both explanations seem to be reasonable. After applying these corrections and calibrations, the cutting forces are determined and plotted in Figure 5-22. The correlation between the theoretical lines and the measured data points is remarkable, resulting in the conclusion that the approach of Wismer & Luth (1972B) to quantify the rate effects for dry sand is a good approach.
Wismer & Luth (1972B) used a fixed shear angle of β=45-φ/2 resulting in β=24.5°. The values found here, based on the minimum energy principle range from β=38.8° at zero cutting velocity to β=32.2° at a cutting velocity vc=3 m/sec, taking into account the effect of the inertial forces on the shear angle.