
9.1: Introduction
- Page ID
- 29471

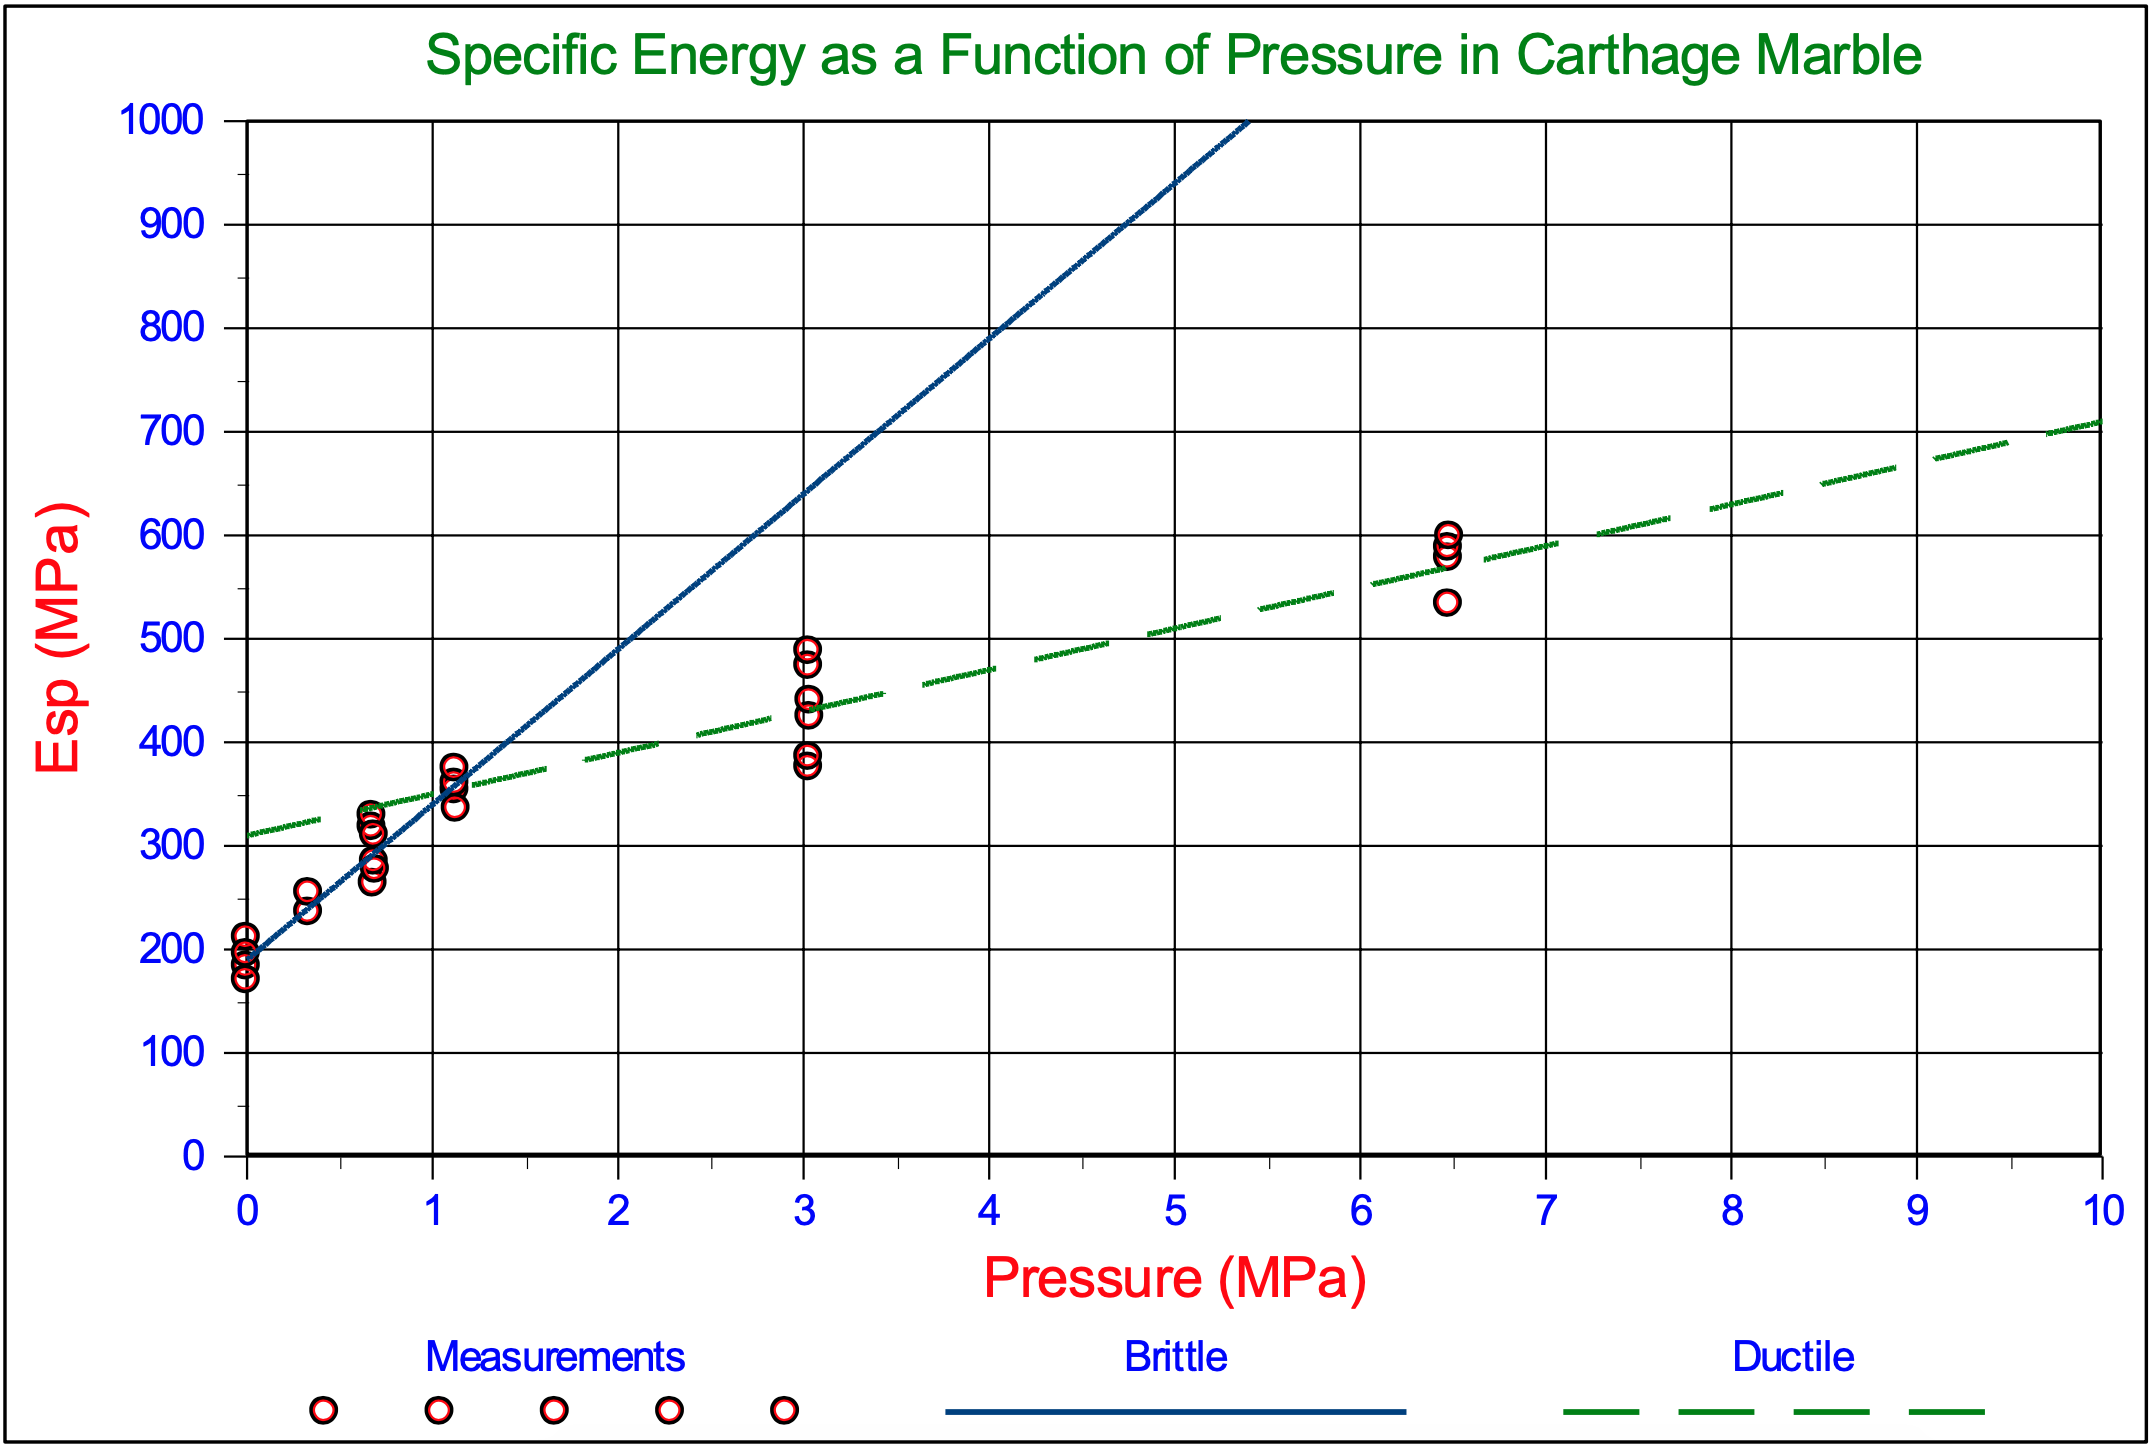
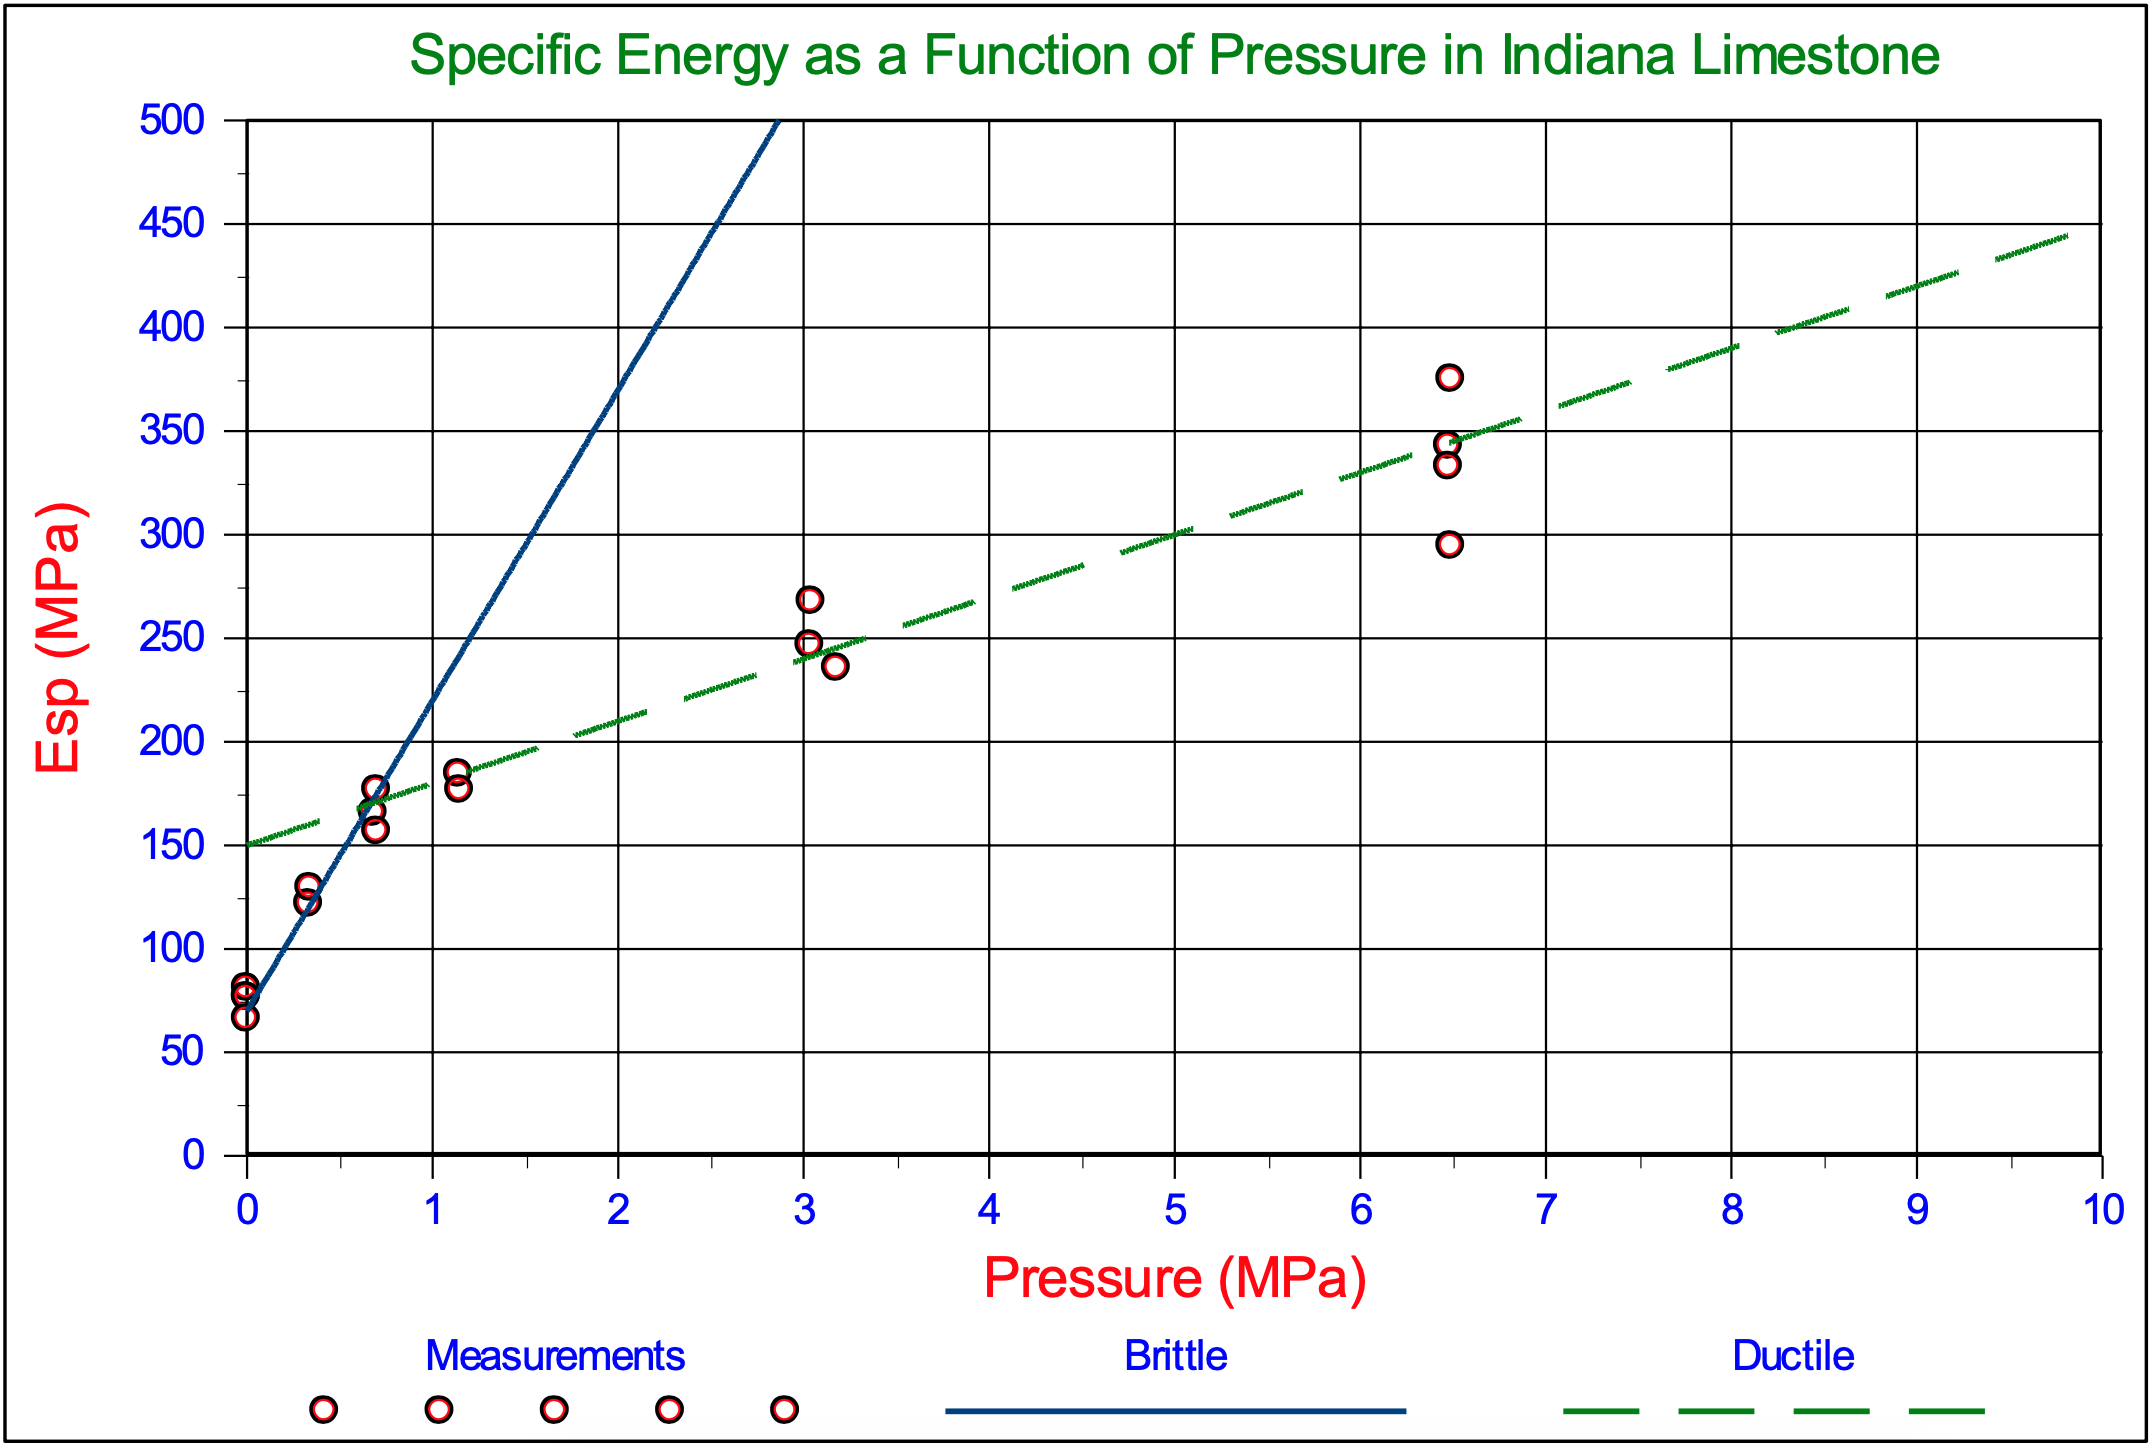
For rock cutting in dredging and mining under hyperbaric conditions not much is known yet. The data available are from drilling experiments under very high pressures (Zijsling (1987), Kaitkay and Lei (2005) and Rafatian et al. (2009)). The main difference between dredging and mining applications on one side and drilling experiments on the other side is that in dredging and mining the thickness of the layer cut is relatively big, like 5-10 cm, while in drilling the process is more like scraping with a thickness less than a mm. From the drilling experiments it is known that under high pressures there is a transition from a brittle-shear cutting process to a ductile-flow cutting process. Figure 9-2 and Figure 9-3 from Rafatian et al. (2009) show clearly that with increasing confining pressure, first the specific energy Esp increases with a steep curve, which is the transition brittle-ductile, after which the curve for ductile failure is reached which is less steep. The transition is completed at 690 kPa-1100 kPa, matching a water depth of 69-110 m.
The Carthage Marble has a UCS value of about 100 MPa and the Indiana Limestone a UCS value of 48 MPa. The cutter had a blade angle α of 110o. Figure 9-29 shows the specific energy (according to the theory as developed in this chapter) as a function of the UCS value and the confining pressure (water depth). For the Carthage Marble a specific energy of about 400 MPa is found under atmospheric conditions for the ductile cutting process. For the brittle shear process 25%-50% of this value should be chosen, matching Figure 9-2 at 0 MPa. For a water depth of 65 m, matching 0.65 MPa the graph gives about 500 MPa specific energy, which is a bit lower than the measurements. For the Indiana Limestone a specific energy of about 200 MPa is found under atmospheric conditions for the ductile cutting process. Also here, for the brittle shear process, 25%-50% of this value should be chosen, matching Figure 9-3 at 0 MPa confining pressure. For a water depth of 65 m, matching 0.65 MPa the graph gives about 280 MPa specific energy, which is a bit lower than the measurements.
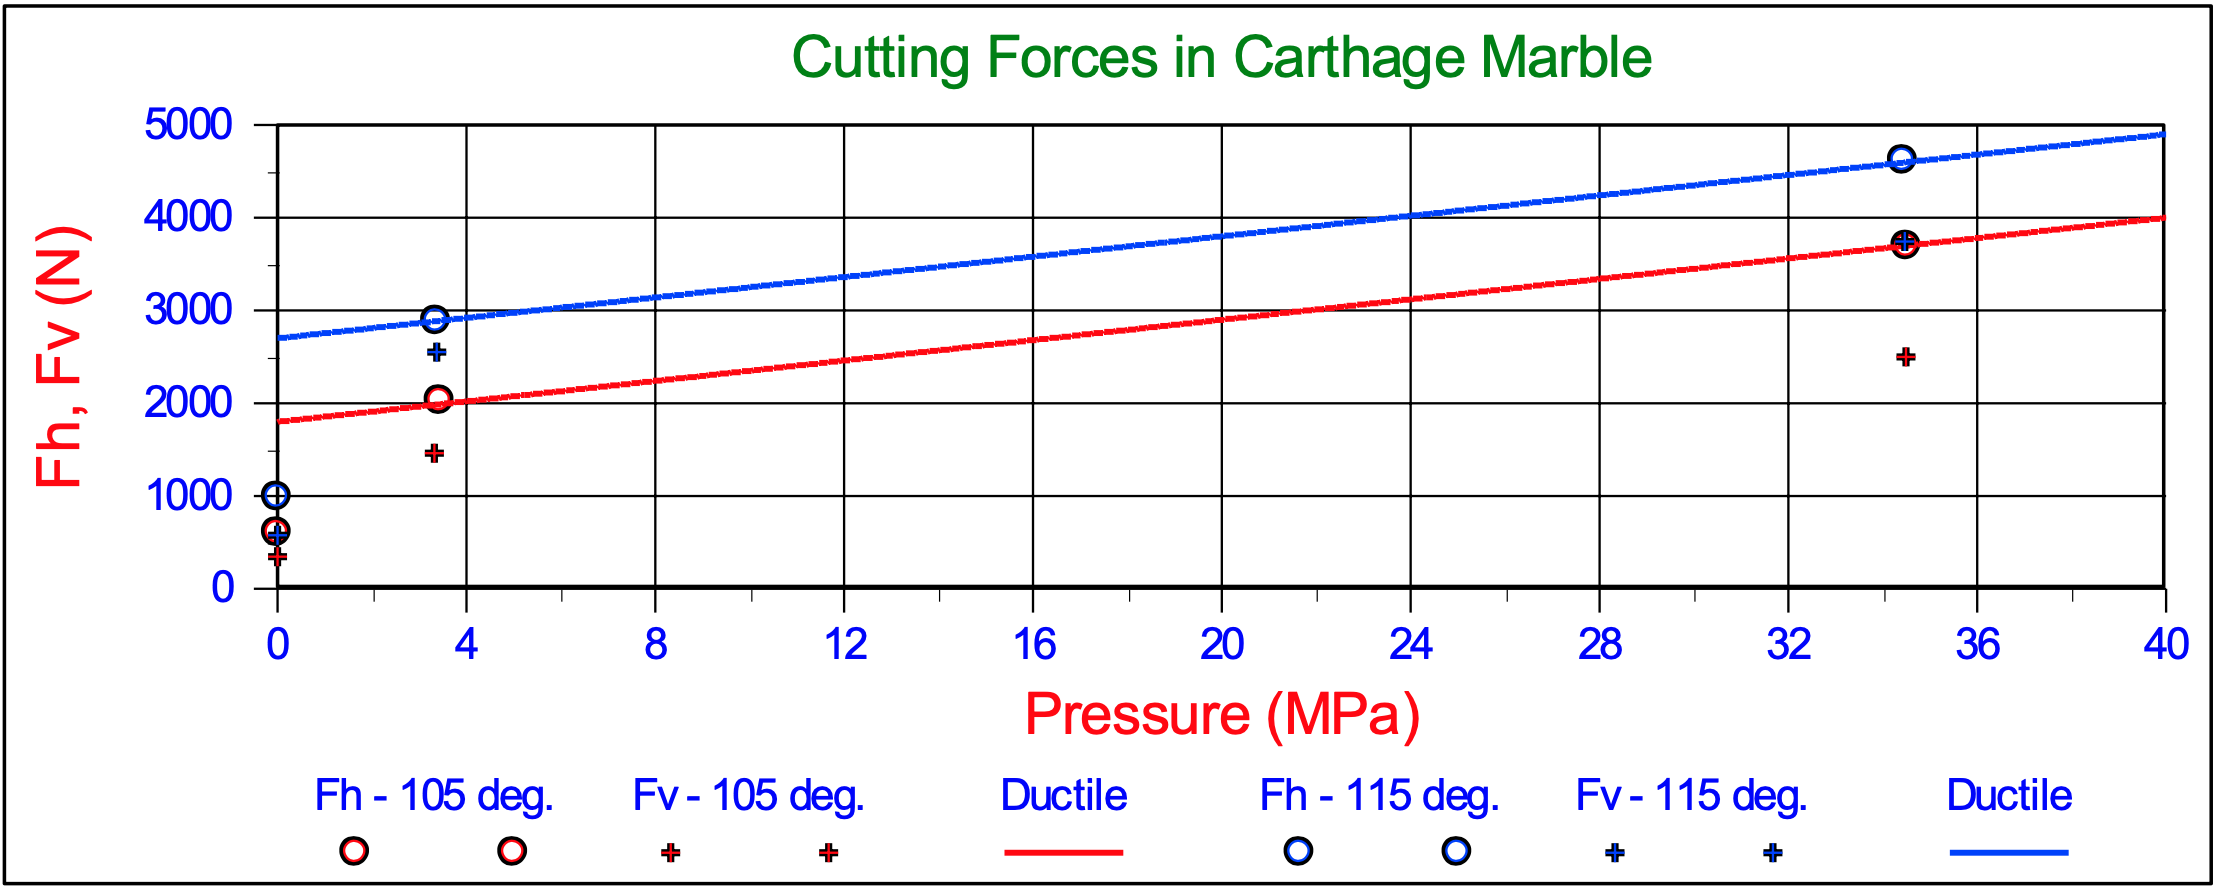
For deep sea mining applications this is still shallow water. Both graphs show an increase of the Esp by a factor 2-2.5 during the transition brittle-shear to ductile-flow, which matches a reduction factor of 0.25-0.5 for the average versus the maximum cutting forces as mentioned before. Figure 9-22 and Figure 9-23 show the results of Zijsling (1987) in Mancos Shale and Figure 9-1 shows the results of Kaitkay & Lei (2005) in Carthage Marble.
The experiments of Kaitkay & Lei (2005) also show that the transition from brittle-shear to ductile-flow takes place in the first few hundreds of meters of water depth (from 0 to about 2.5 MPa). They also show a multiplication factor of about 3 during this transition. The experiments of Zijsling (1987) are not really suitable for determining the transition brittle-shear to ductile-flow because there are only measurements at 0 MPa and about 10 MPa, so they do not show when the transition is completed, but they do show the increase in forces and Esp.
The explanation for the transition from brittle-shear to ductile-flow is, according to Zijsling (1987), the dilatation due to shear stress in the shear plane resulting in pore under pressures, similar to the cutting process in water saturated sand as has been described by Miedema (1987 September). Zijsling however did not give any mathematical model. Detournay & Atkinson (2000) use the same explanation and use the Merchant (1944) model (equations (8-109) and (8-110) for the flow type cutting process) to quantify the cutting forces and specific energy by adding the pore pressures to the basic equations:
\[\ \mathrm{F_{h}=\frac{2 \cdot h_{i} \cdot w \cdot \cos (\varphi) \cdot \sin (\alpha+\delta)}{1+\cos (\alpha+\delta+\varphi)} \cdot\left(c+p_{1 m} \cdot \tan (\varphi)\right)}\tag{9-1}\]
The difference between the bottom hole pressure (or hydrostatic pressure) and the average pressure p1m in the shear plane has to be added to the effective stress between the particles in the shear plane A-B. Multiplying this with the tangent of the internal friction angle gives the additional shear stress in the shear plane A-B, see Figure 9-4.
So in the vision of Detournay & Atkinson (2000) the effect of pore water under pressures p1m is like an apparent additional cohesion. Based on this they find a value of the external friction angle which is almost equal to the internal friction angle of 23o for the experiments of Zijsling (1987). Detournay & Atkinson (2000) however forgot that, if there is a very large pore water under pressure in the shear plane, this pore water under pressure has not disappeared when the layer cut moves over the blade or cutter. There will also be a very large pore water under pressures on the blade as has been explained by Miedema (1987 September) for water saturated sand in dredging applications. In the next paragraph this will be explained.