12.8: Experiments
- Page ID
- 35013
Sand cutting tests have been carried out in the Laboratory of Dredging Engineering at the Delft University.
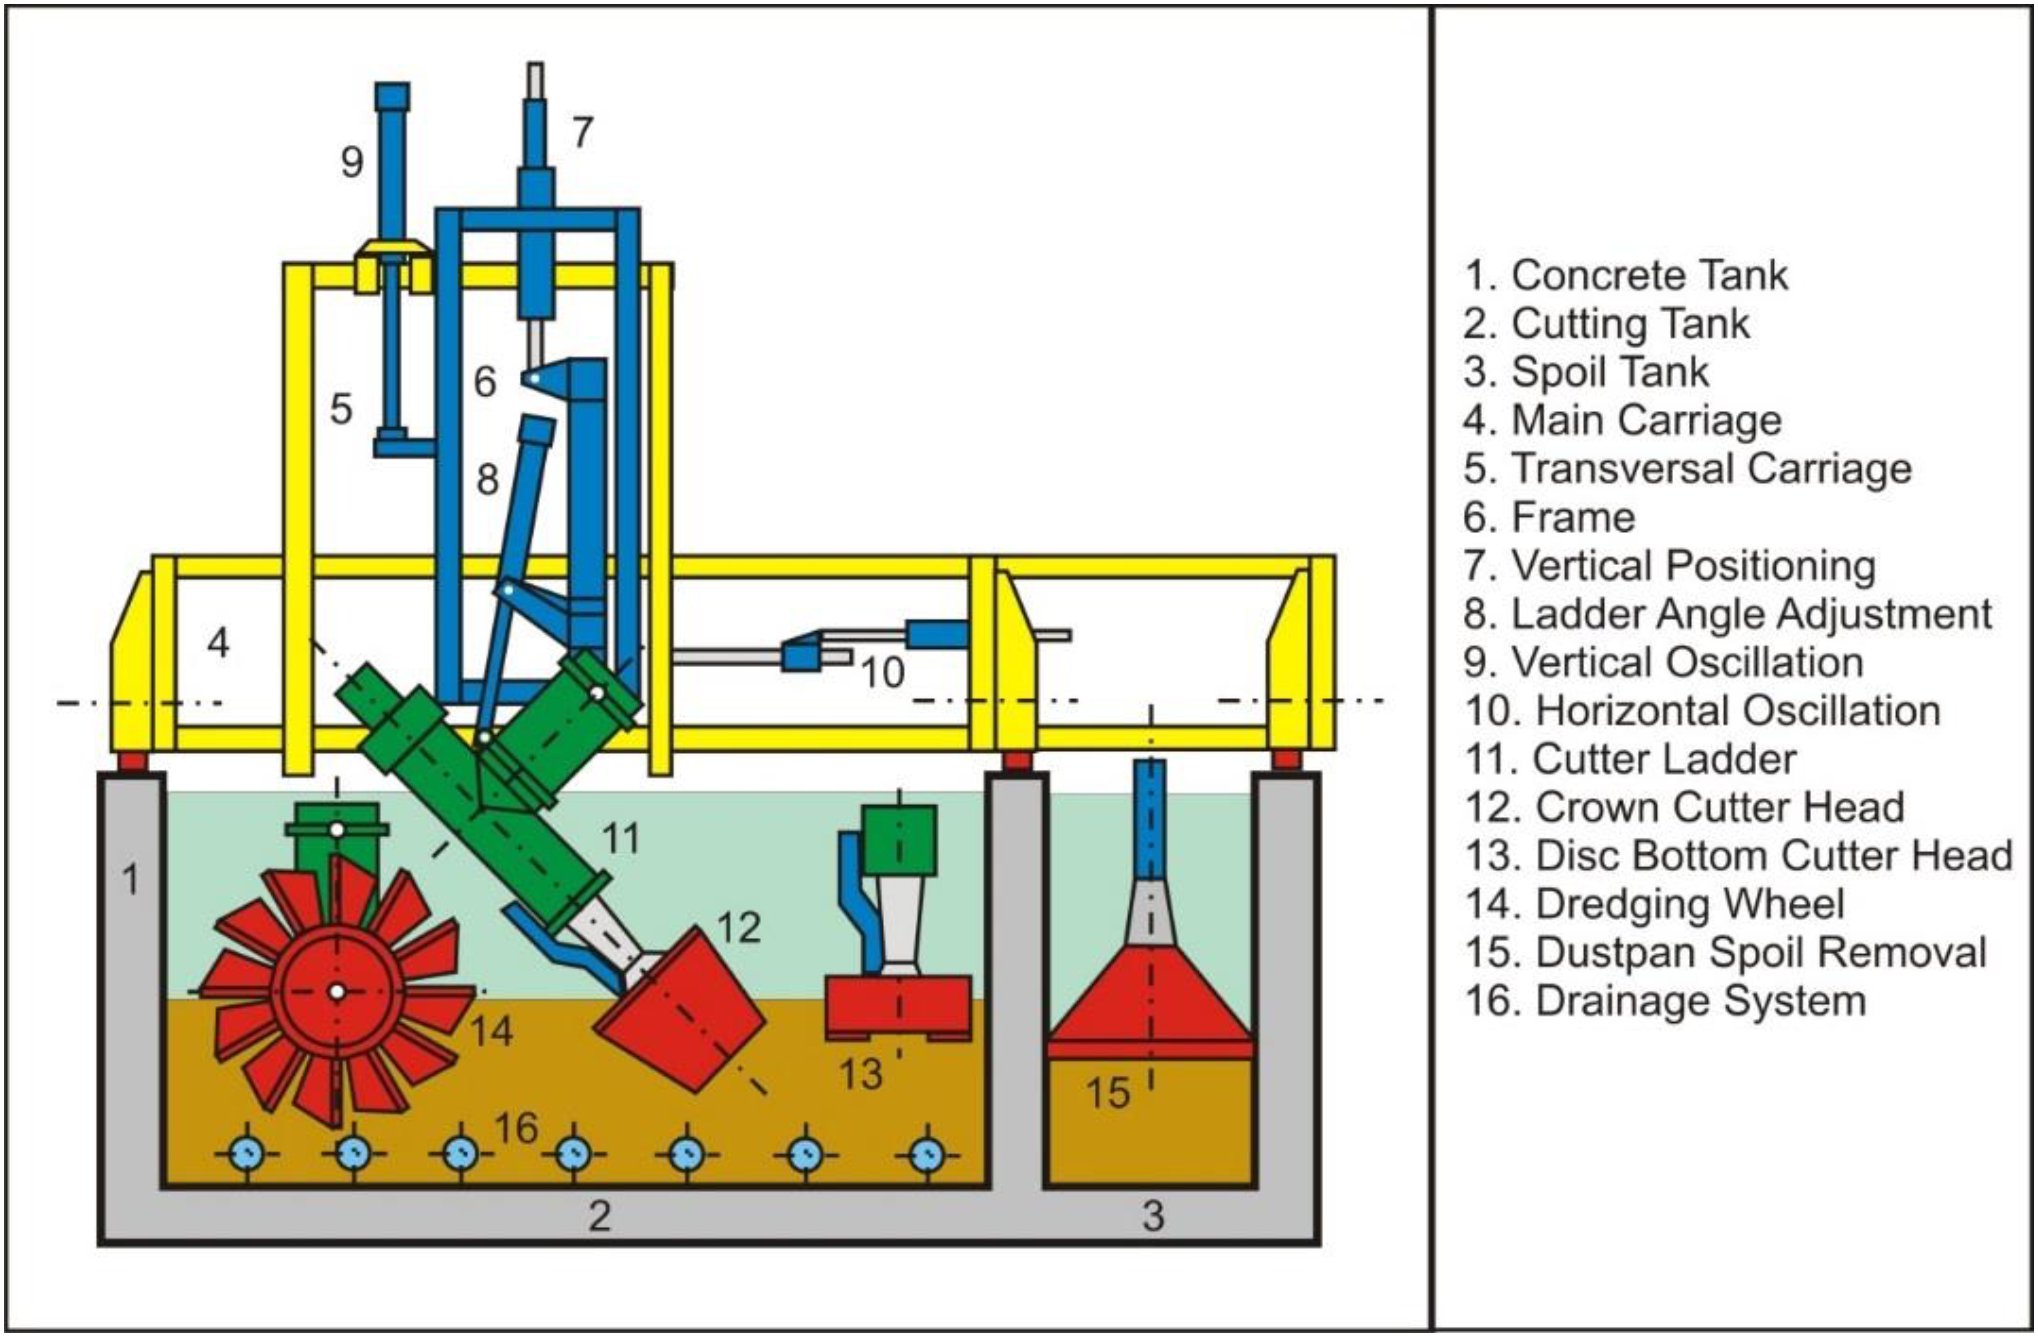
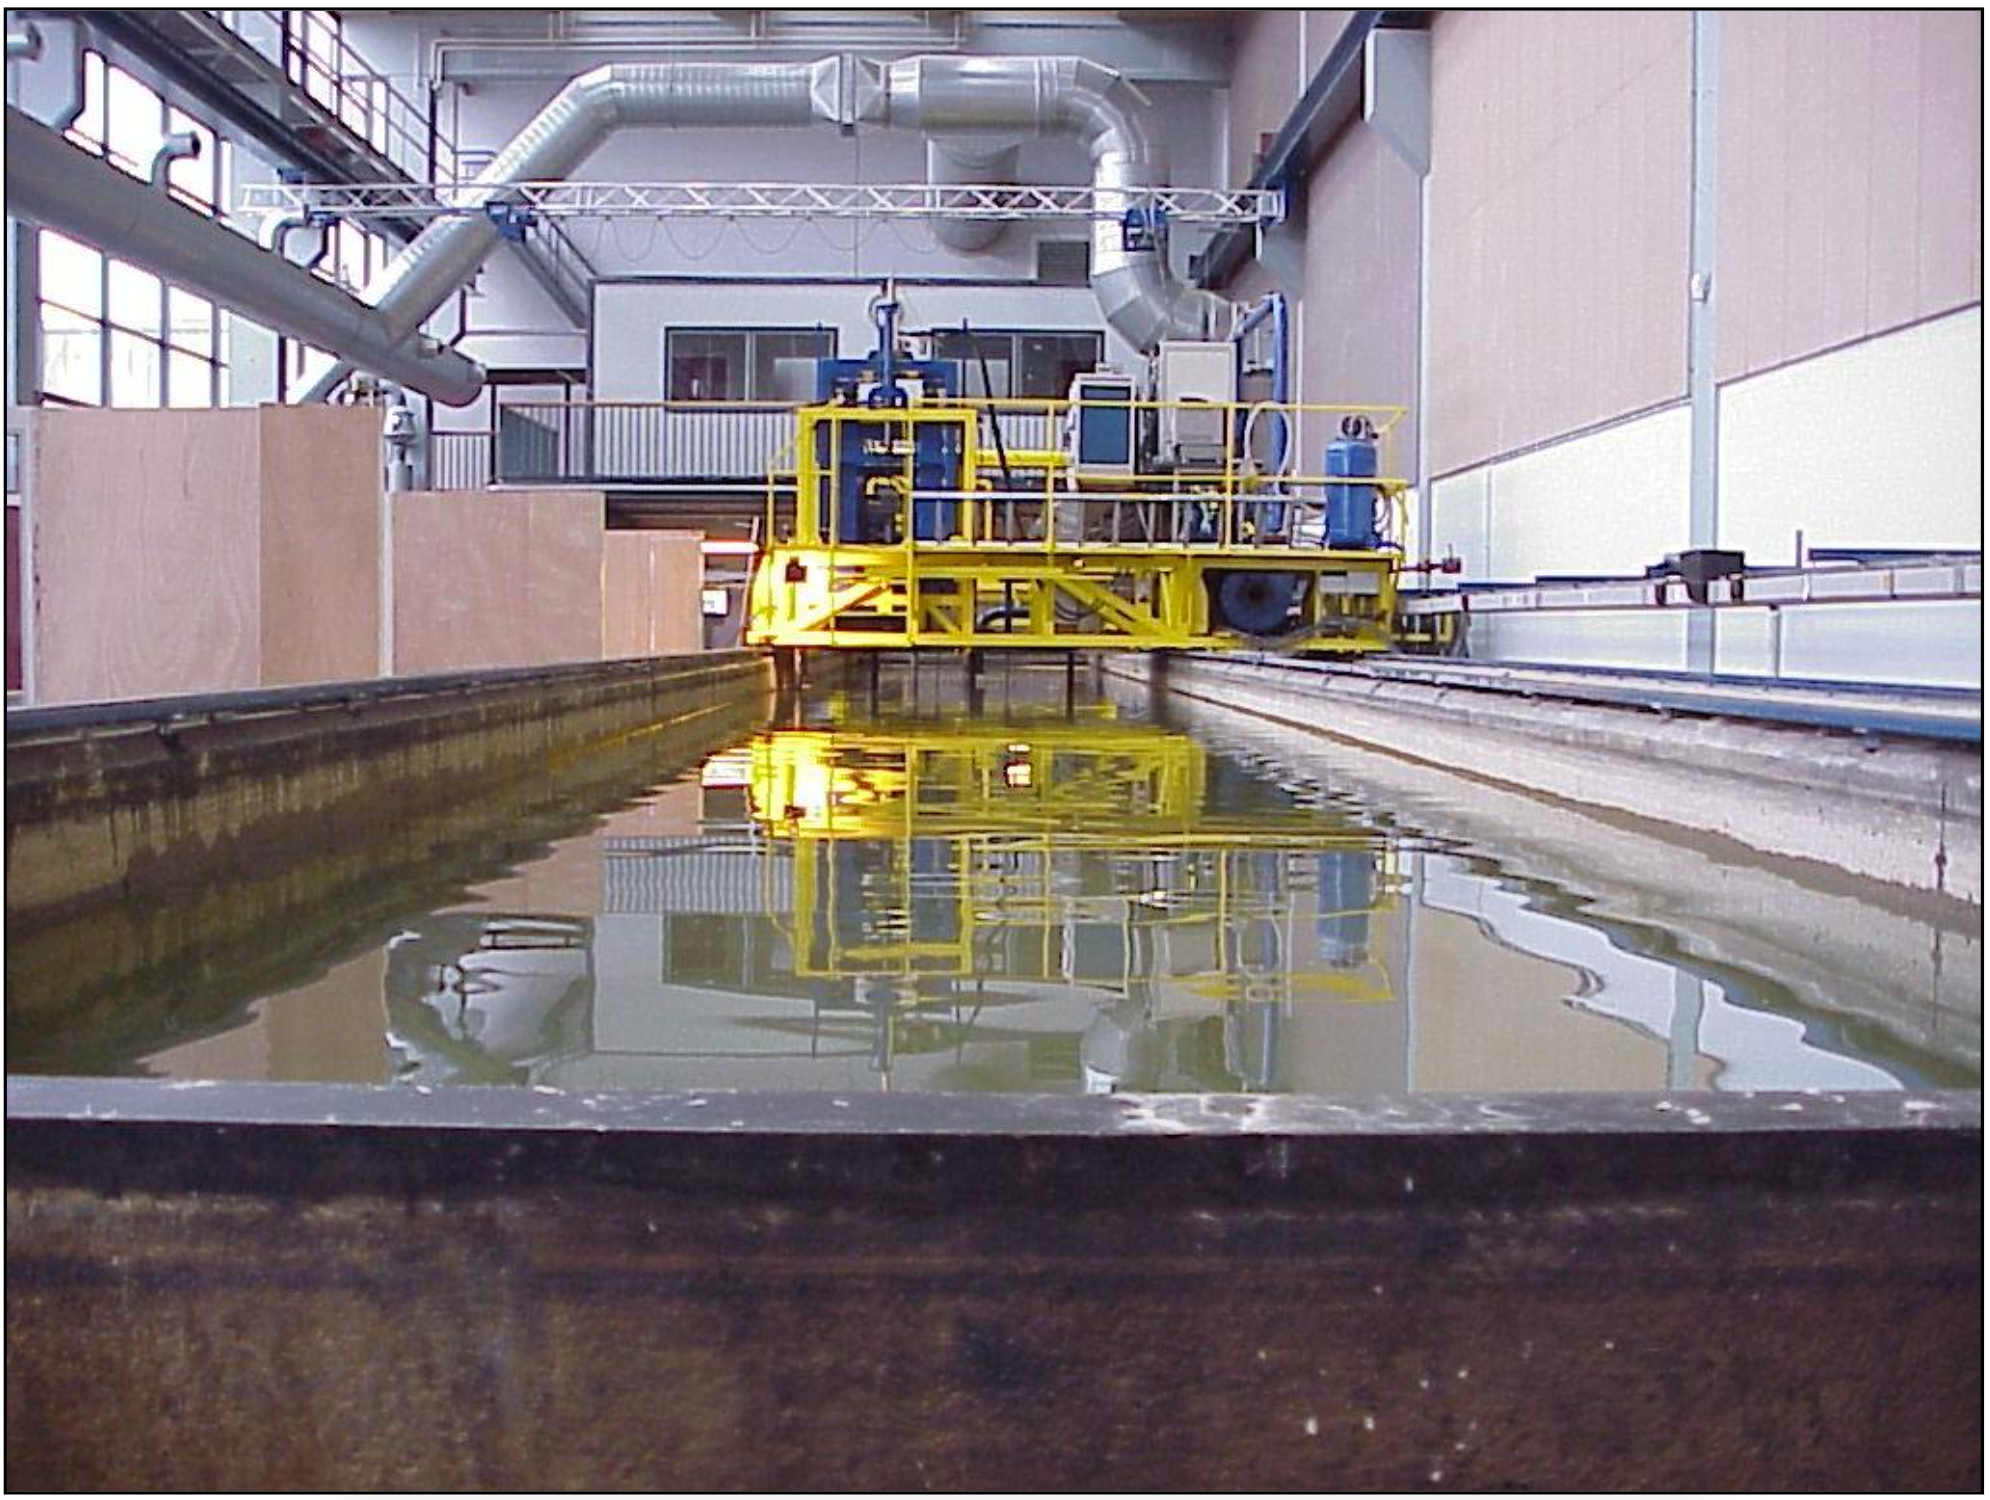
The cutting tank is a concrete tank with a length of 35 m, a width of 3 m and a depth of 1.5 m. The bottom of the tank is covered with a drainage system. Above the drainage system is a layer of about 0.7 m sand (0.110 mm). On top of the sand is a layer of 0.5 m water. Other soils than the 0.110 mm sand can be used in the tank. On top of the tank rails are mounted on which a carriage can ride with speeds of up to 1.25 m/s with a pulling force of up to 15 kN, or 2.5 m/s with a pulling force of 7.5 kN. On the carriage an auxiliary carriage is mounted that can be moved transverse to the velocity of the main carriage. On this carriage a hydraulic swell simulating system is mounted, thus enabling the cutting tools to be subjected to specific oscillations. Under the carriage dredging equipment such as cutter heads and drag heads can be mounted. The dredging equipment can be instrumented with different types of transducers such as force, speed and density transducers. The signals from these transducers will be conditioned before they go to a computer via an A/D converter. On the carriage a hydraulic system is available, including velocity and density transducers. A 25 kW hydraulic drive is available for cutter heads and dredging wheels. The dredge pump is driven by a 15 kW electric drive with speed control. With the drainage system the pore water pressures can be controlled. Dredged material is dumped in an adjacent hopper tank to keep the water clean for under water video recordings. In the cutting tank research is carried out on cutting processes, mixture forming, offshore dredging, but also jet-cutting, the removal of contaminated silt, etc.
The tests carried out in the Dredging Engineering Laboratory had the objective to find the failure mechanisms of a sand package under large cutting angles of 60 ̊, 75 ̊ and 90 ̊. Main goal of the tests was to visualize the total process in a 2-dimensional view. Besides, the behaviour of sand in front of the blade was to be investigated. As mentioned before, some wedge exists in front of the blade, but it was not clear until now whether this was a kinematic wedge or a dynamic wedge. Visualising the cutting process and visualising the velocity of the sand on the blade has to improve the understanding of the processes involved.
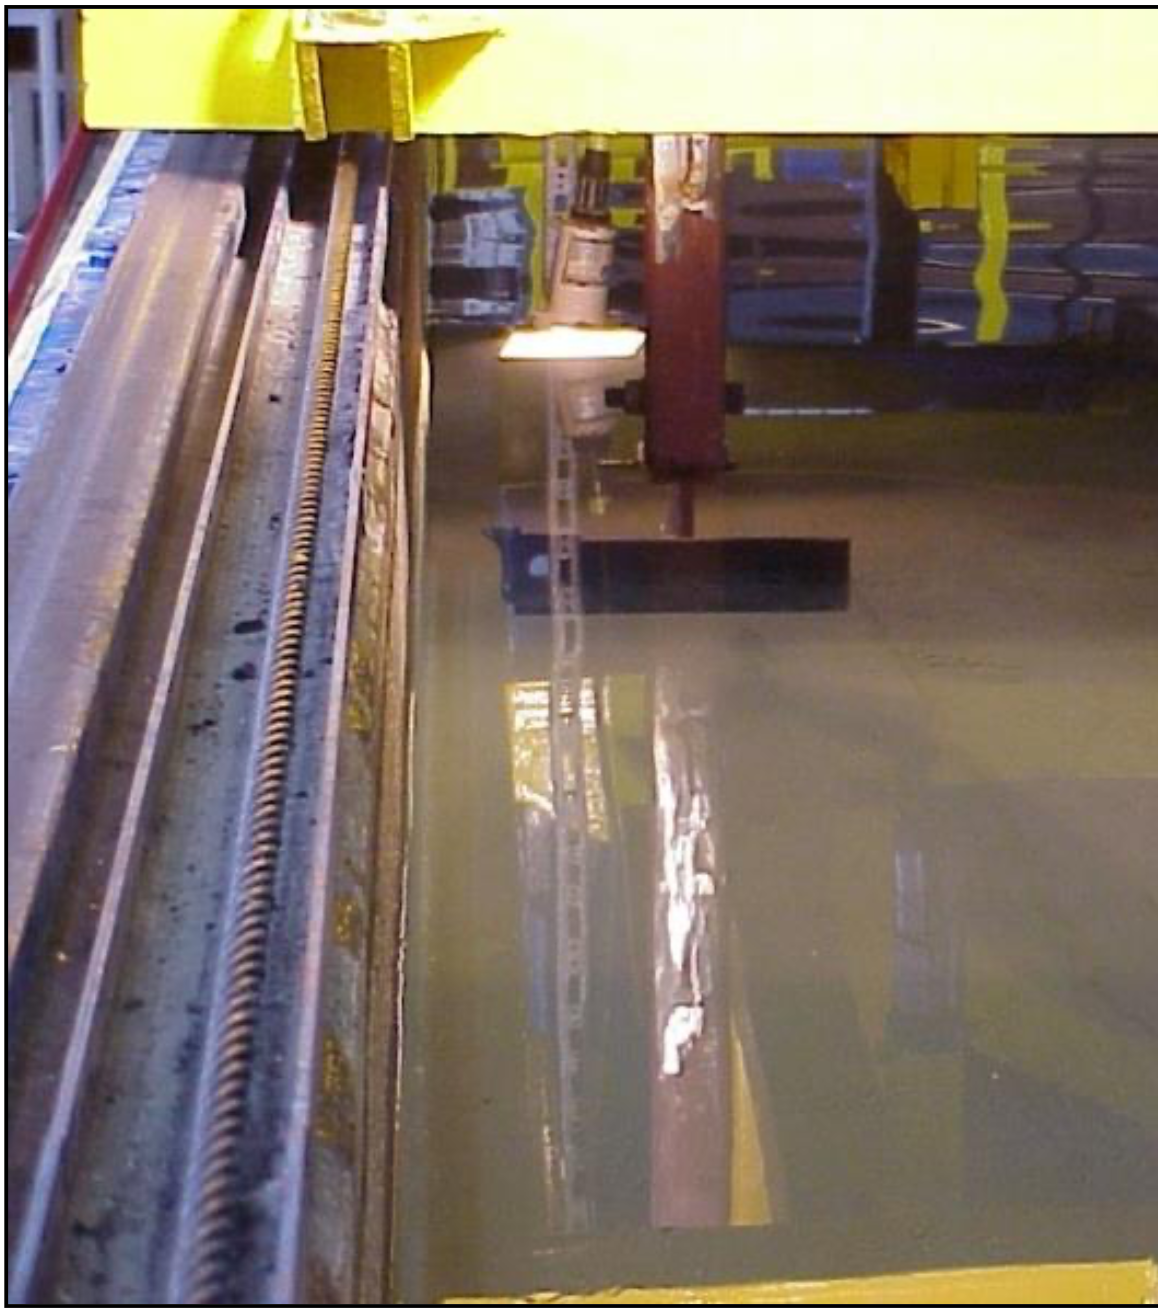
The existing testing facilities have been used to carry out the cutting tests. With these facilities cutting depths from 3 till 7 cm are tested, resulting in an (effective blade height)/(cutting depth) ratio of 2.5 to 6, for the various angles. Cutting velocities of the tests were from 0.1 m/s to 0.4 m/s for smaller and 0.2 m/s for the larger cutting depths. These maximum velocities are limited by the maximum electrical power of the testing facility. In the first series of tests the 2-dimensional cutting process is made visual by doing tests near the window in the cutting tank. The process is not completely 2-dimensional here, because the water pressures and sand friction are influenced by the window, but it gives a good indication of the appearing failure mechanism of the sand package. Figure 12-29 shows a cross-section of the cutting tank and the carriage under which the cutting tools are mounted, while Figure 12-30 shows a front view and Figure 12-31 shows the blades mounted under the carriage.
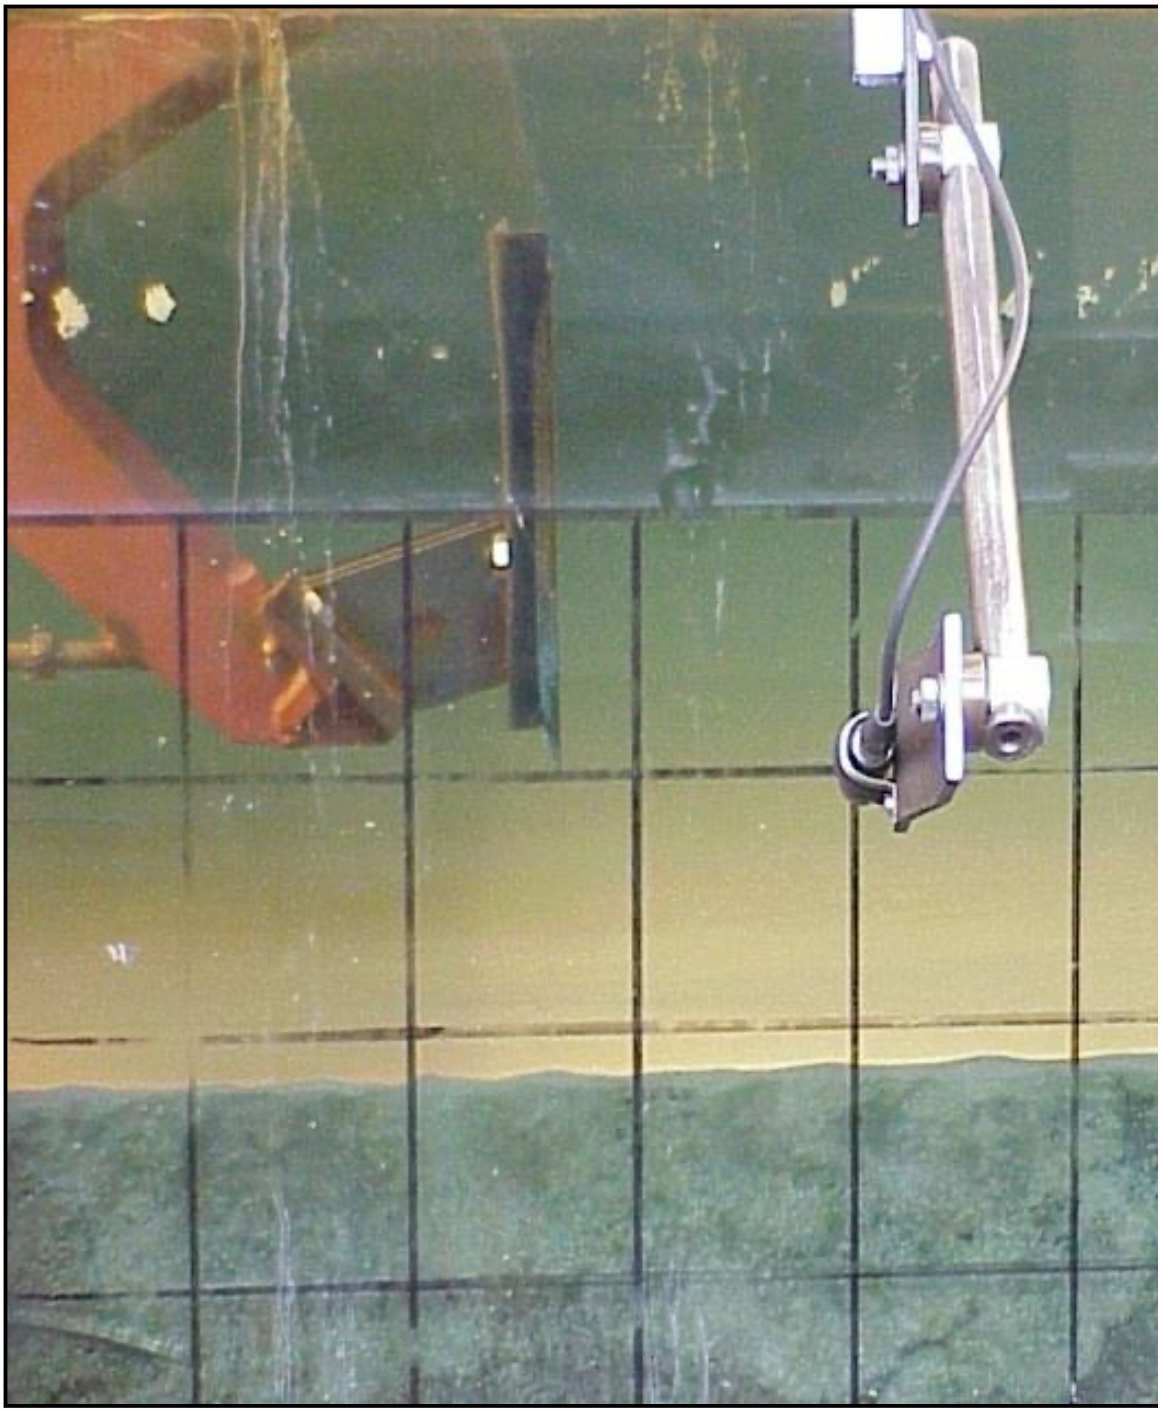
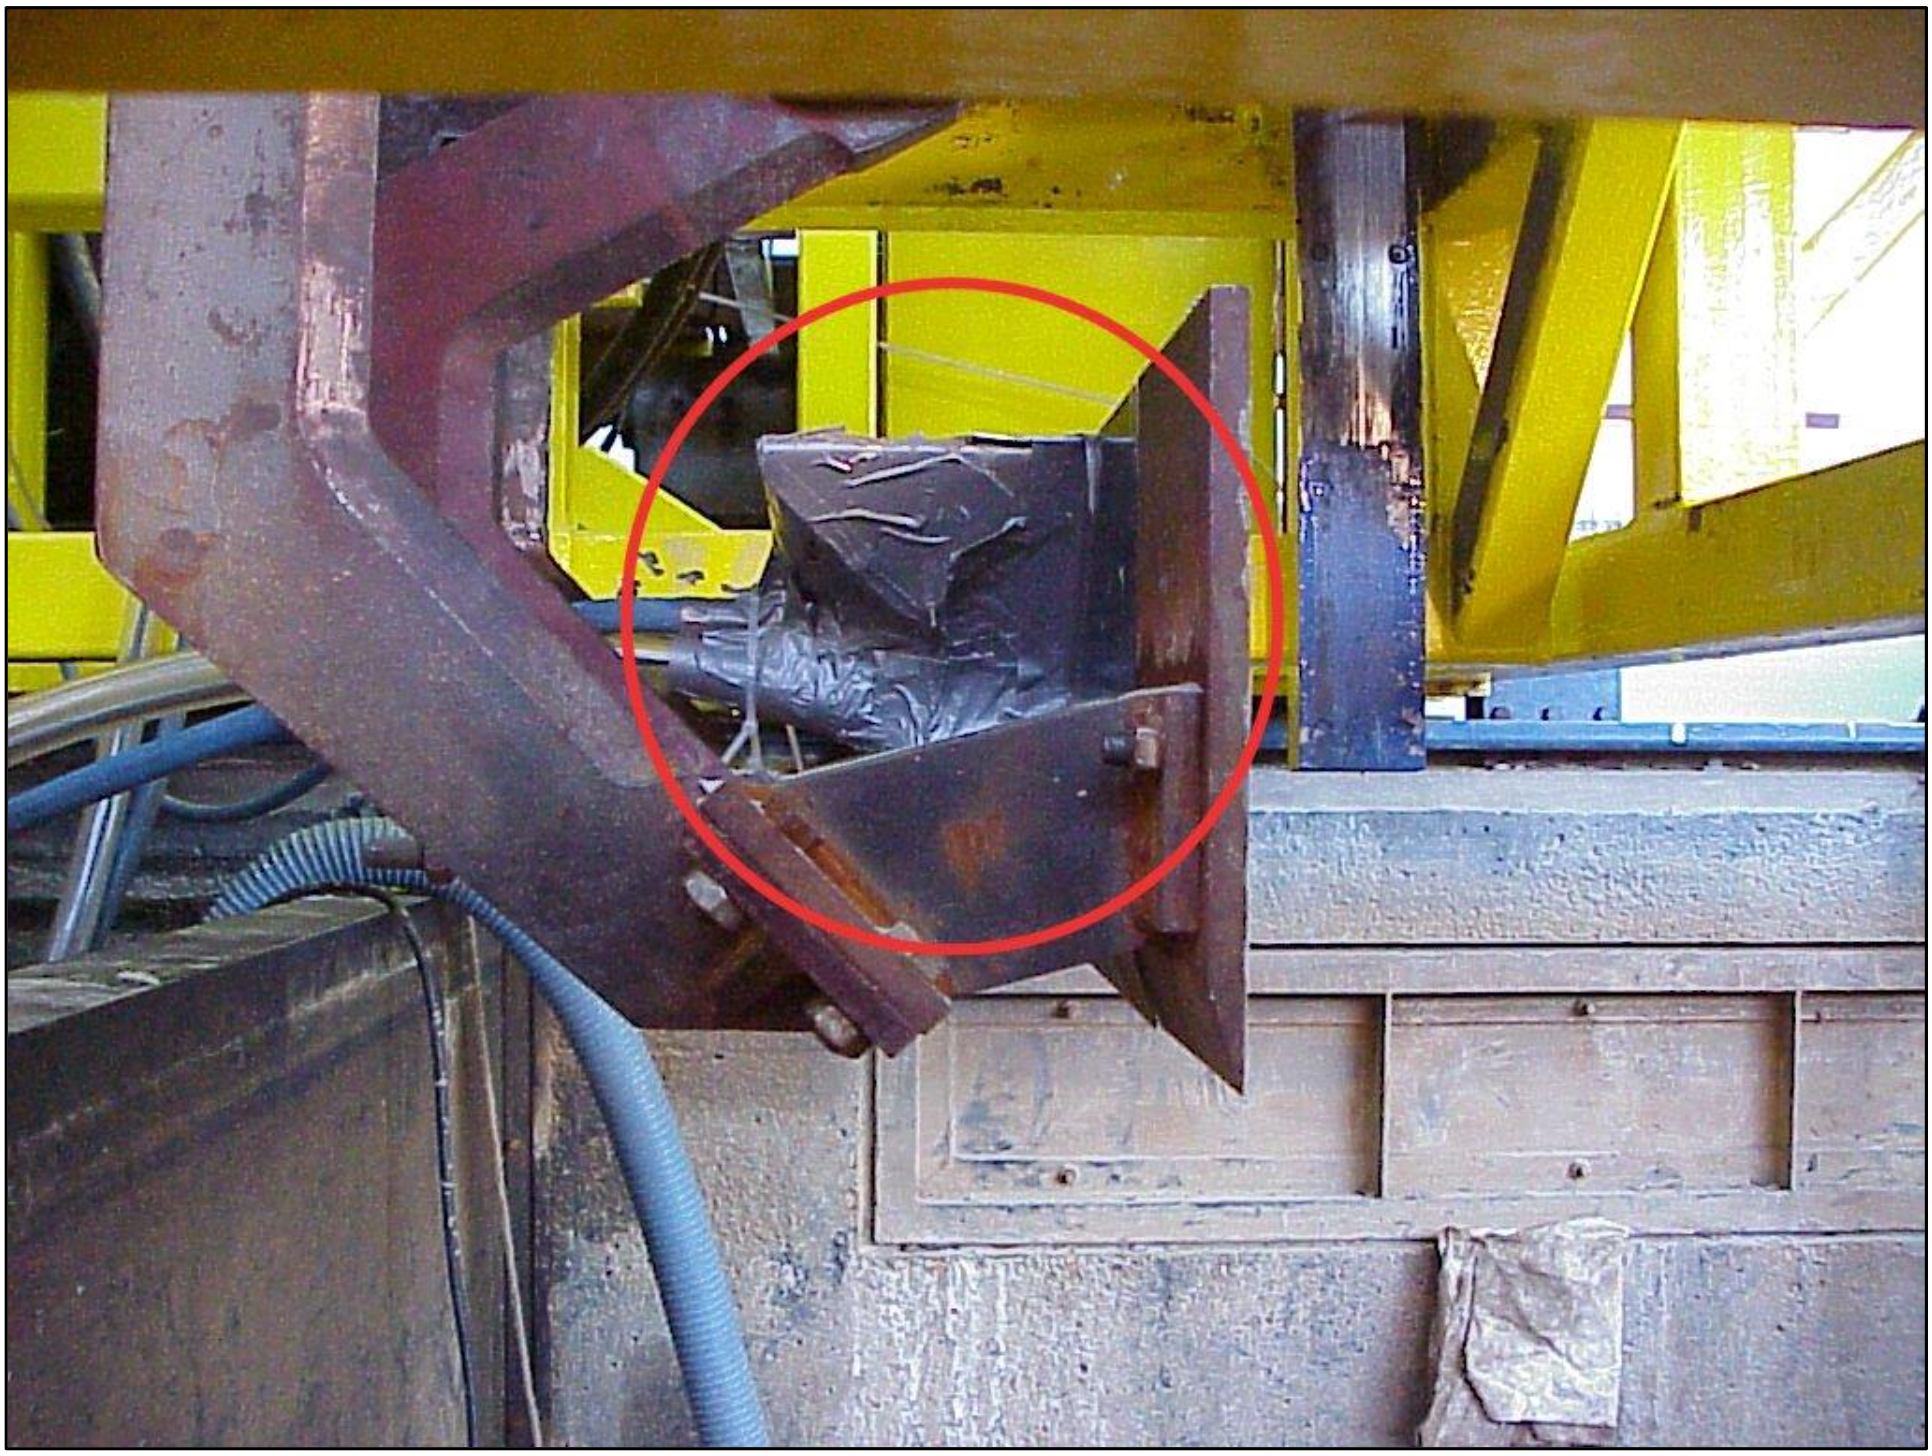
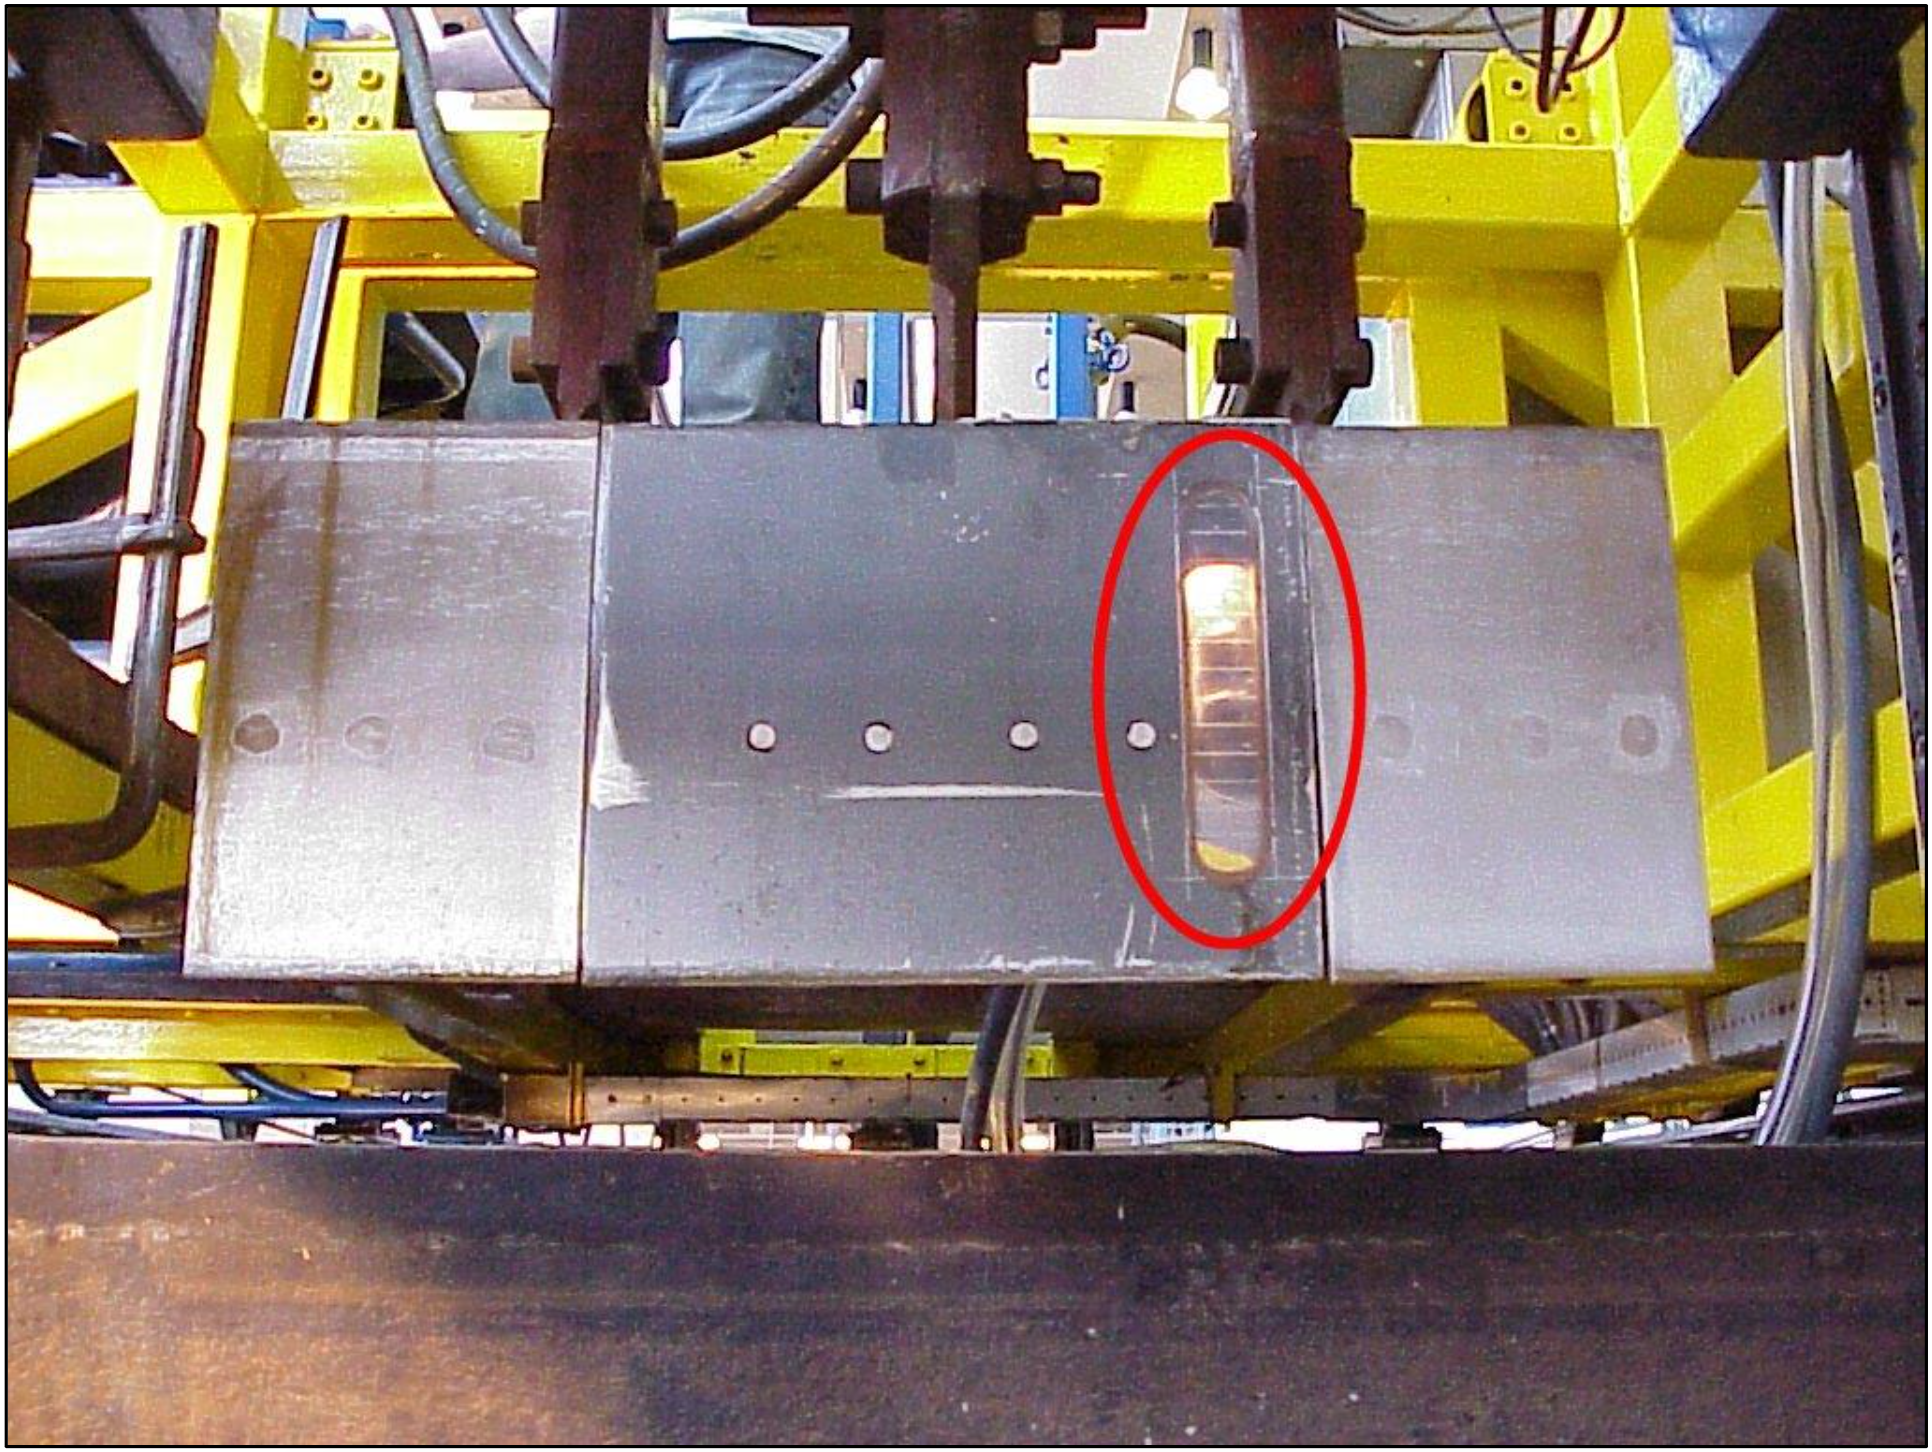
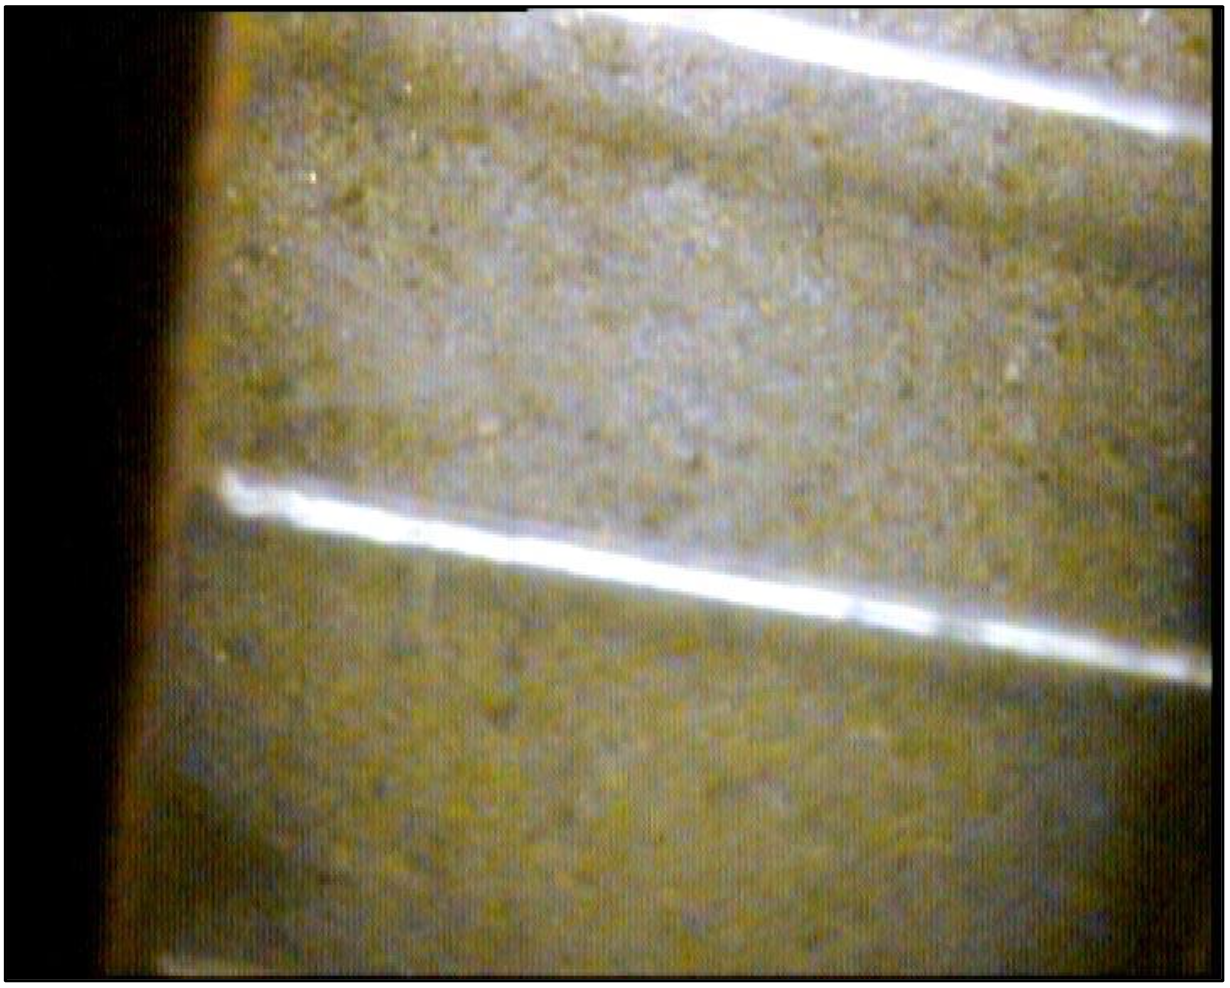
To visualise the behaviour of the sand package in front of the blade a Perspex window is made in the middle one of the 3 cutting blades. Here we expect the least side influences. The middle blade measures a height of 20 cm and a width of 25 cm. The camera is mounted at the back of the blade, in a cover, as seen in Figure 12-33. In Figure 12-32 you can see an underwater light, which is also mounted in the cover, shining on the camera. This construction gives a view of the process as can be seen in Figure 12-34 and Figure 12-35, at a height of 8 till 9 cm in the blade. The camera records with a frame rate of 25/sec. In the Perspex window, Figure 12-35, a scale of 1 cm is engraved. By tracing sand grains along the window a ratio is determined between the cutting velocity and the velocity along the window at the recorded height, for the angles of 75 ̊ and 90 ̊. These ratios are respectively 0.3 and 0.15. At 60 ̊ this ratio can hardly be determined because it lies in the range of the cutting velocity and out of the range of the recorded frame rate.
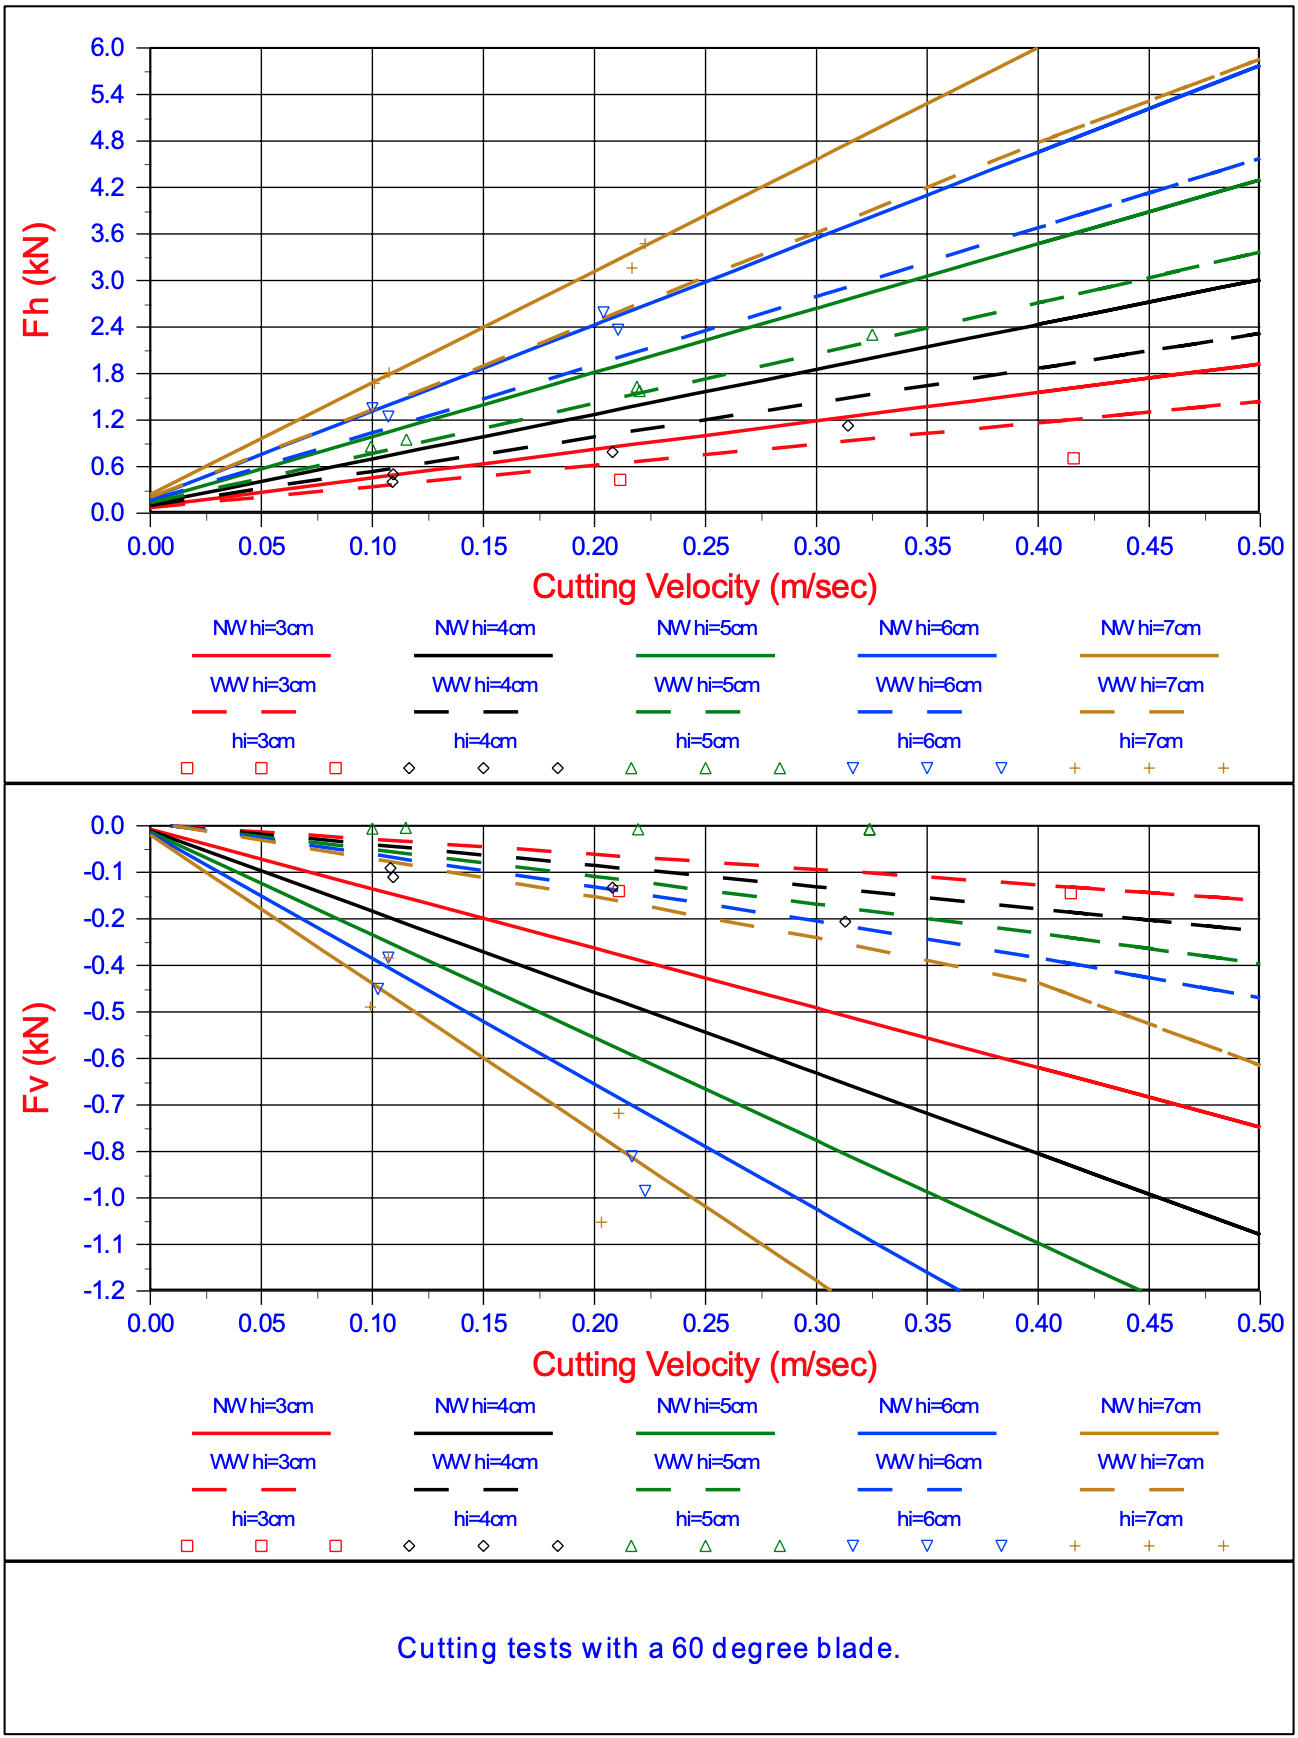
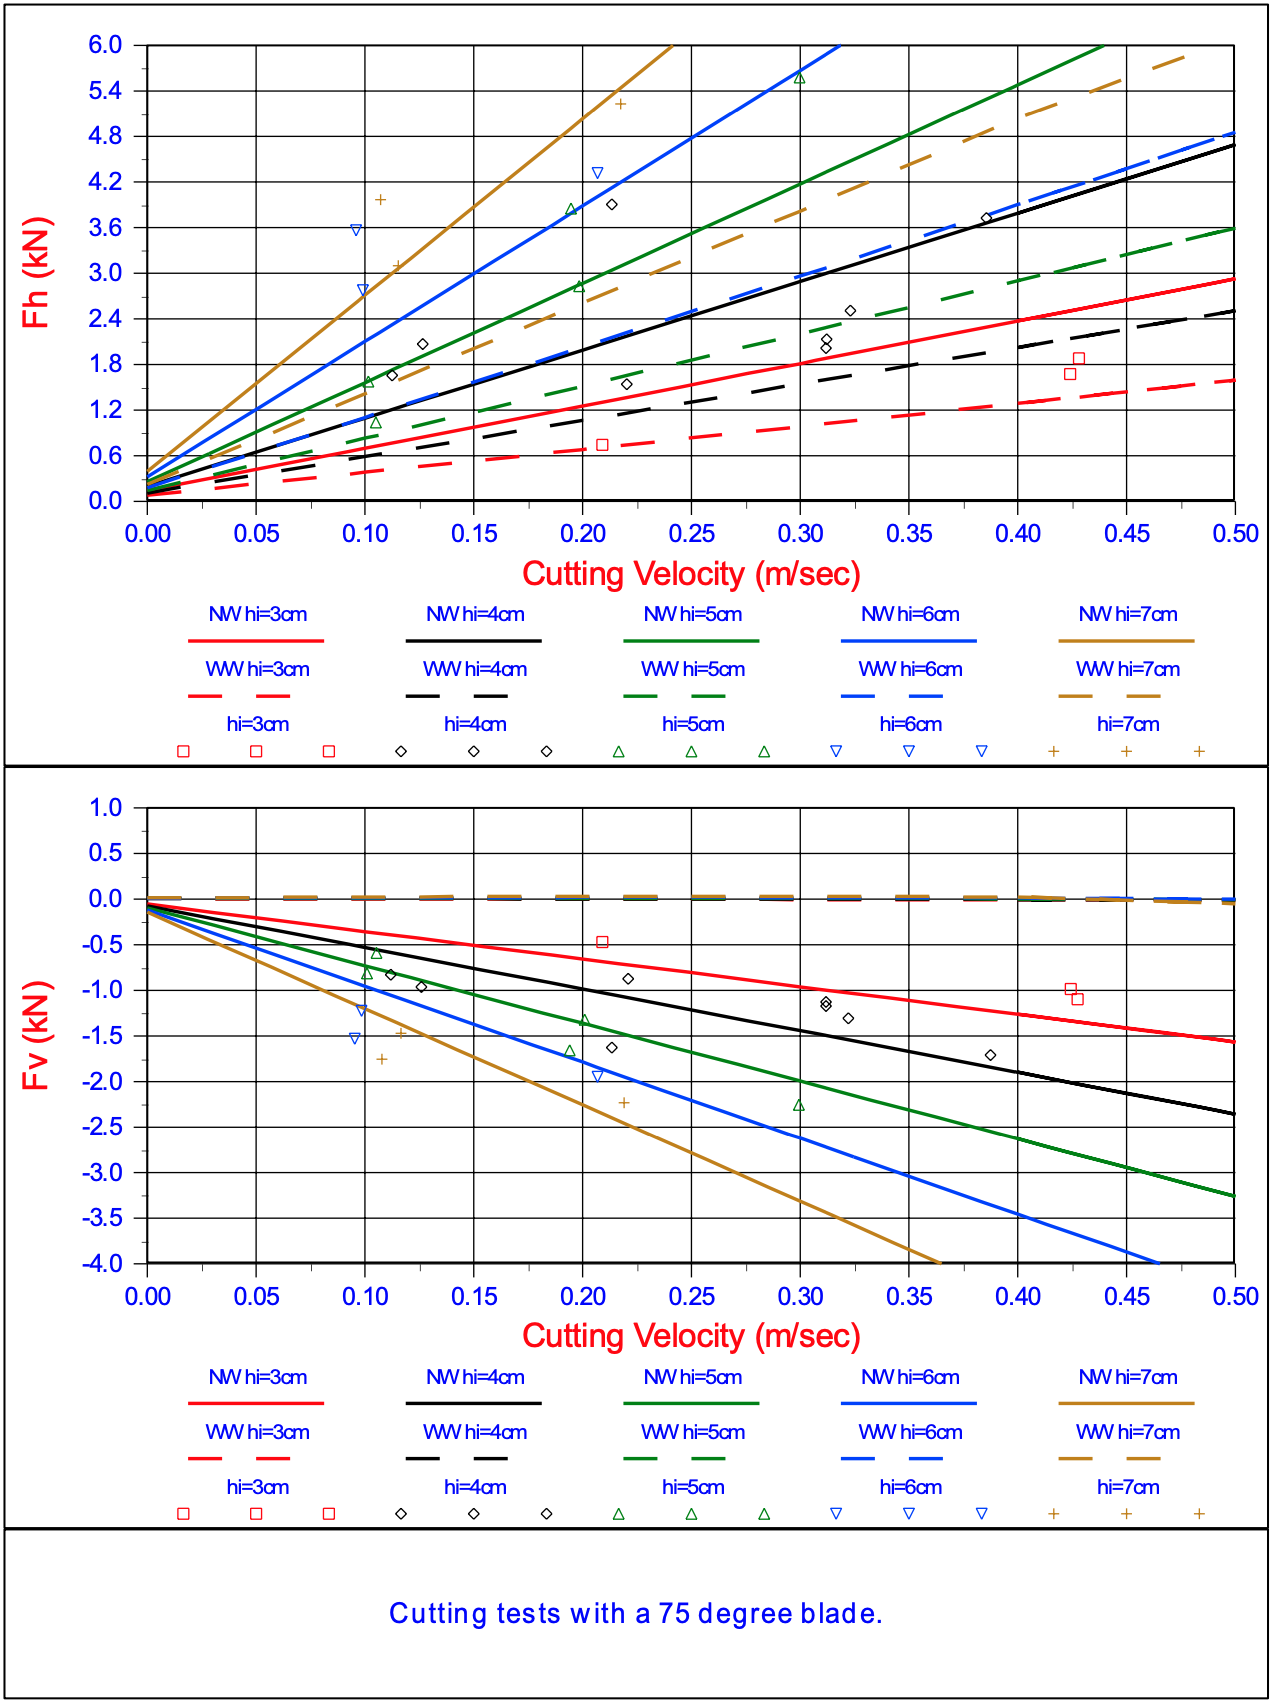
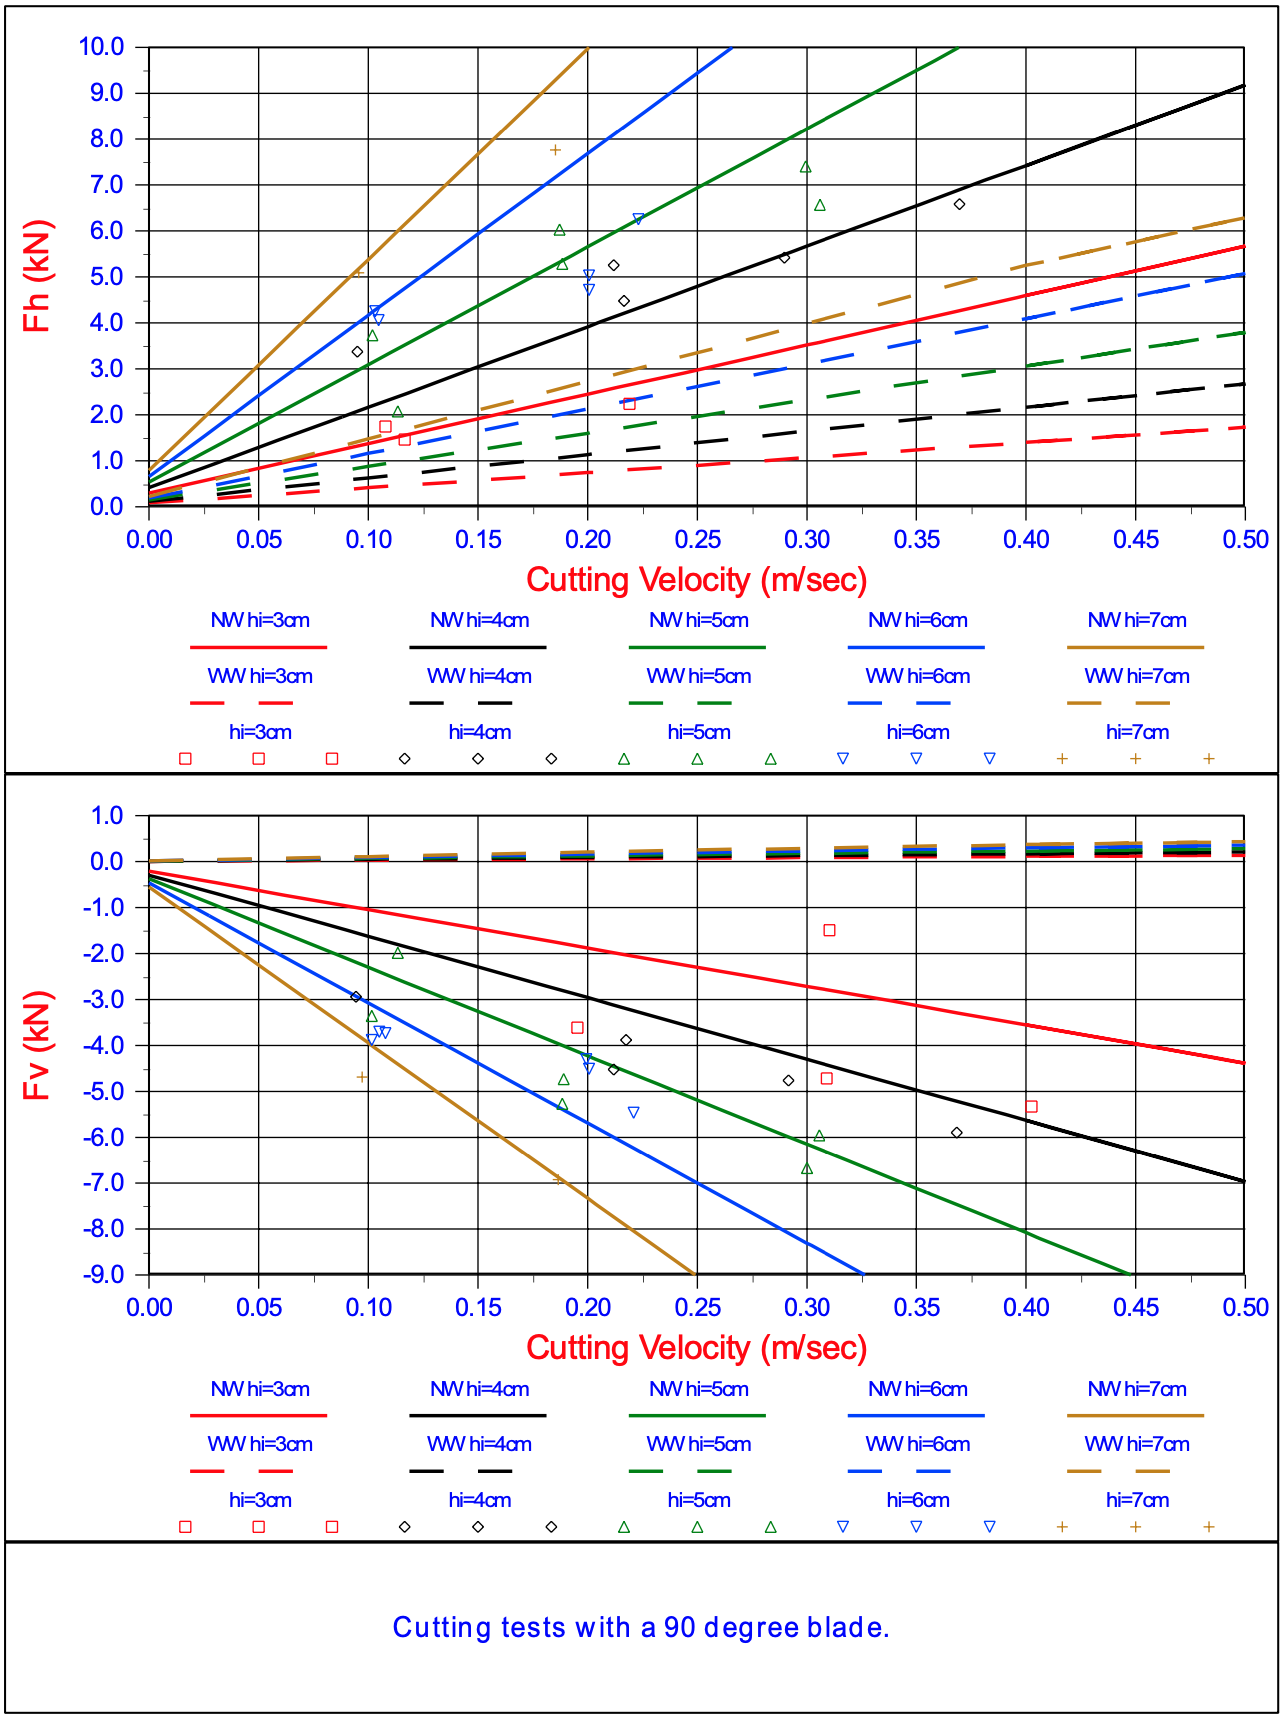
With a dynamometer forces on the middle blade are measured. The horizontal cutting forces for the various angles are roughly in a ratio of 1:1.5:2, for 60 ̊, 75 ̊, 90 ̊ respectively. This indicates a changing failure mechanism for the 3 tested angles, which the videos from the tests along the glass also confirm.
Figures 9, 10 and 11 show the horizontal cutting forces as obtained from the experiments.
From the above results two main conclusions can be drawn. First of all, the sand is moving relative to the blade on the blade and secondly the cutting forces at a 90 ̊ blade are much smaller then would be expected from the cutting theory, Miedema (1987 September). As shown in Figure 12-1, He et al. (1998) and also observed according to Figure 12-39, a wedge exists in front of the blade, but apparently this is not a kinematic wedge, but a dynamic wedge.
To determine the flow pattern of the sand in the dynamic wedge, vertical bars of colored sand grains were inserted in the sand. These vertical bars had a length of about 10 cm. Since the maximum cutting depth was 7 cm, the full cutting process was covered by these bars. Figure 12 shows the cutting process with the vertical bars and it shows how the bars are deformed by the cutting process.