17.23: Appendix W- Rock Cutting Charts
- Page ID
- 36524
W.1 Brittle Shear
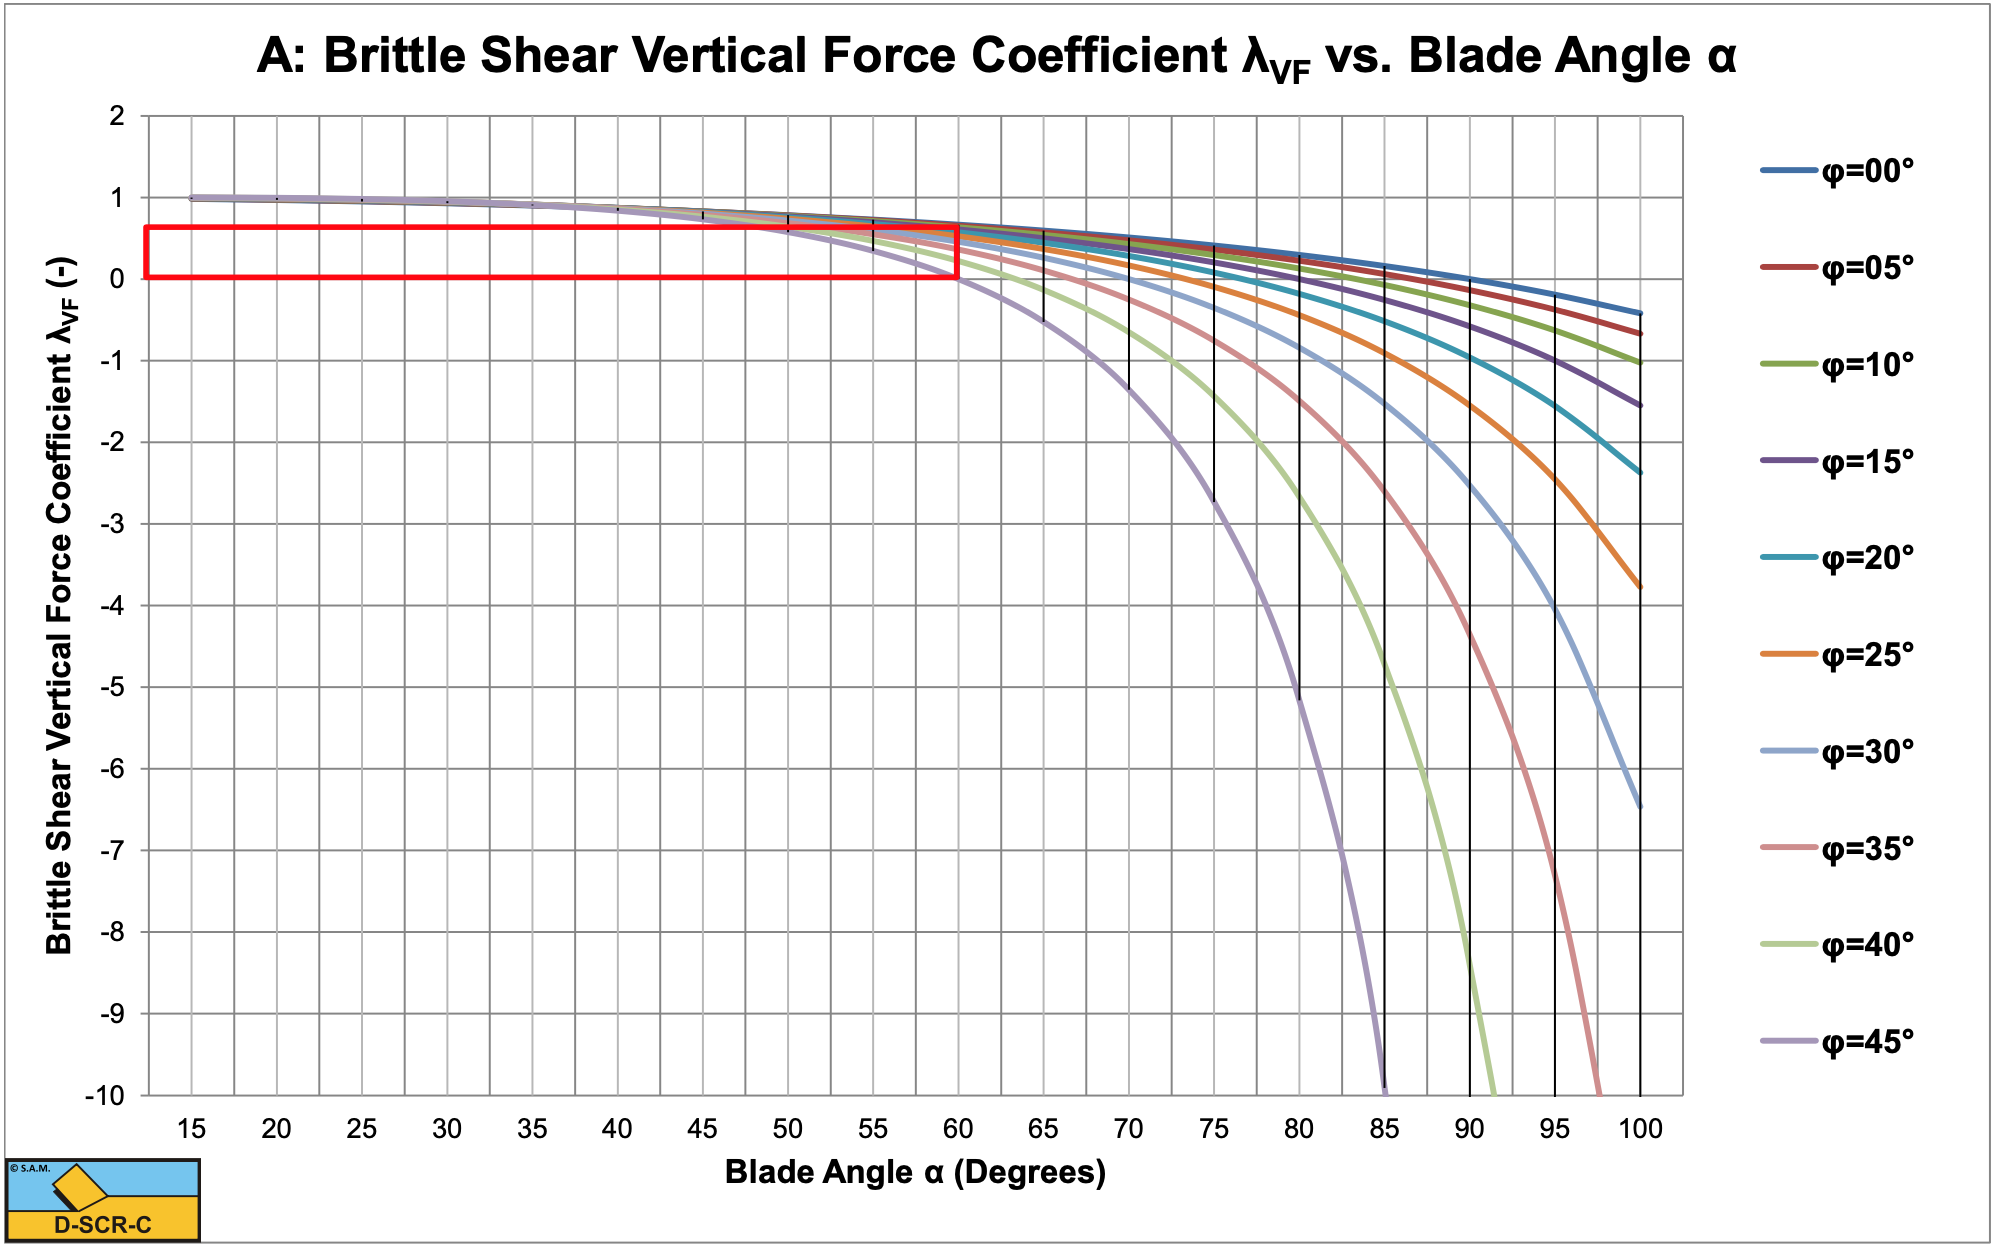
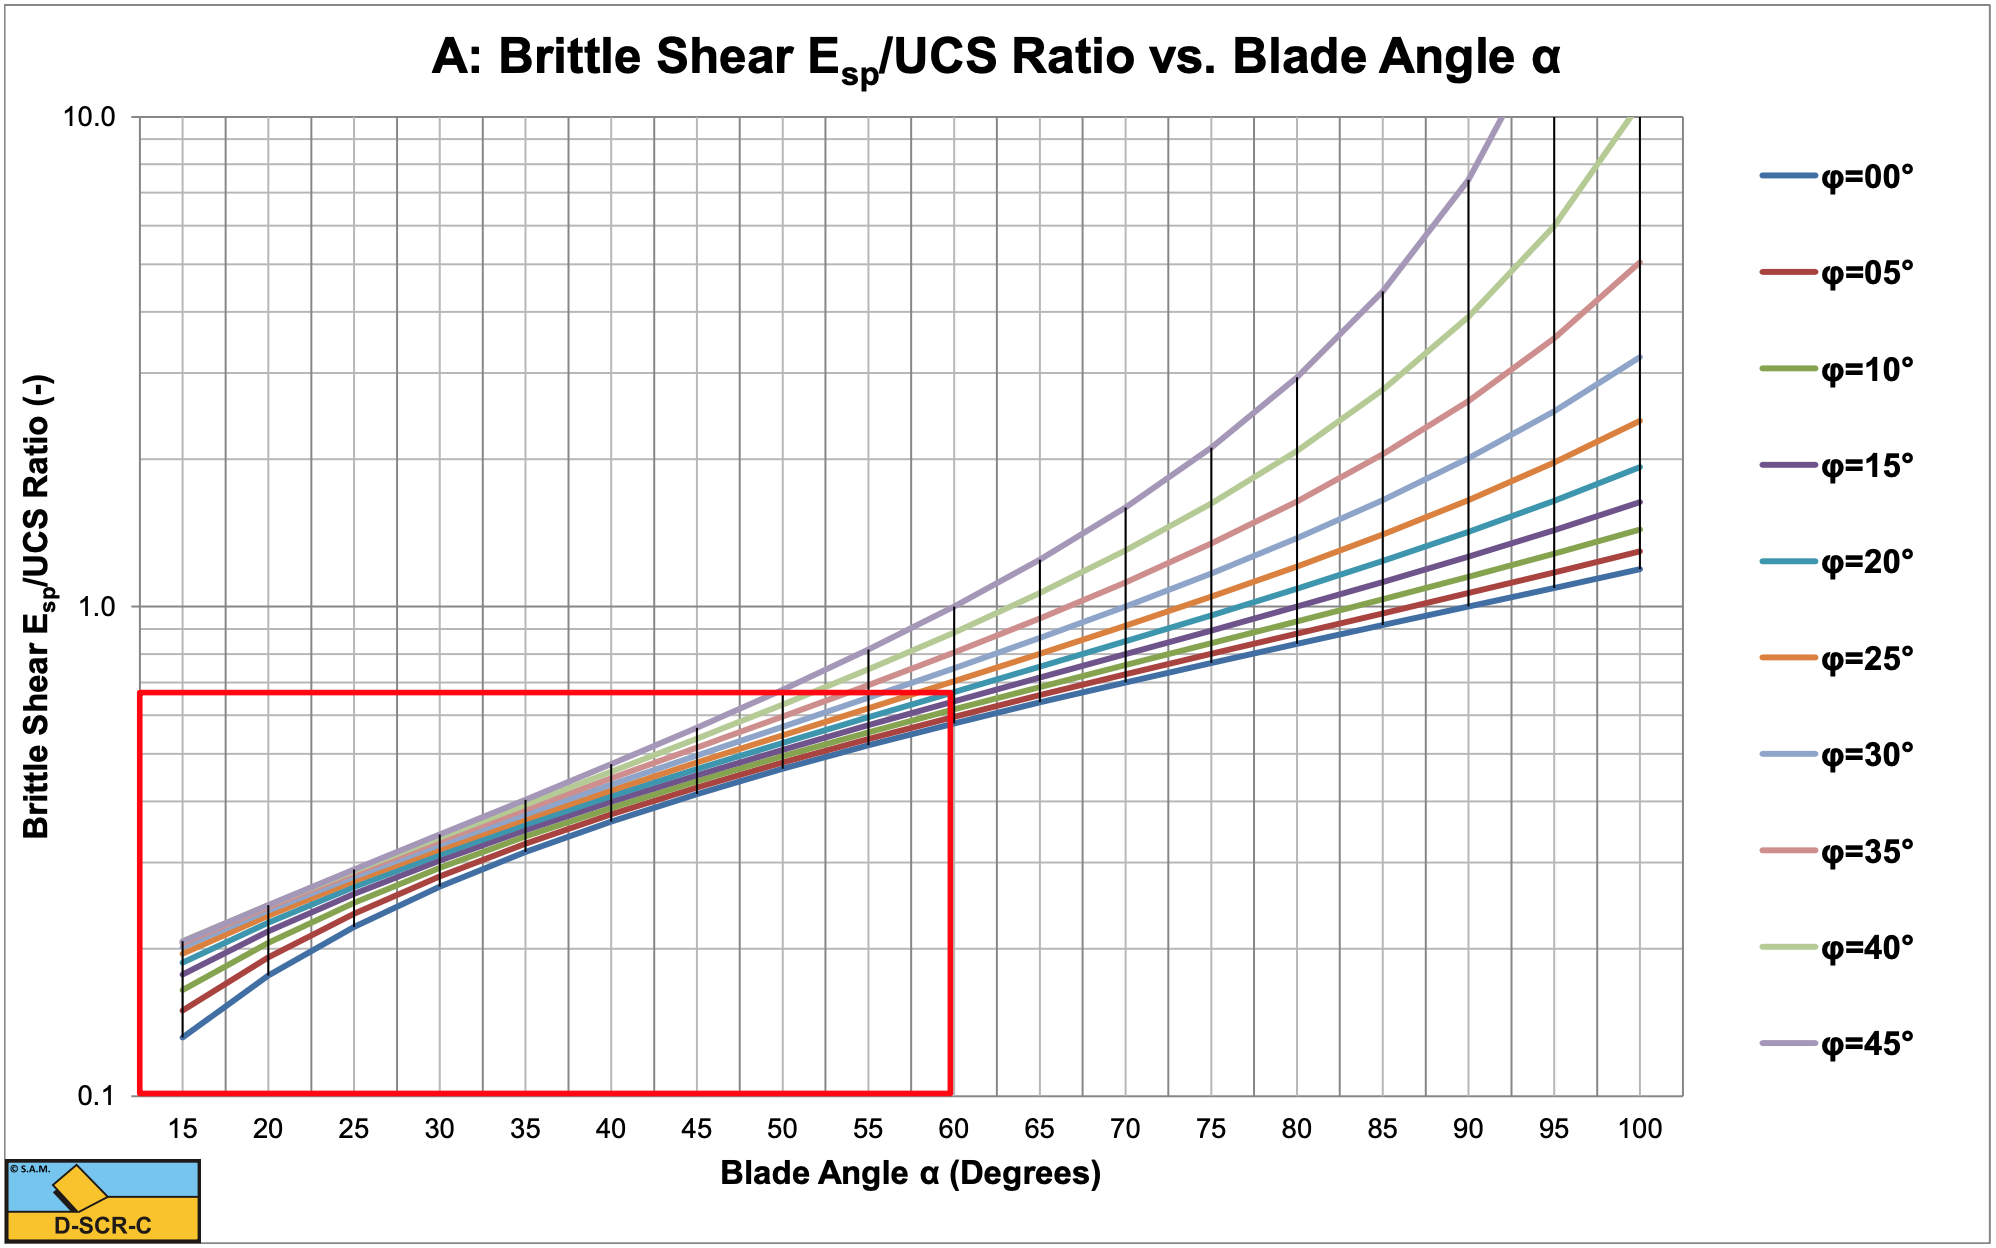
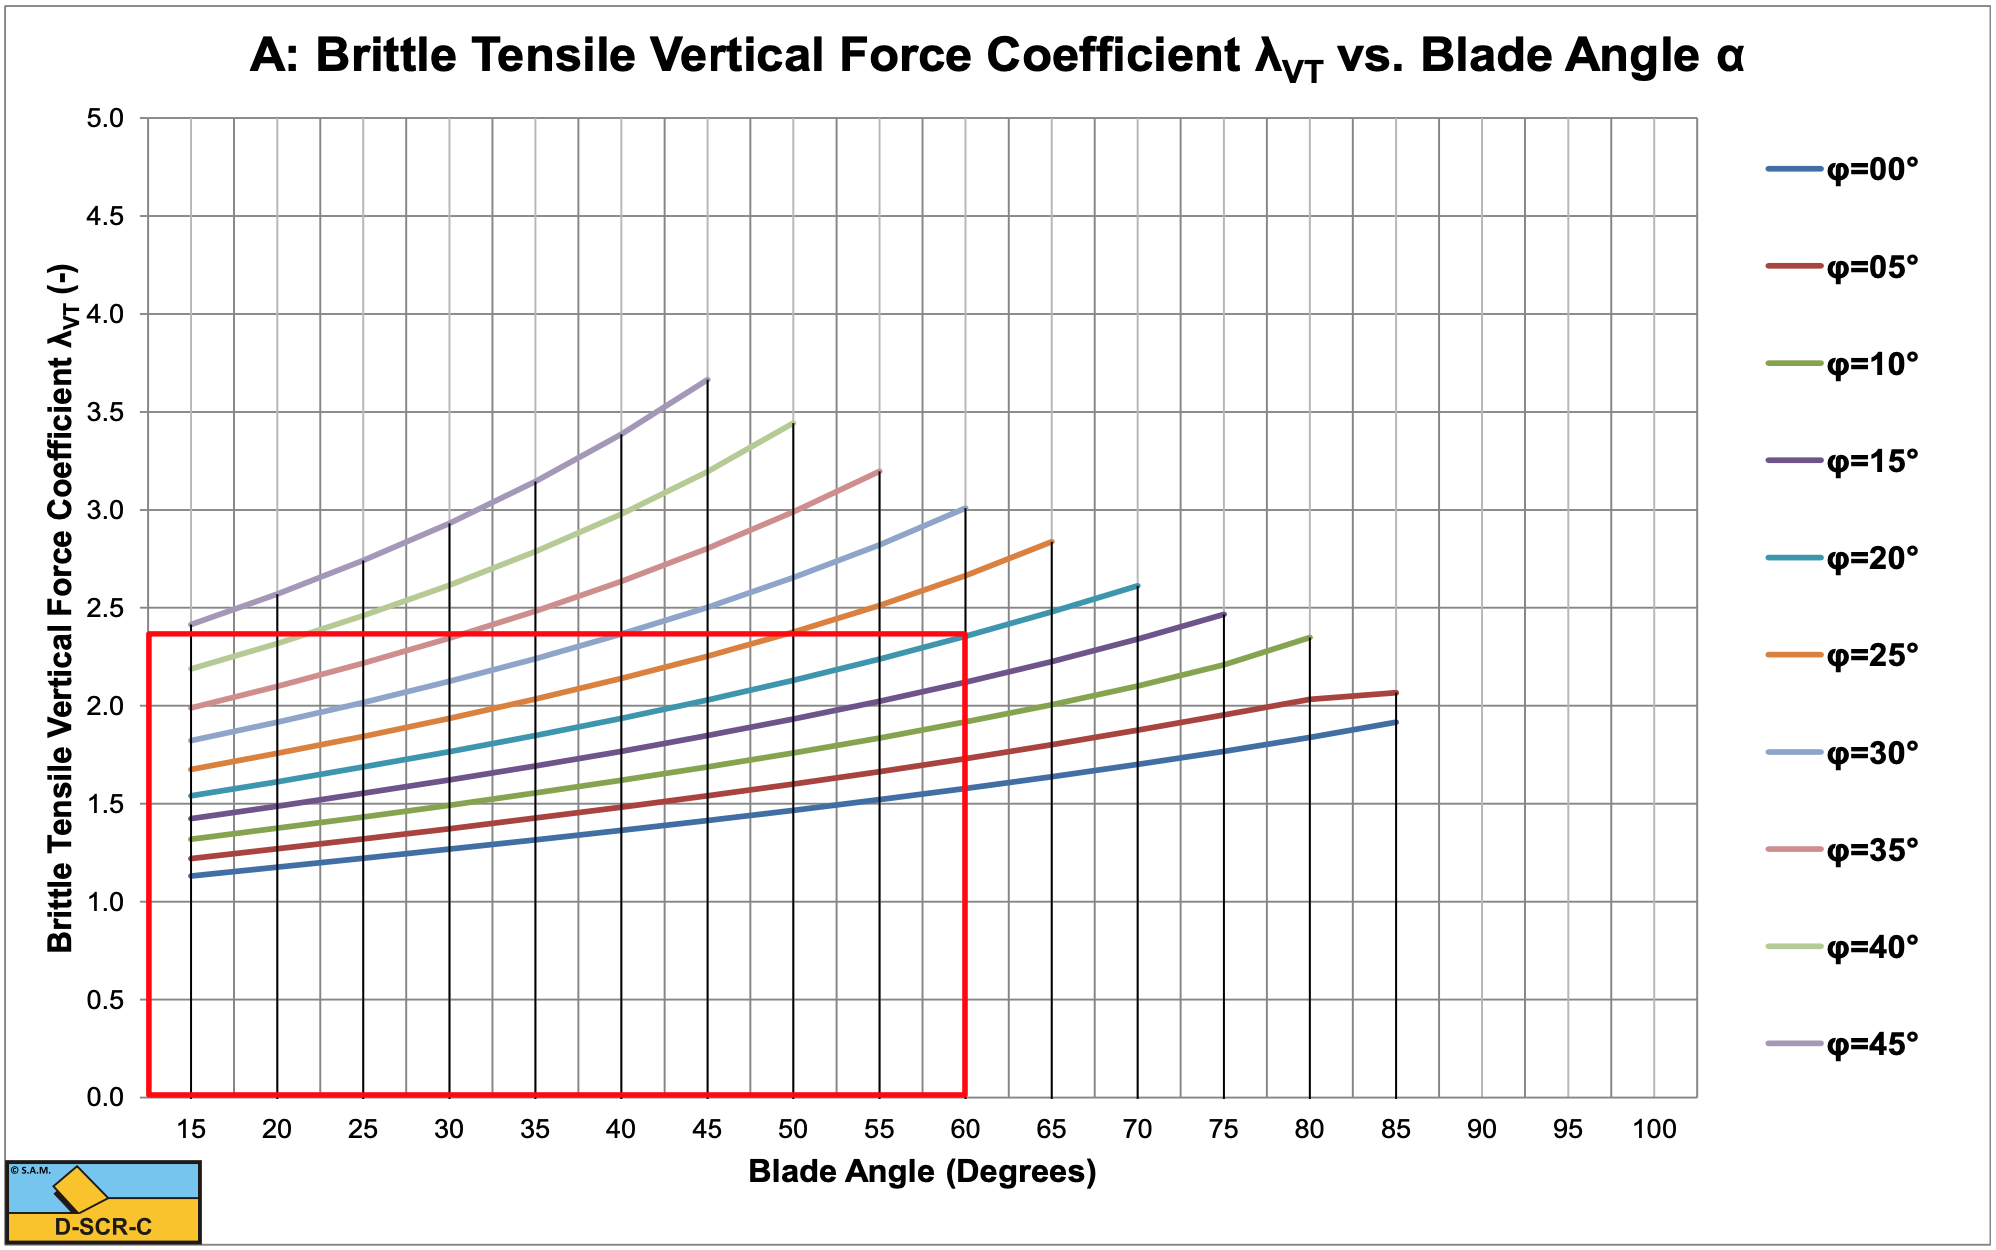
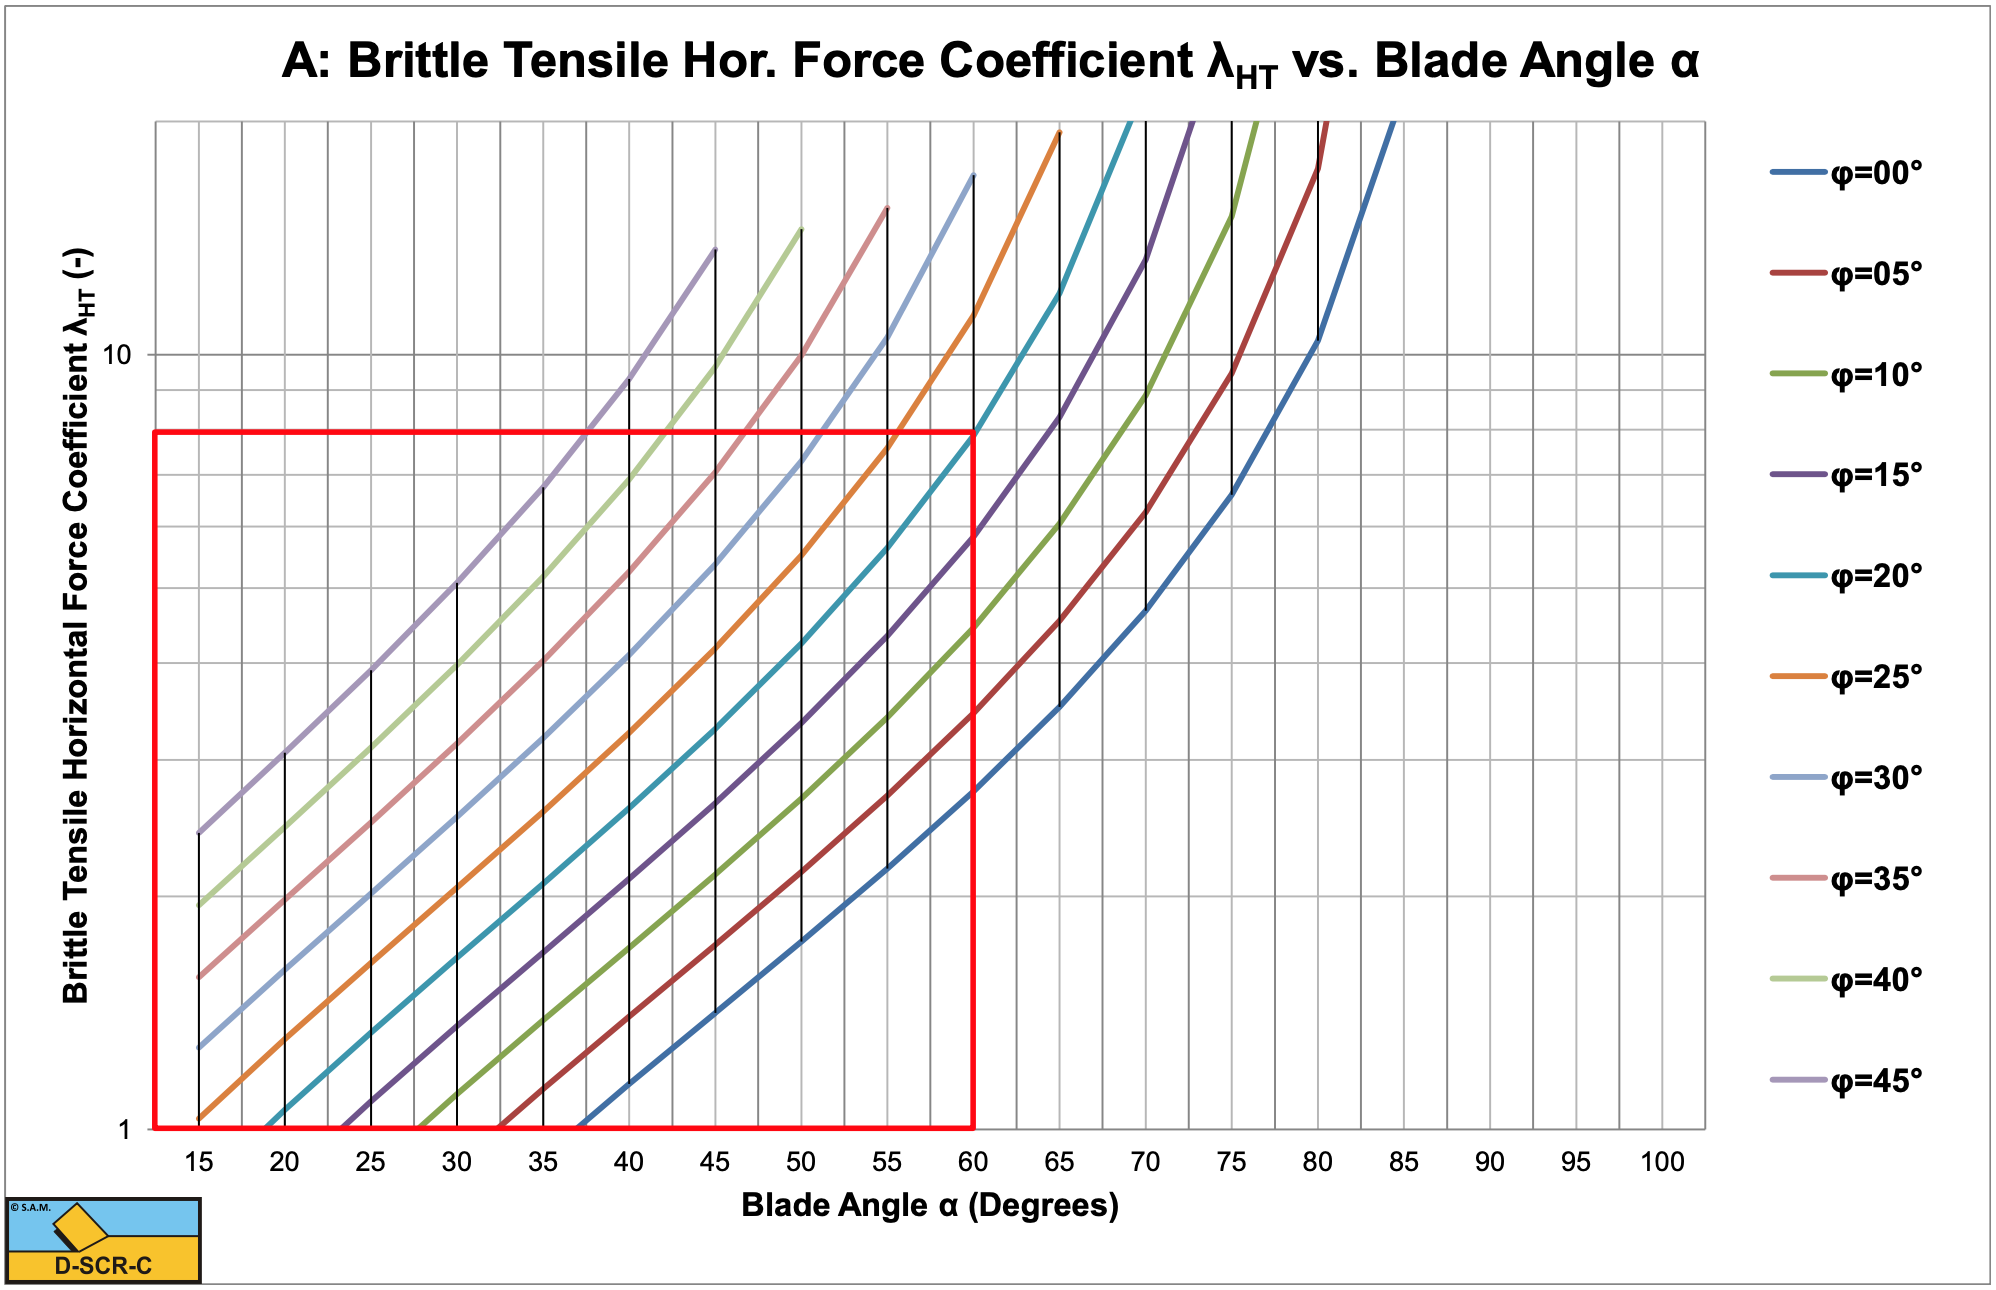
In all figures an example is given for a 60o blade and an internal friction angle of 20o.
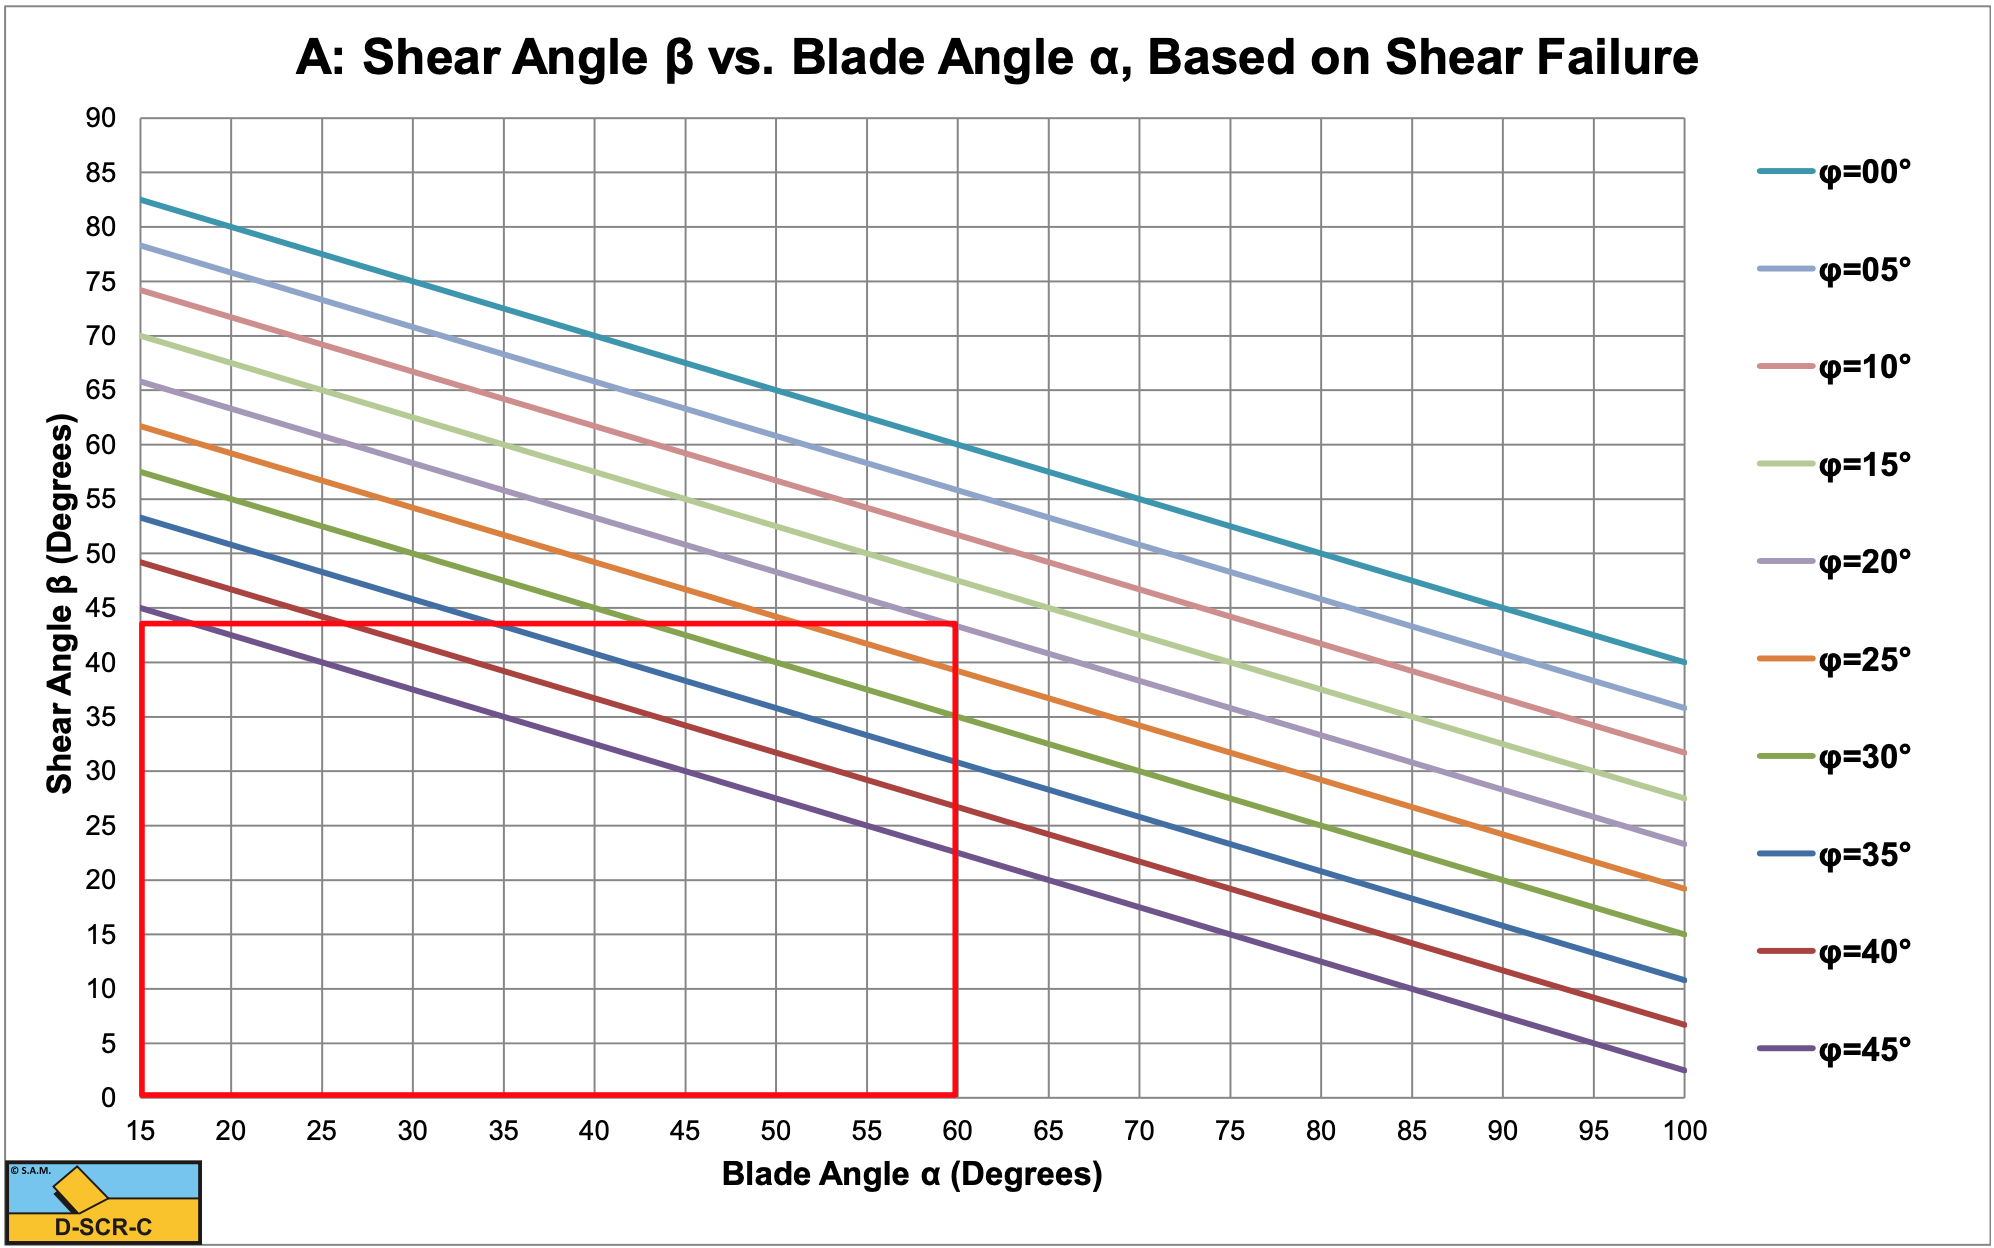
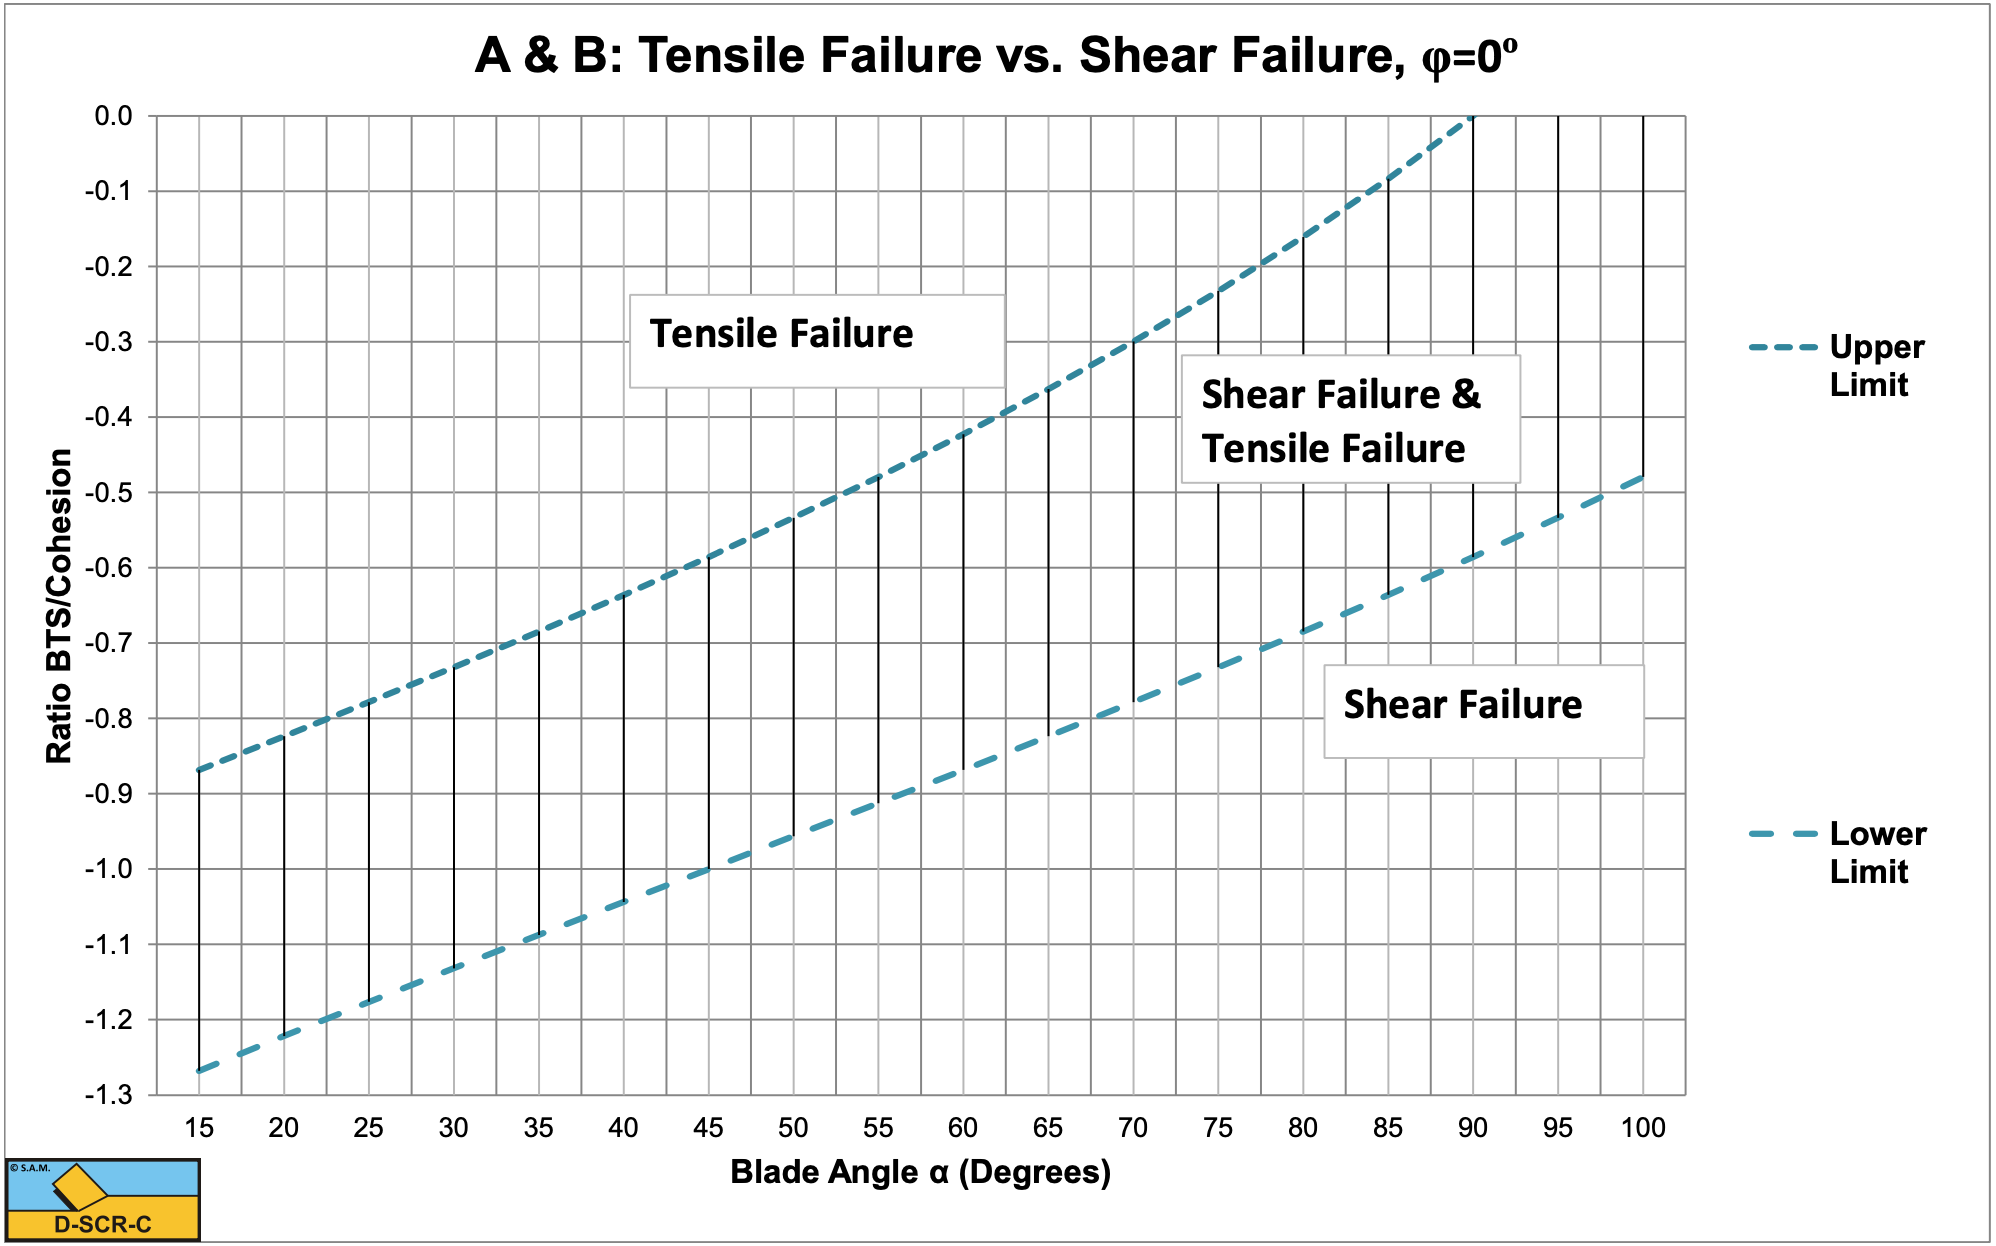
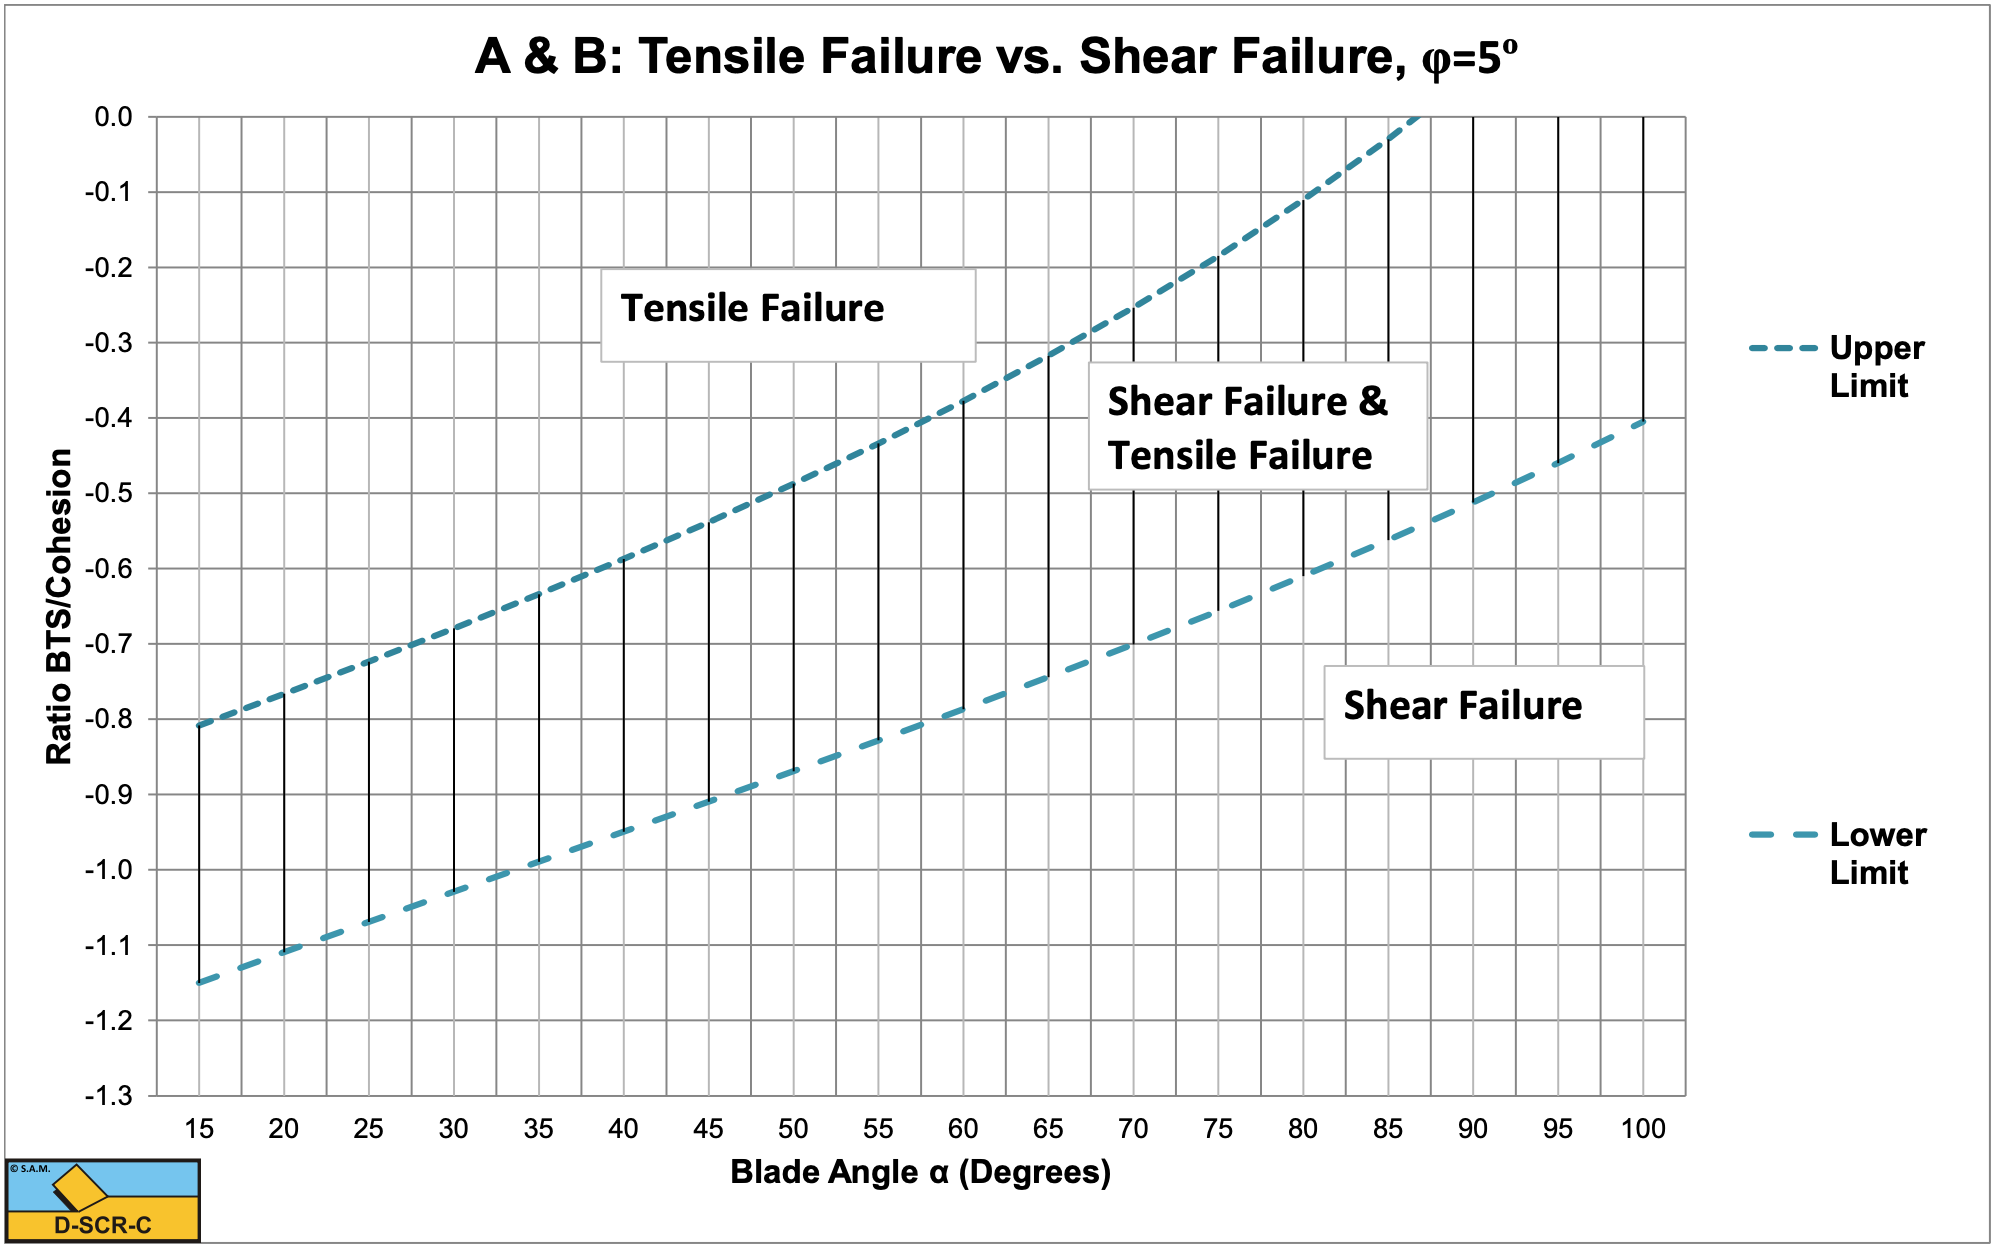
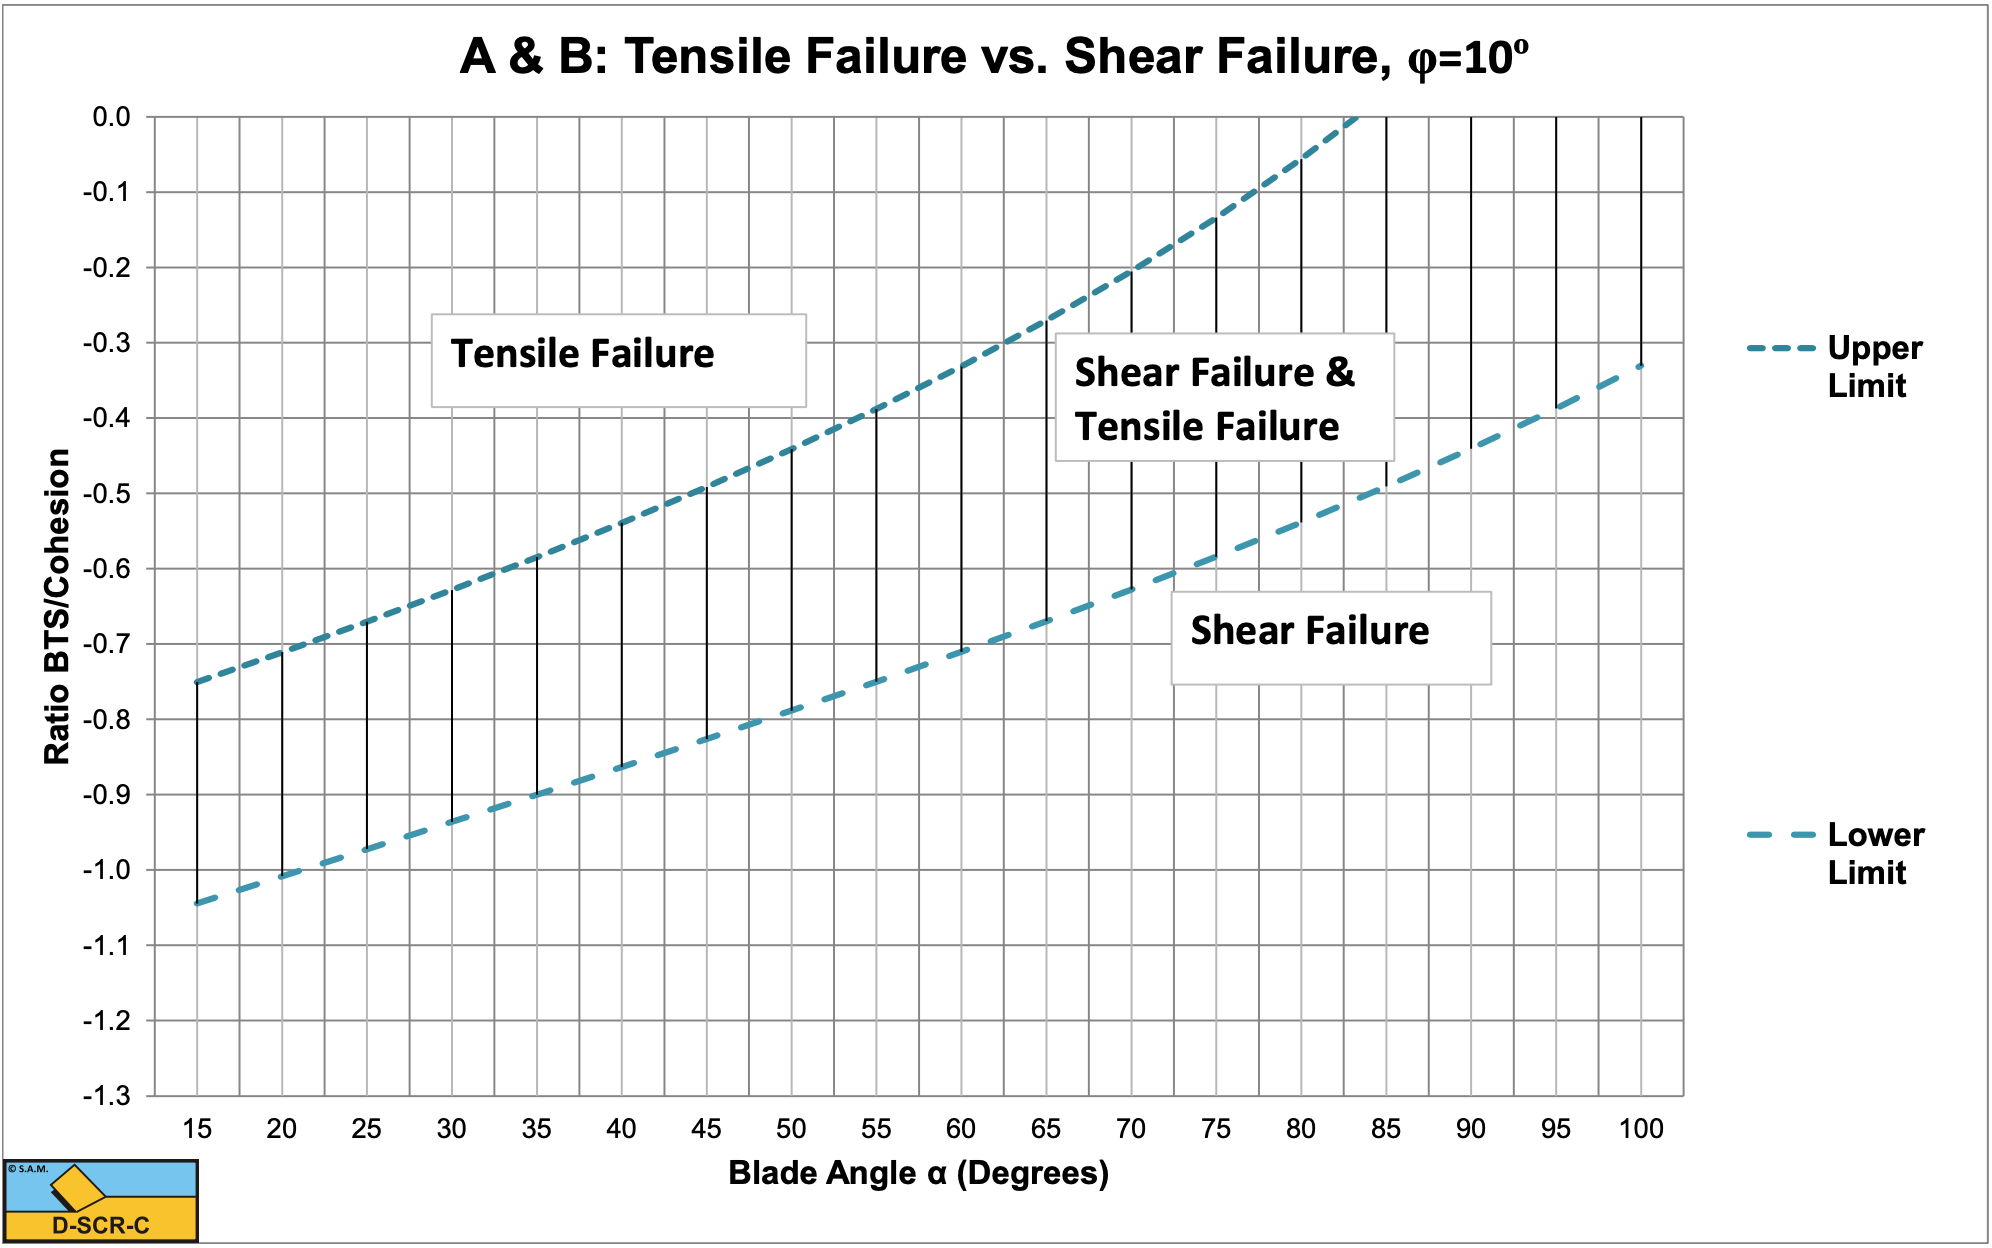
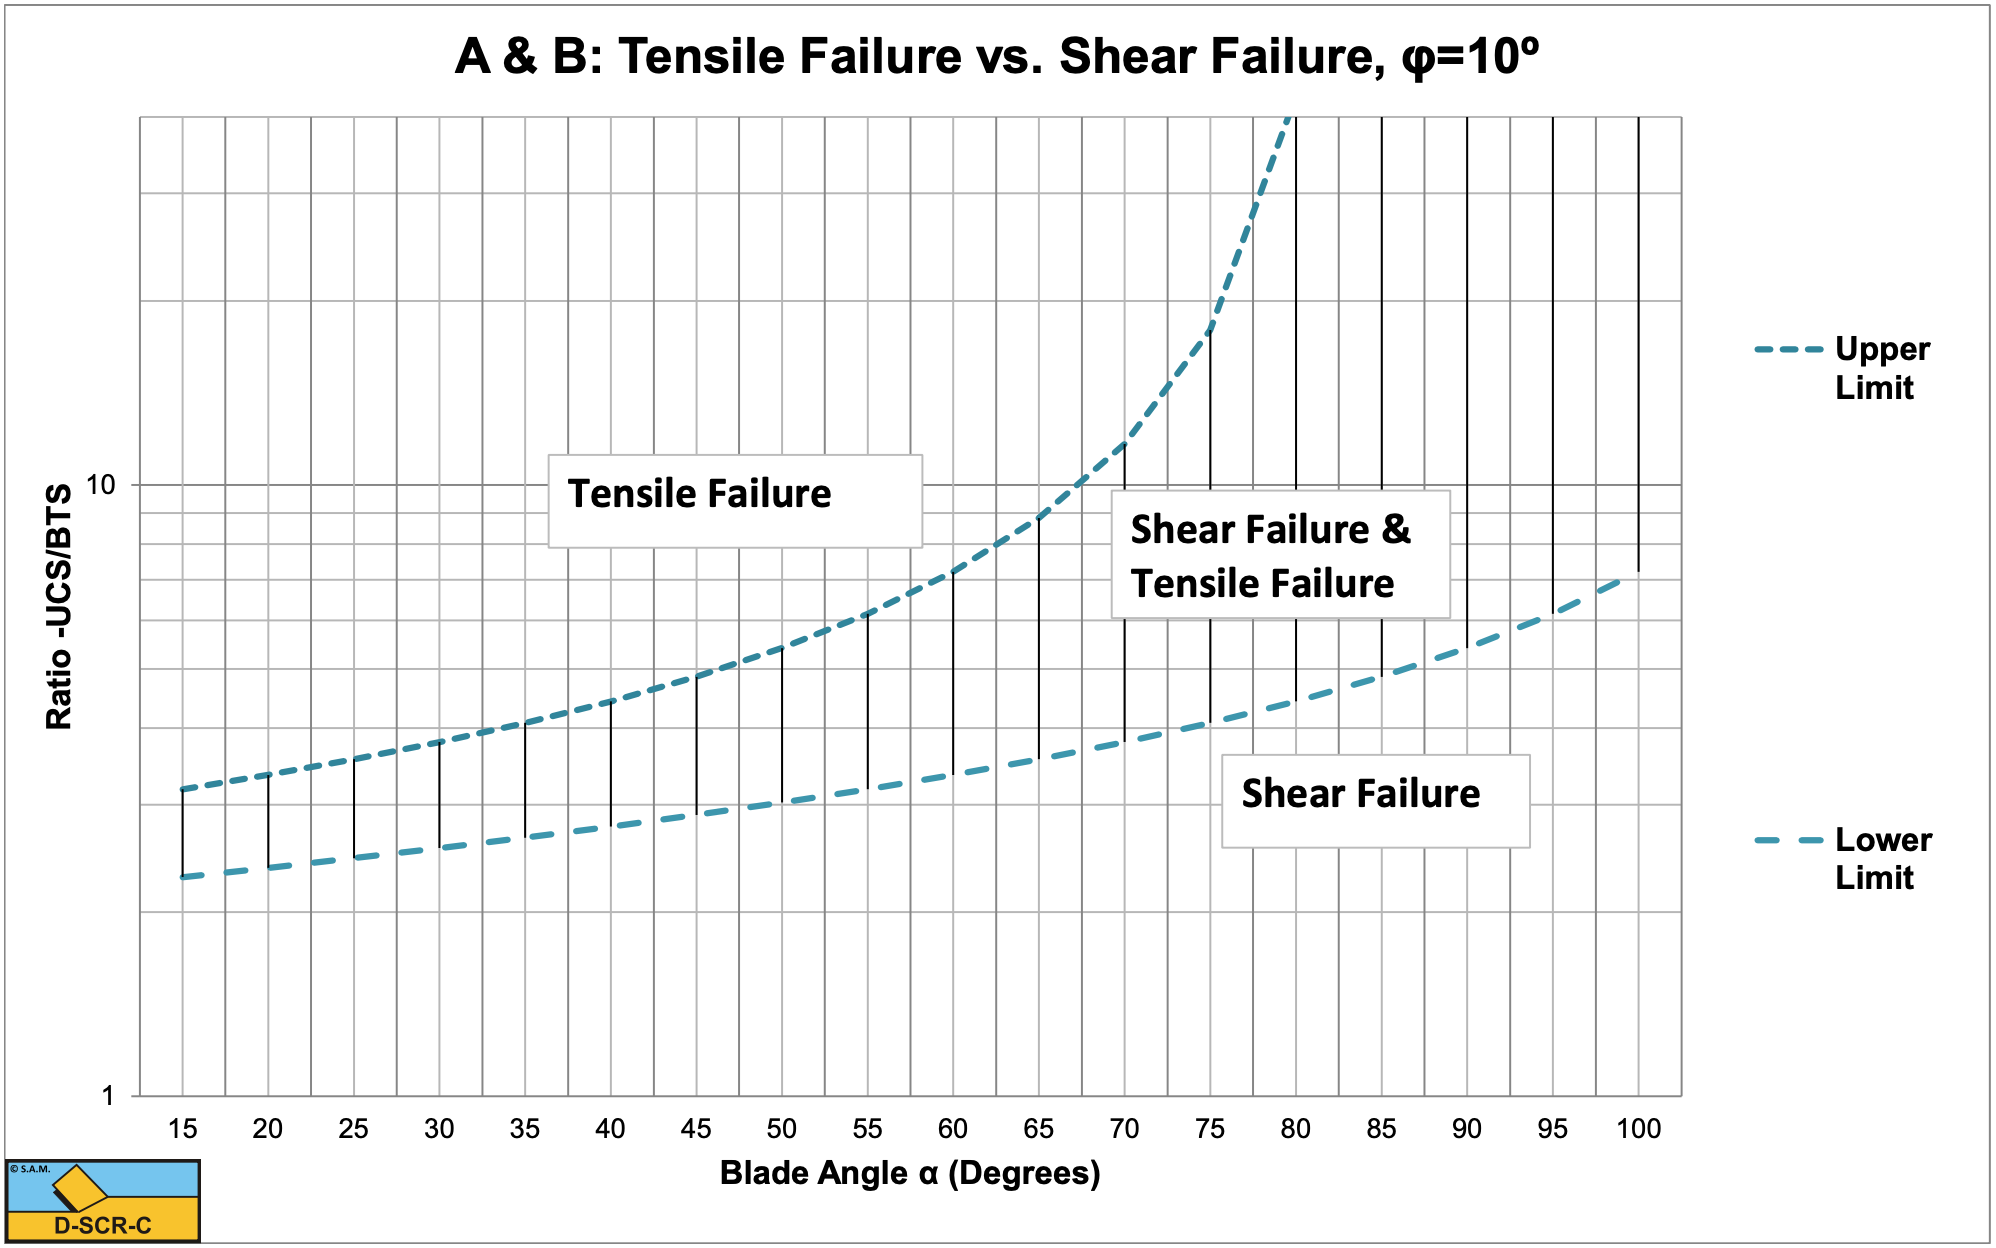
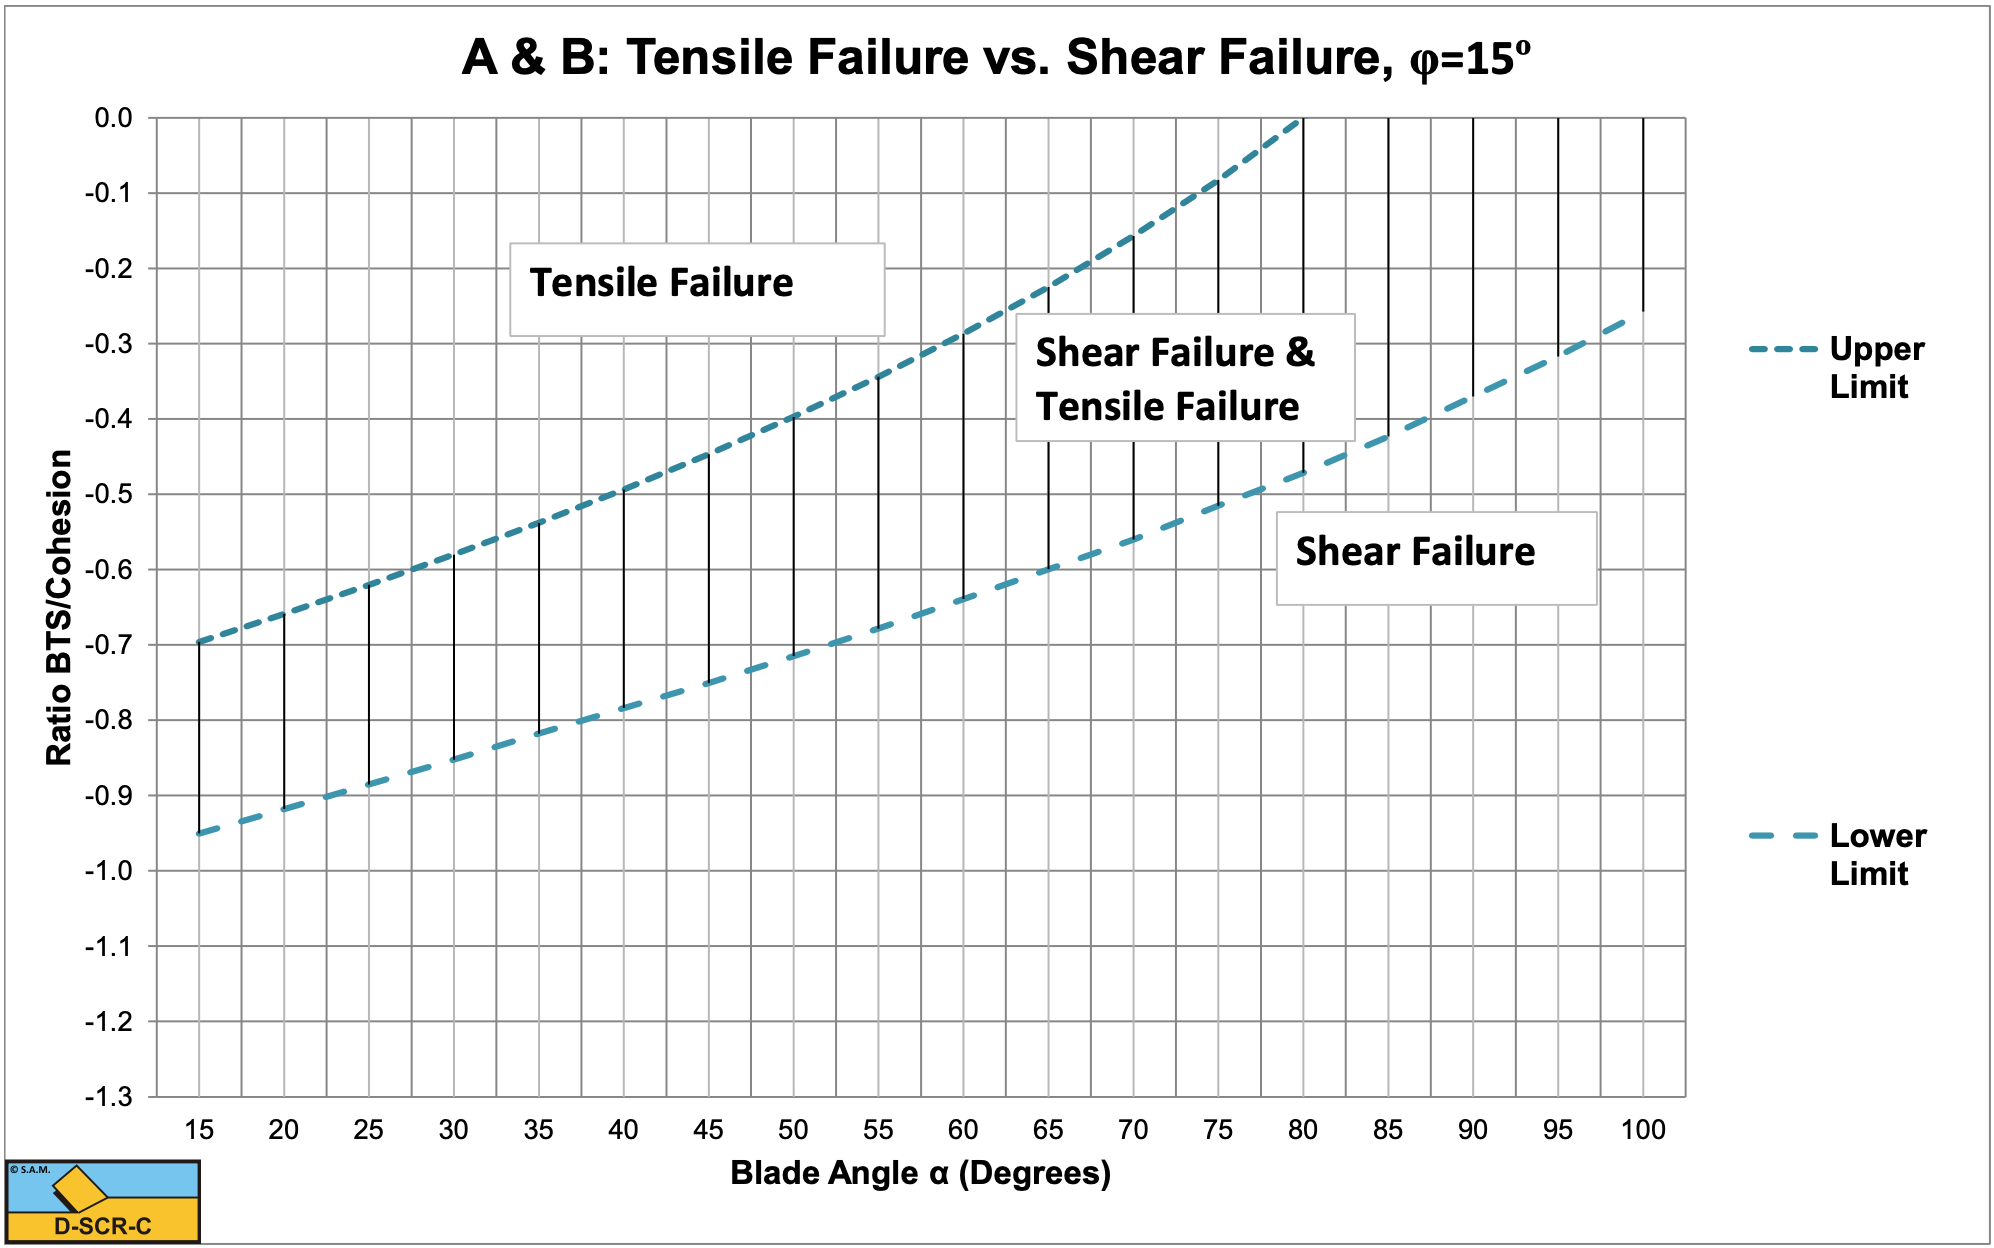
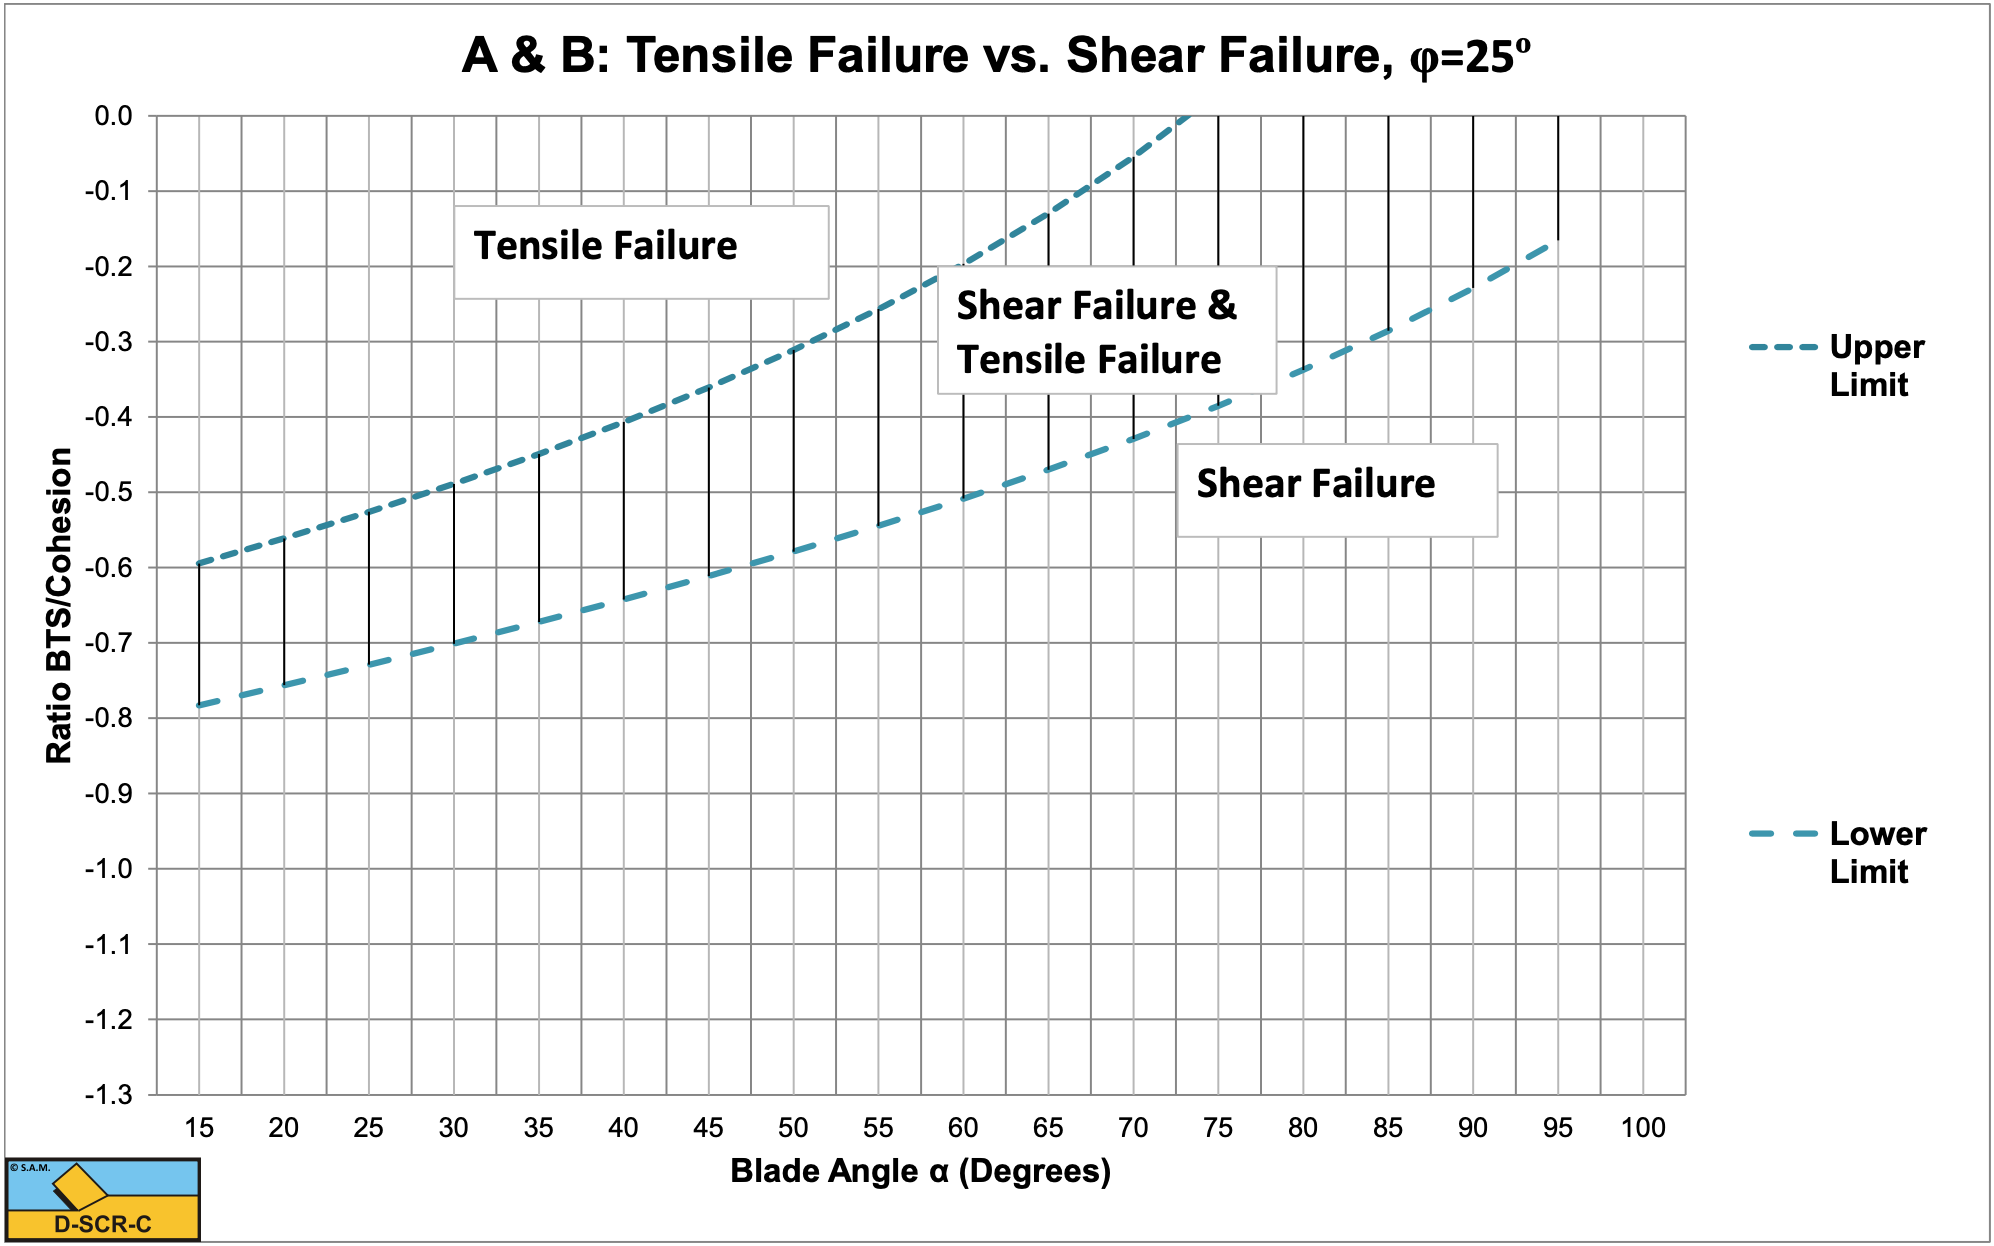
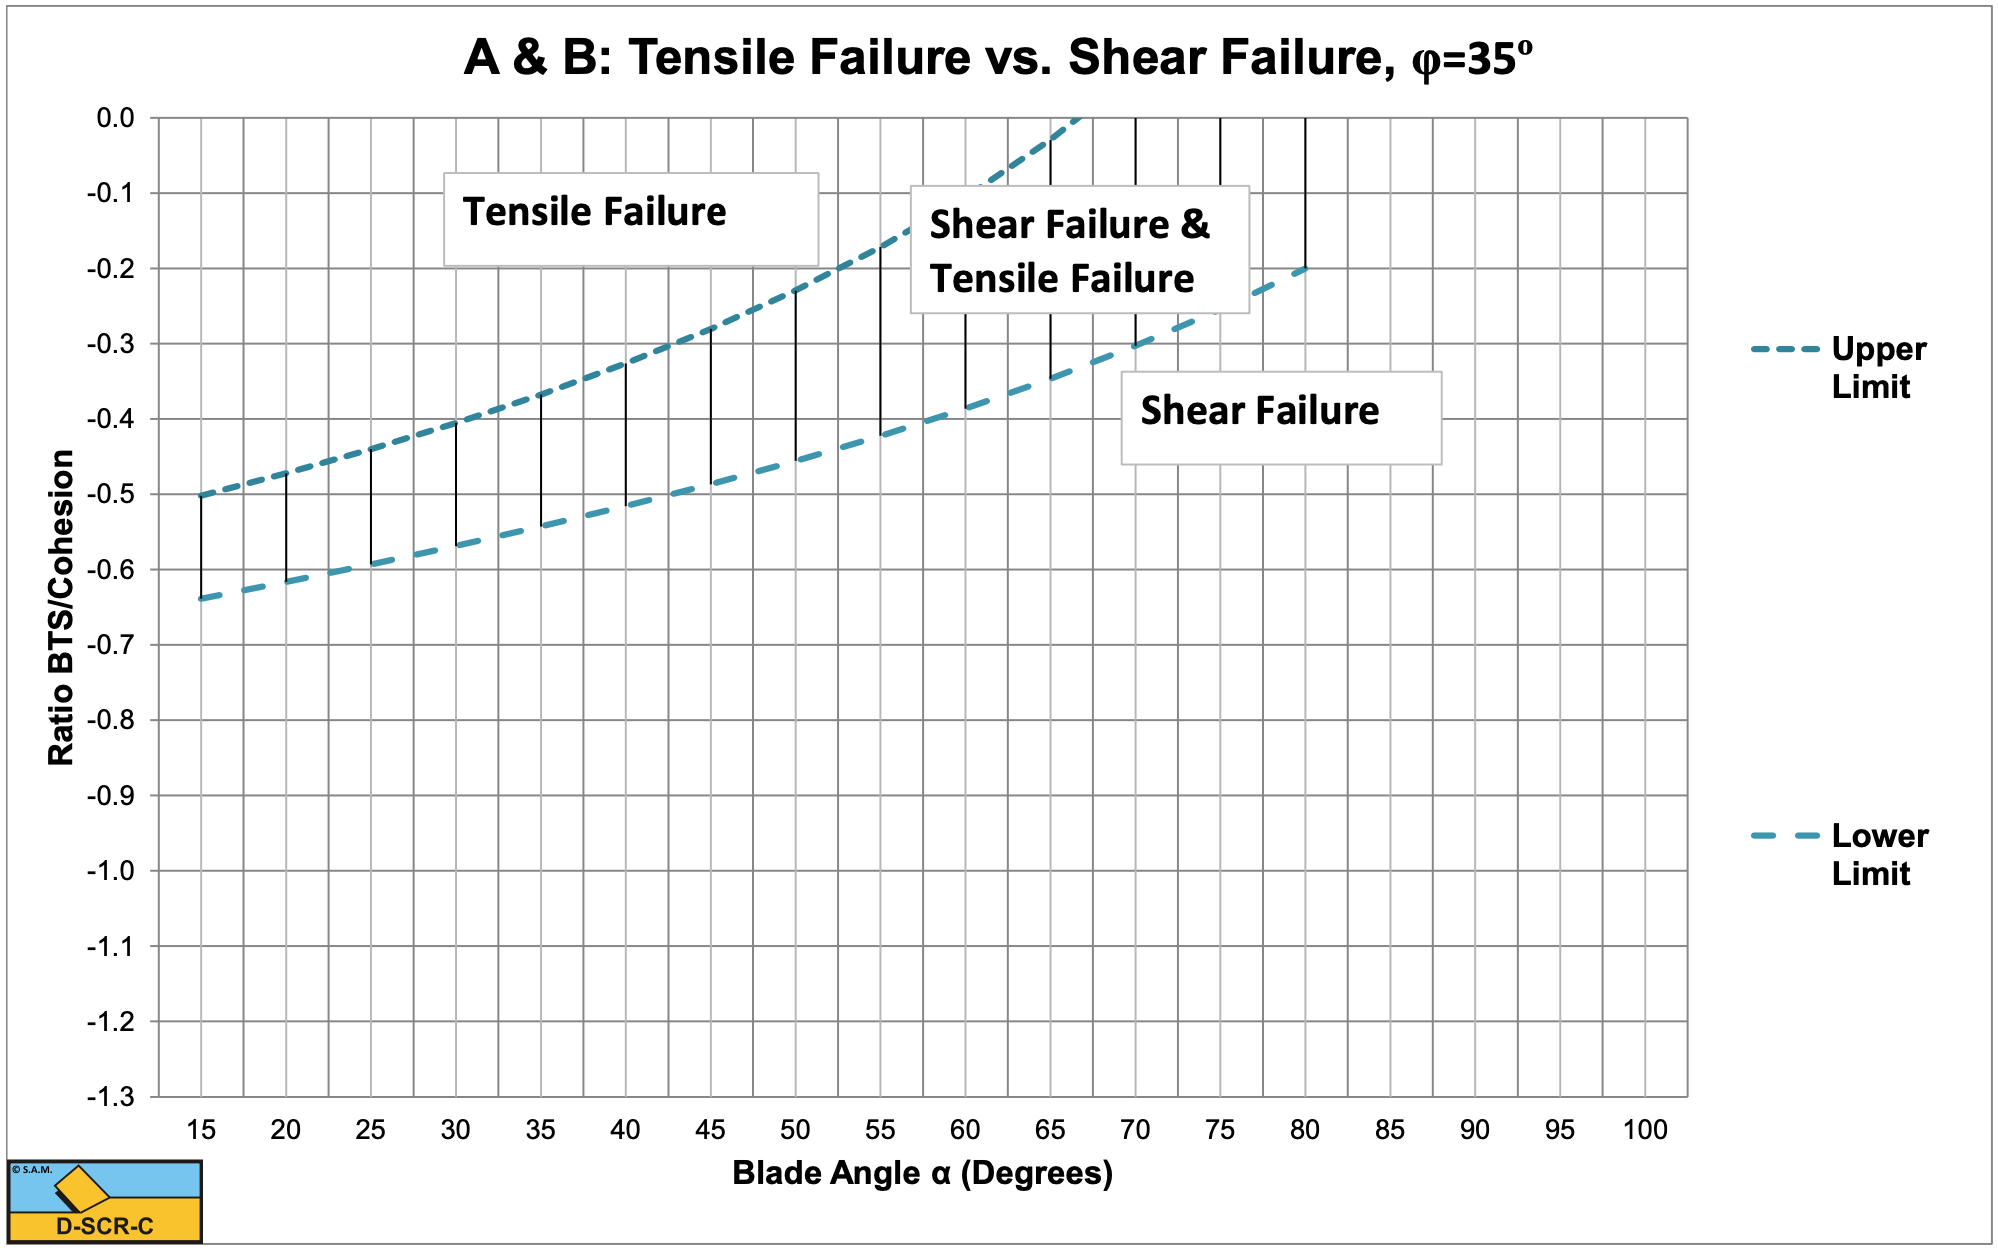
W.2 The Transition Brittle Shear/Brittle Tensile A
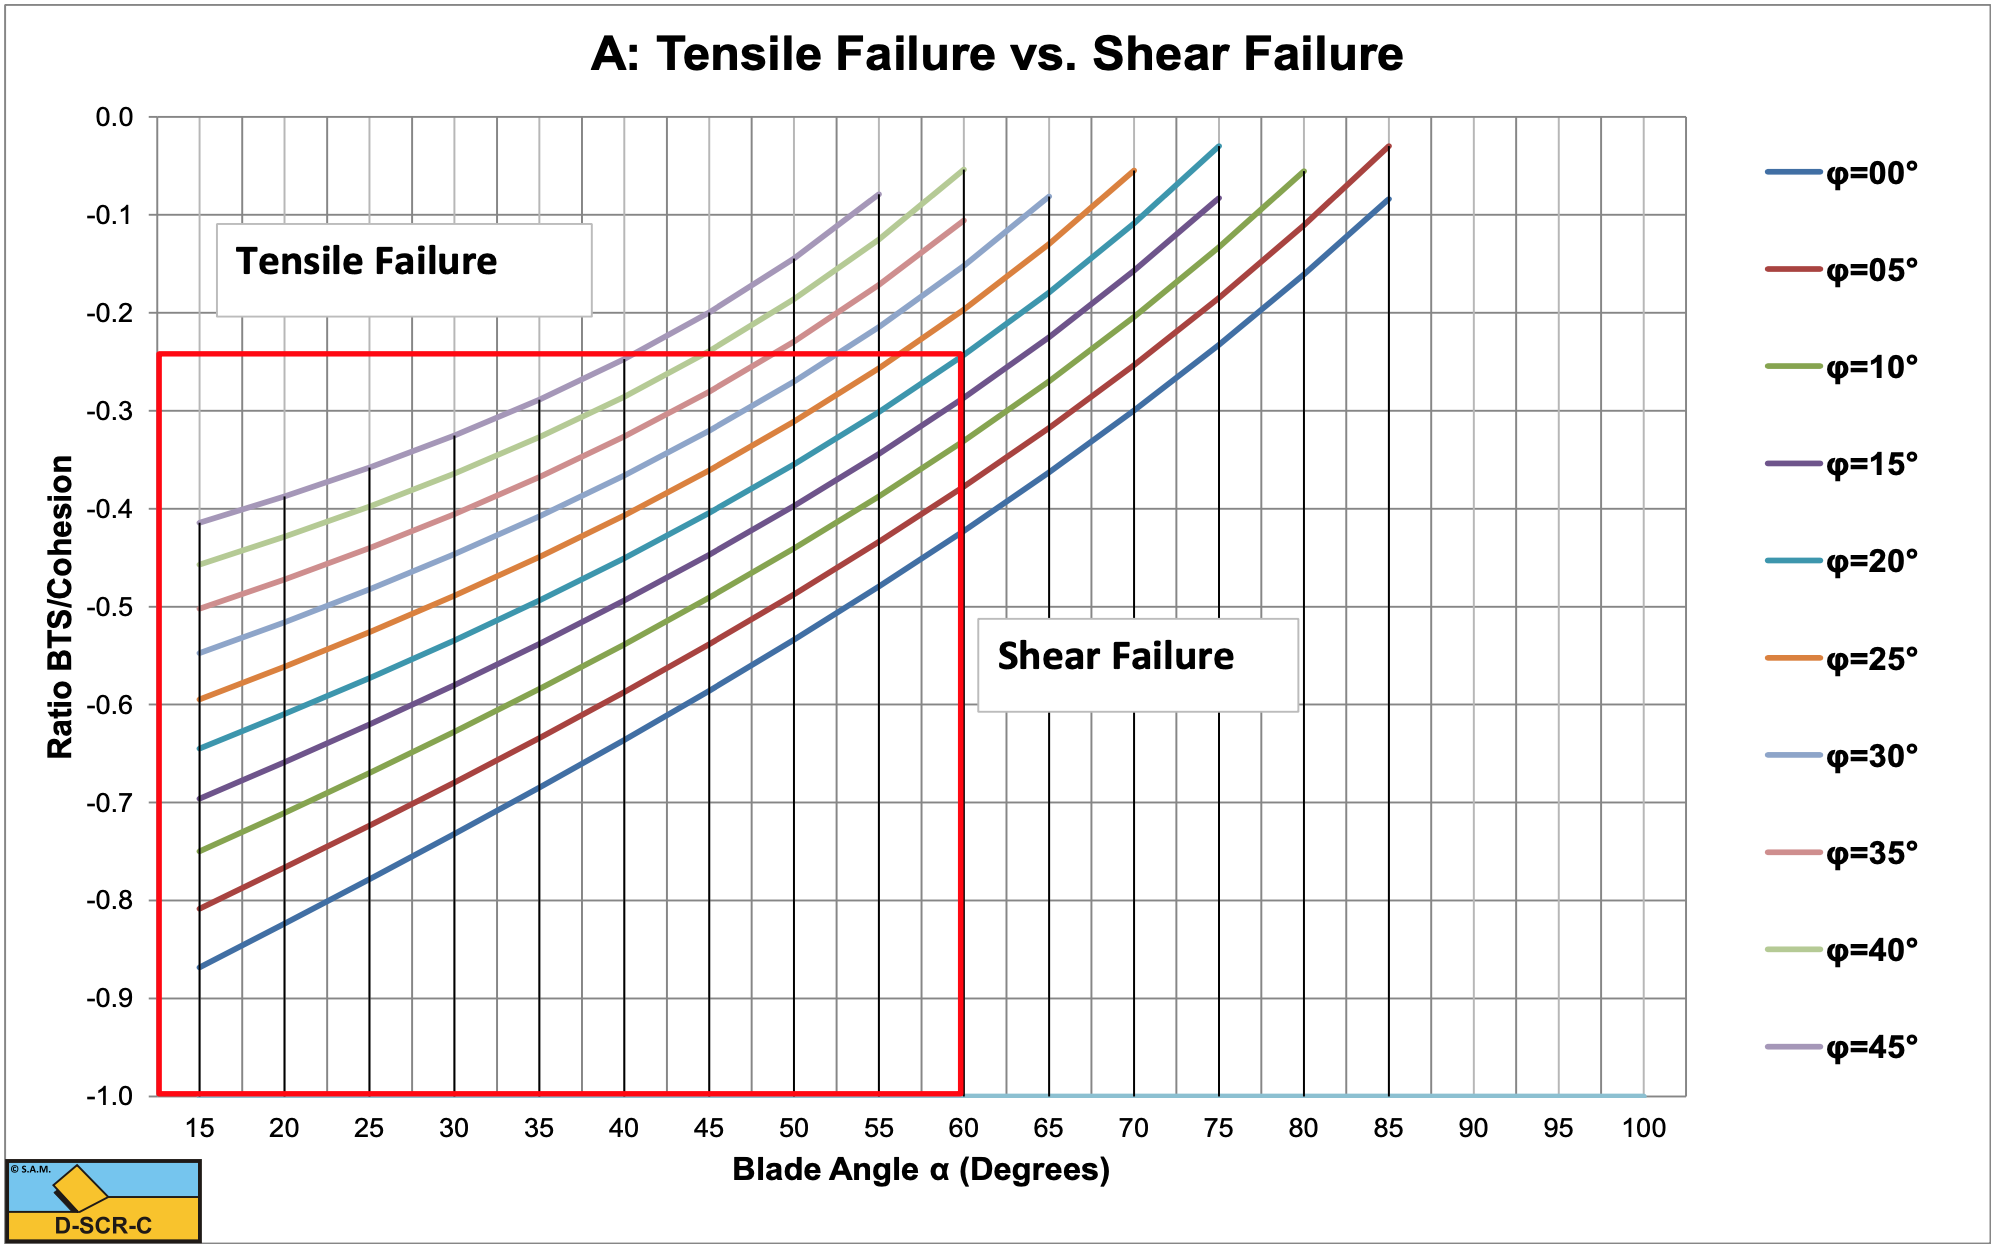
Below the lines the cutting process is subject to shear failure, above the lines to tensile failure. The curves are based on the shear angle resulting from shear failure.
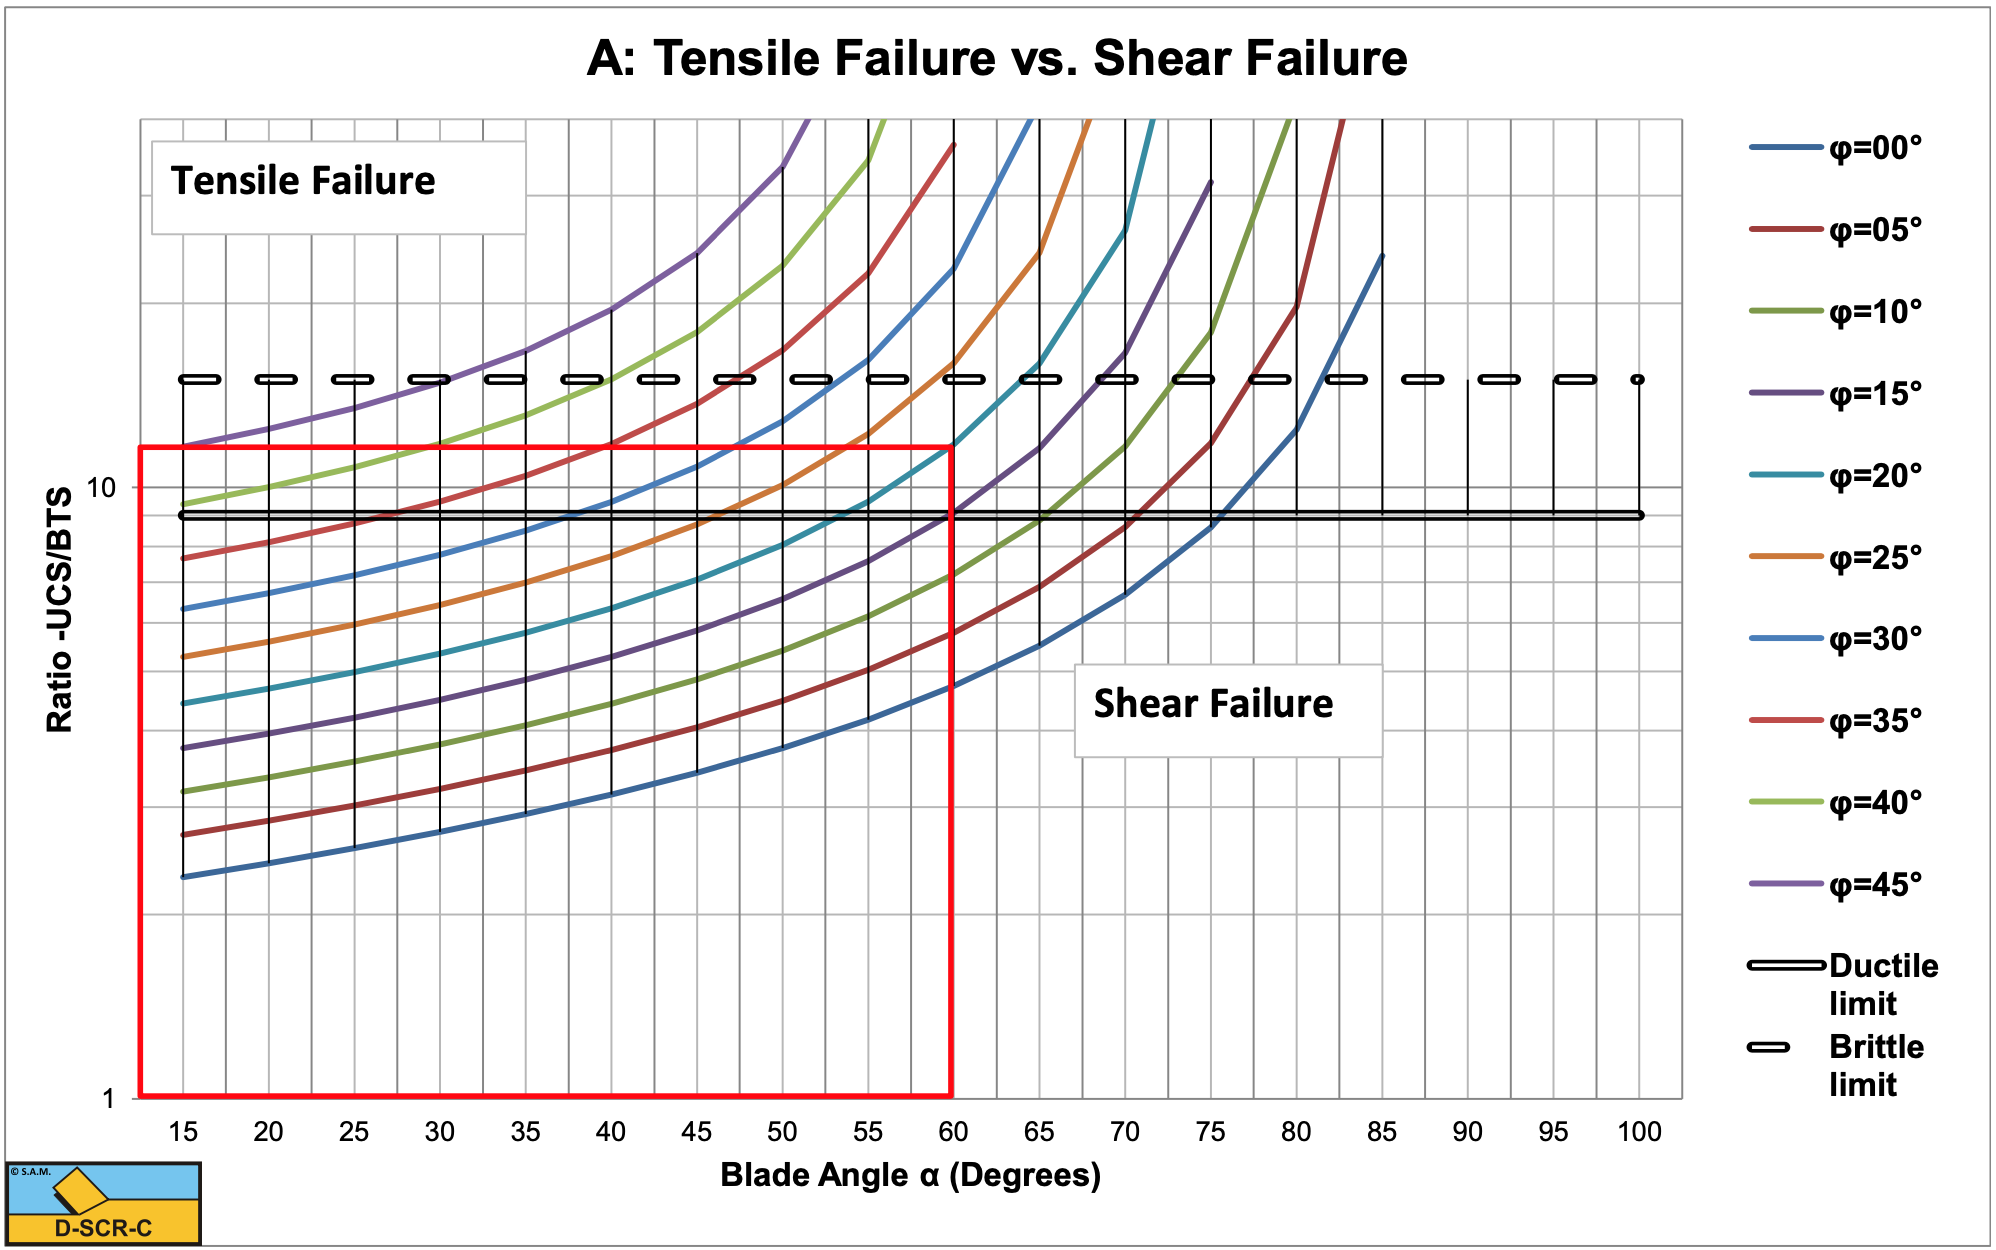
In all figures an example is given for a 60o blade and an internal friction angle of 20o.
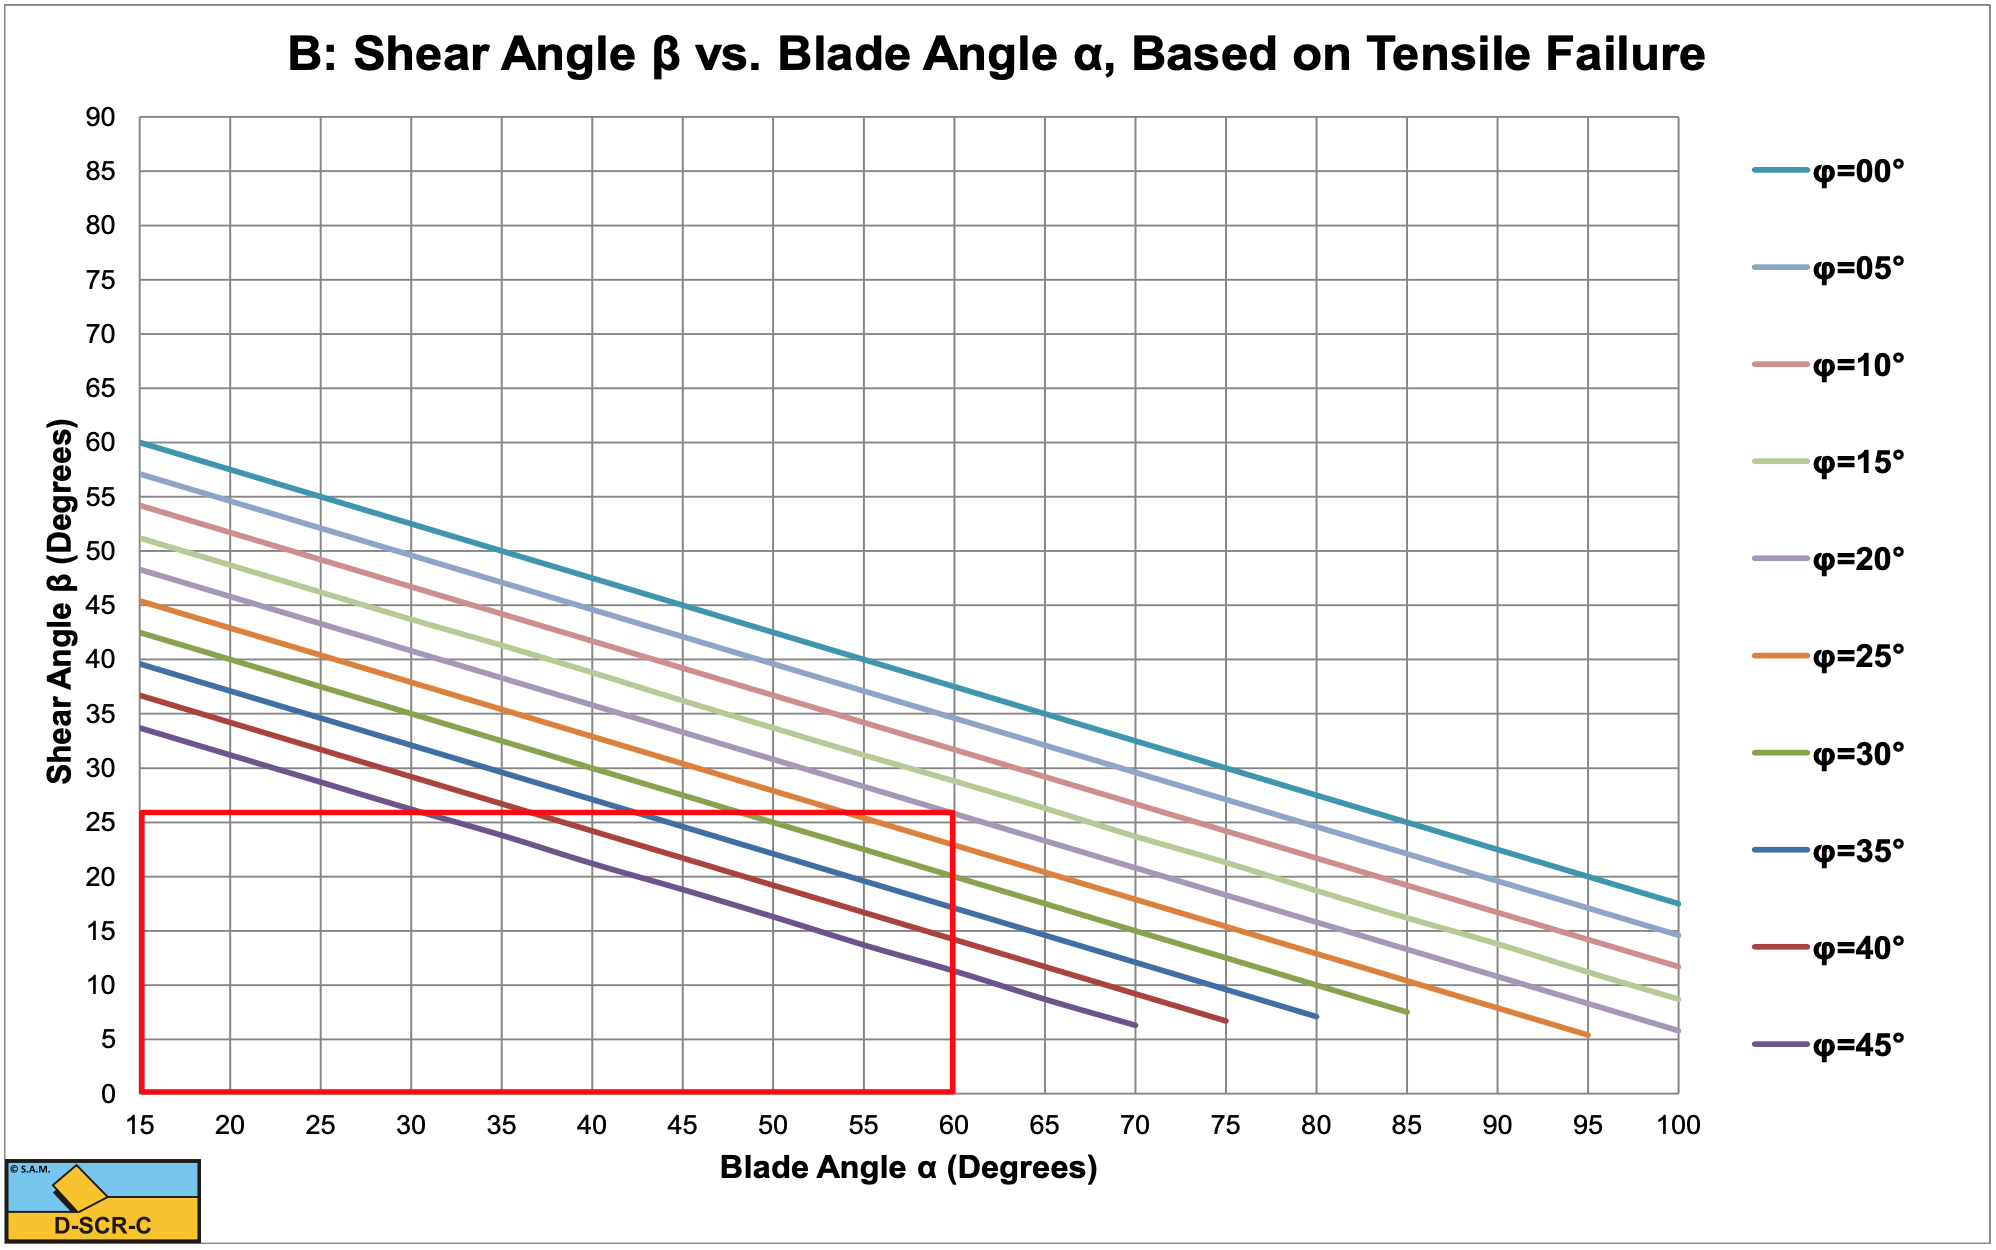
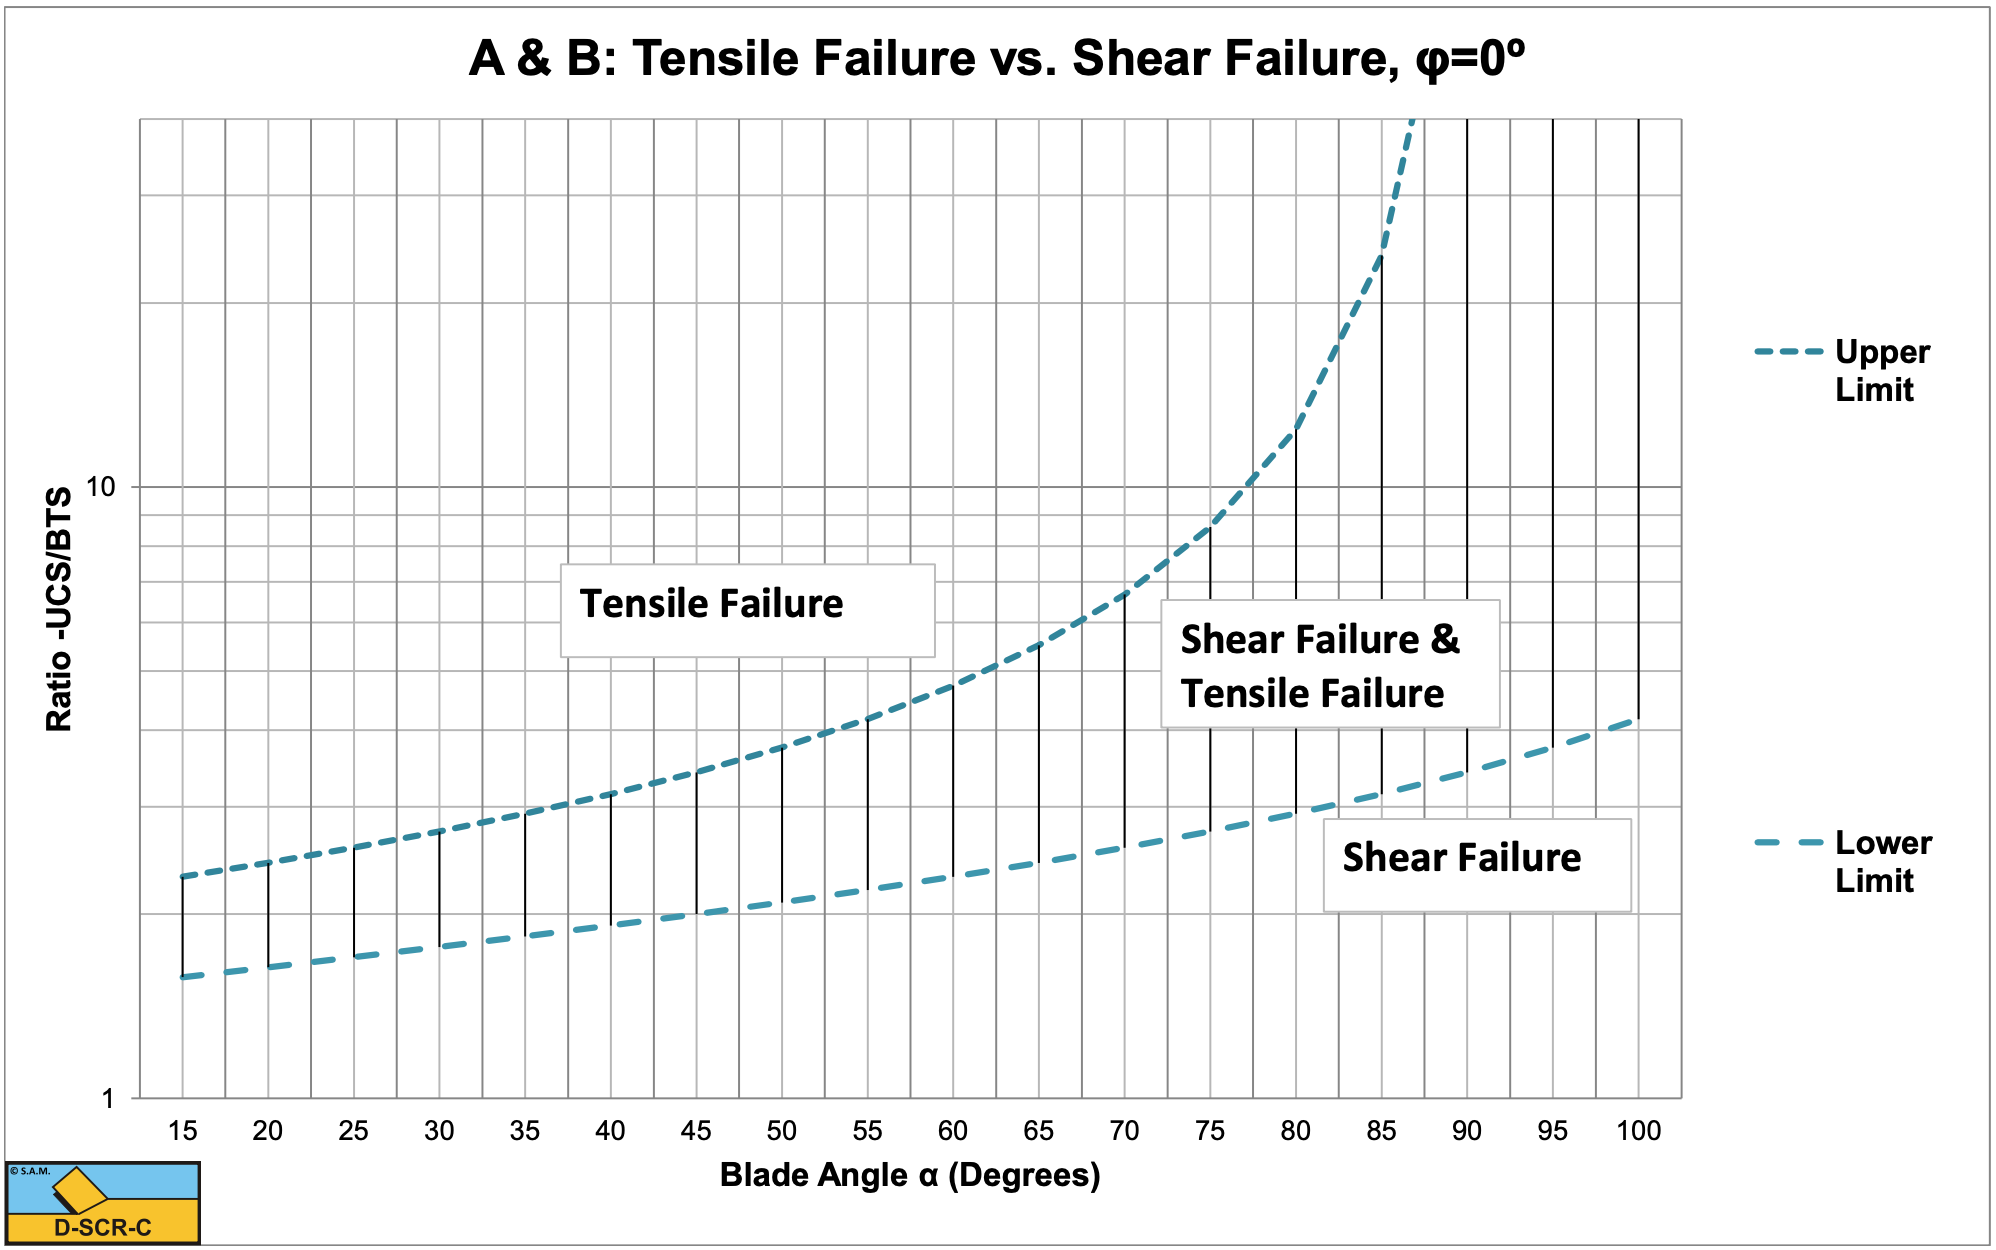
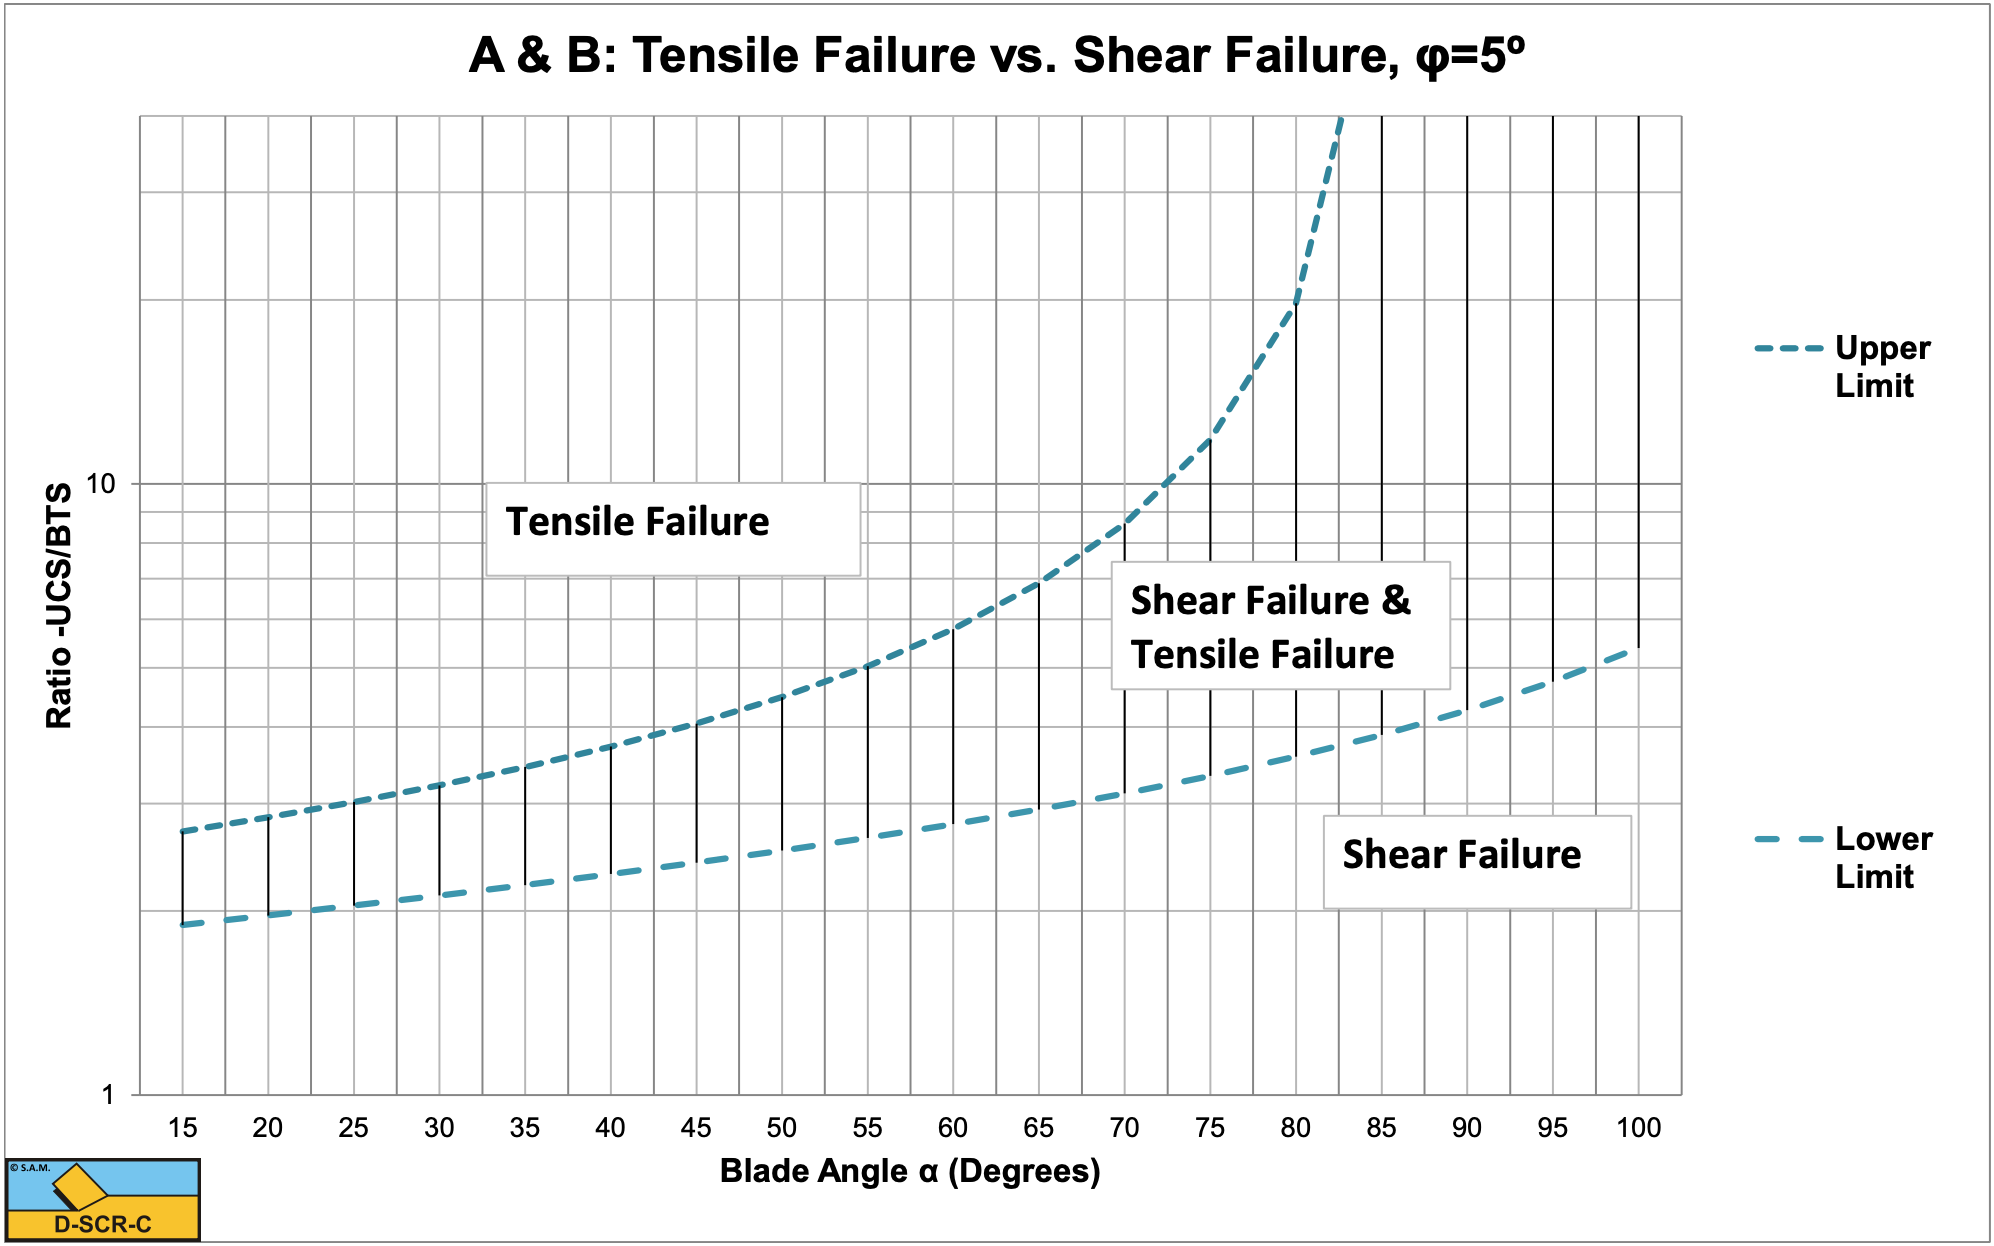
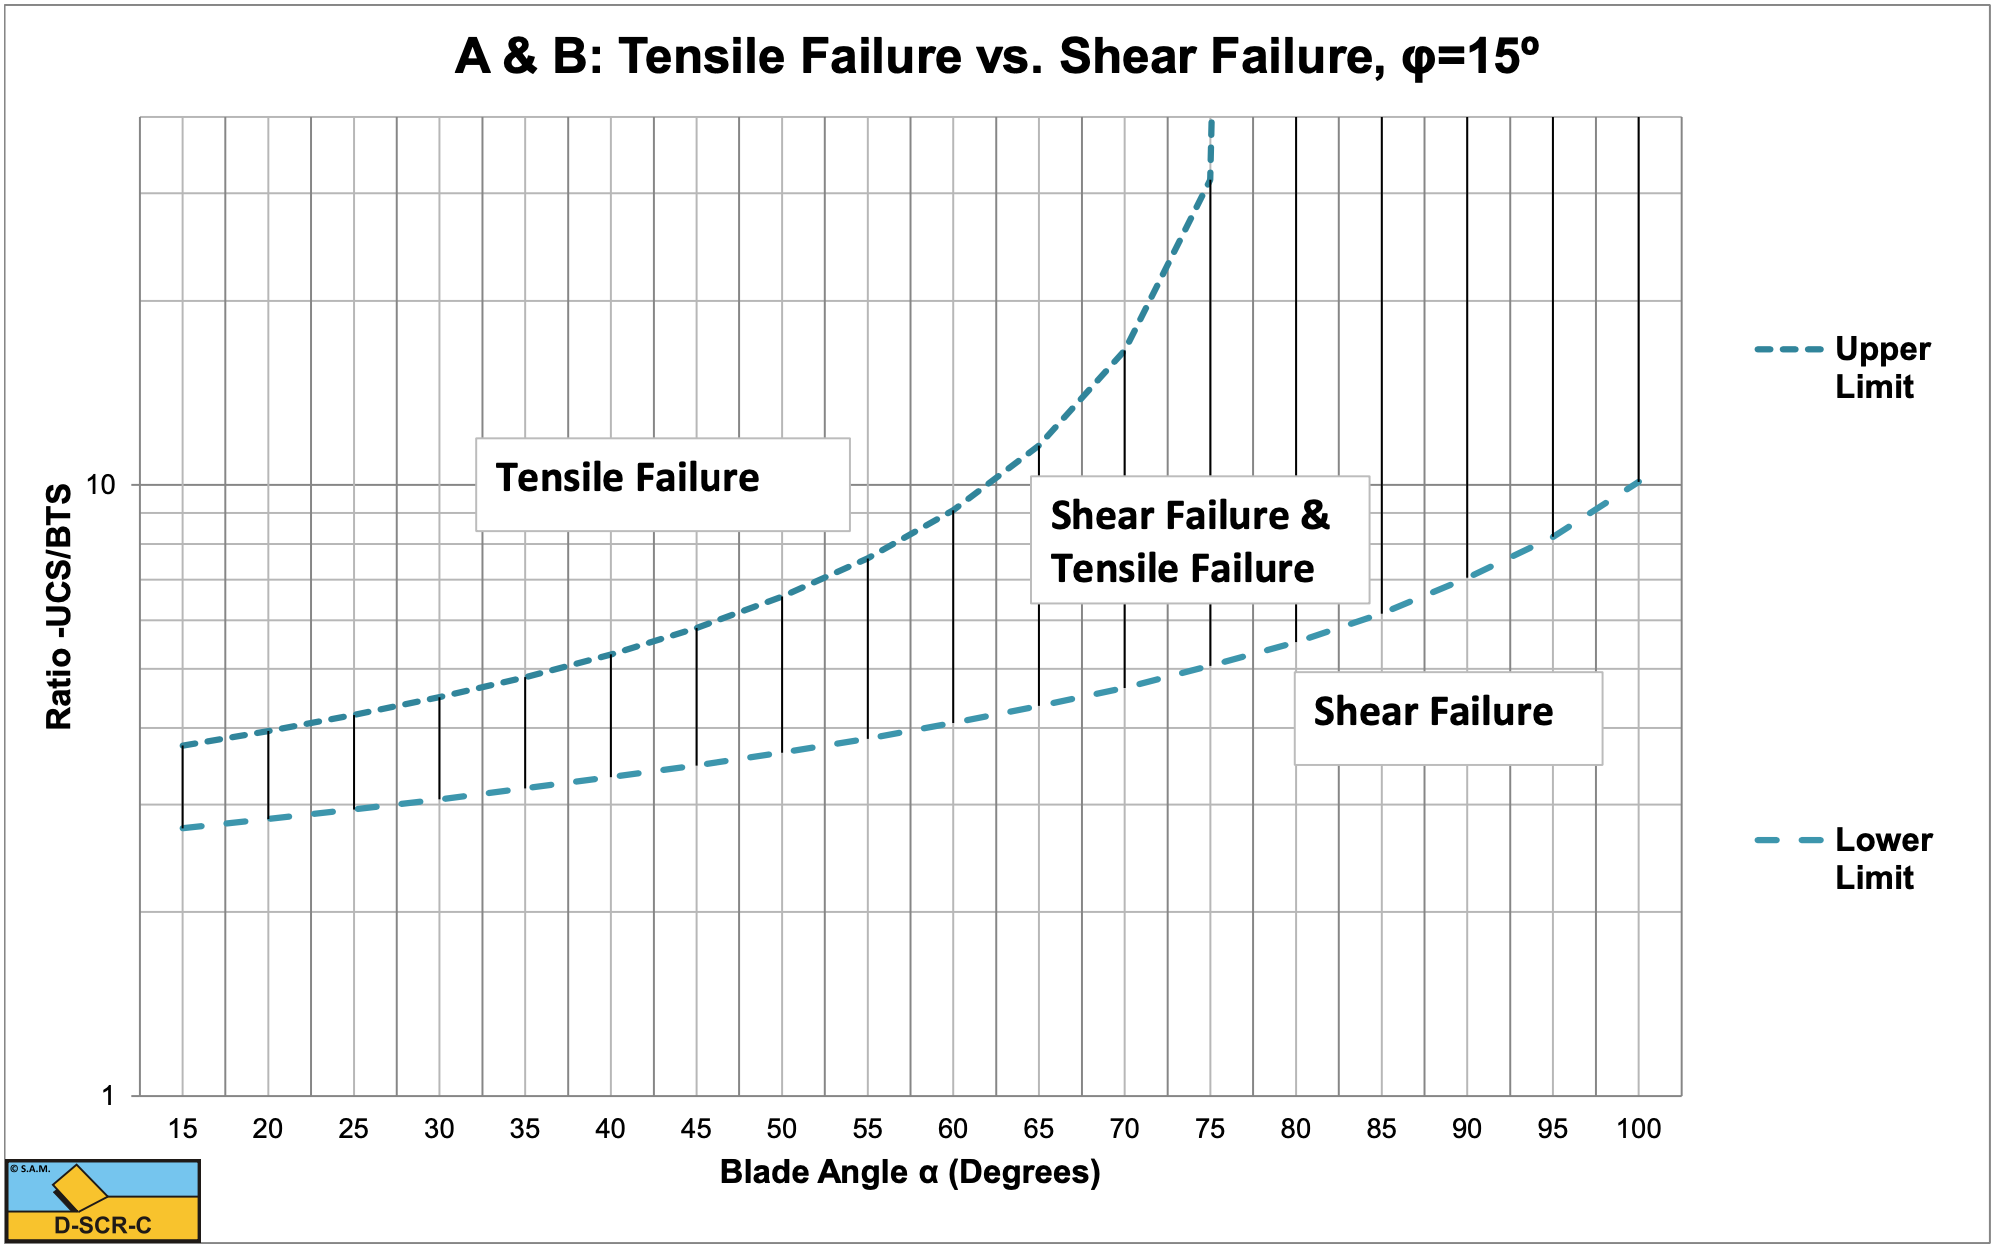
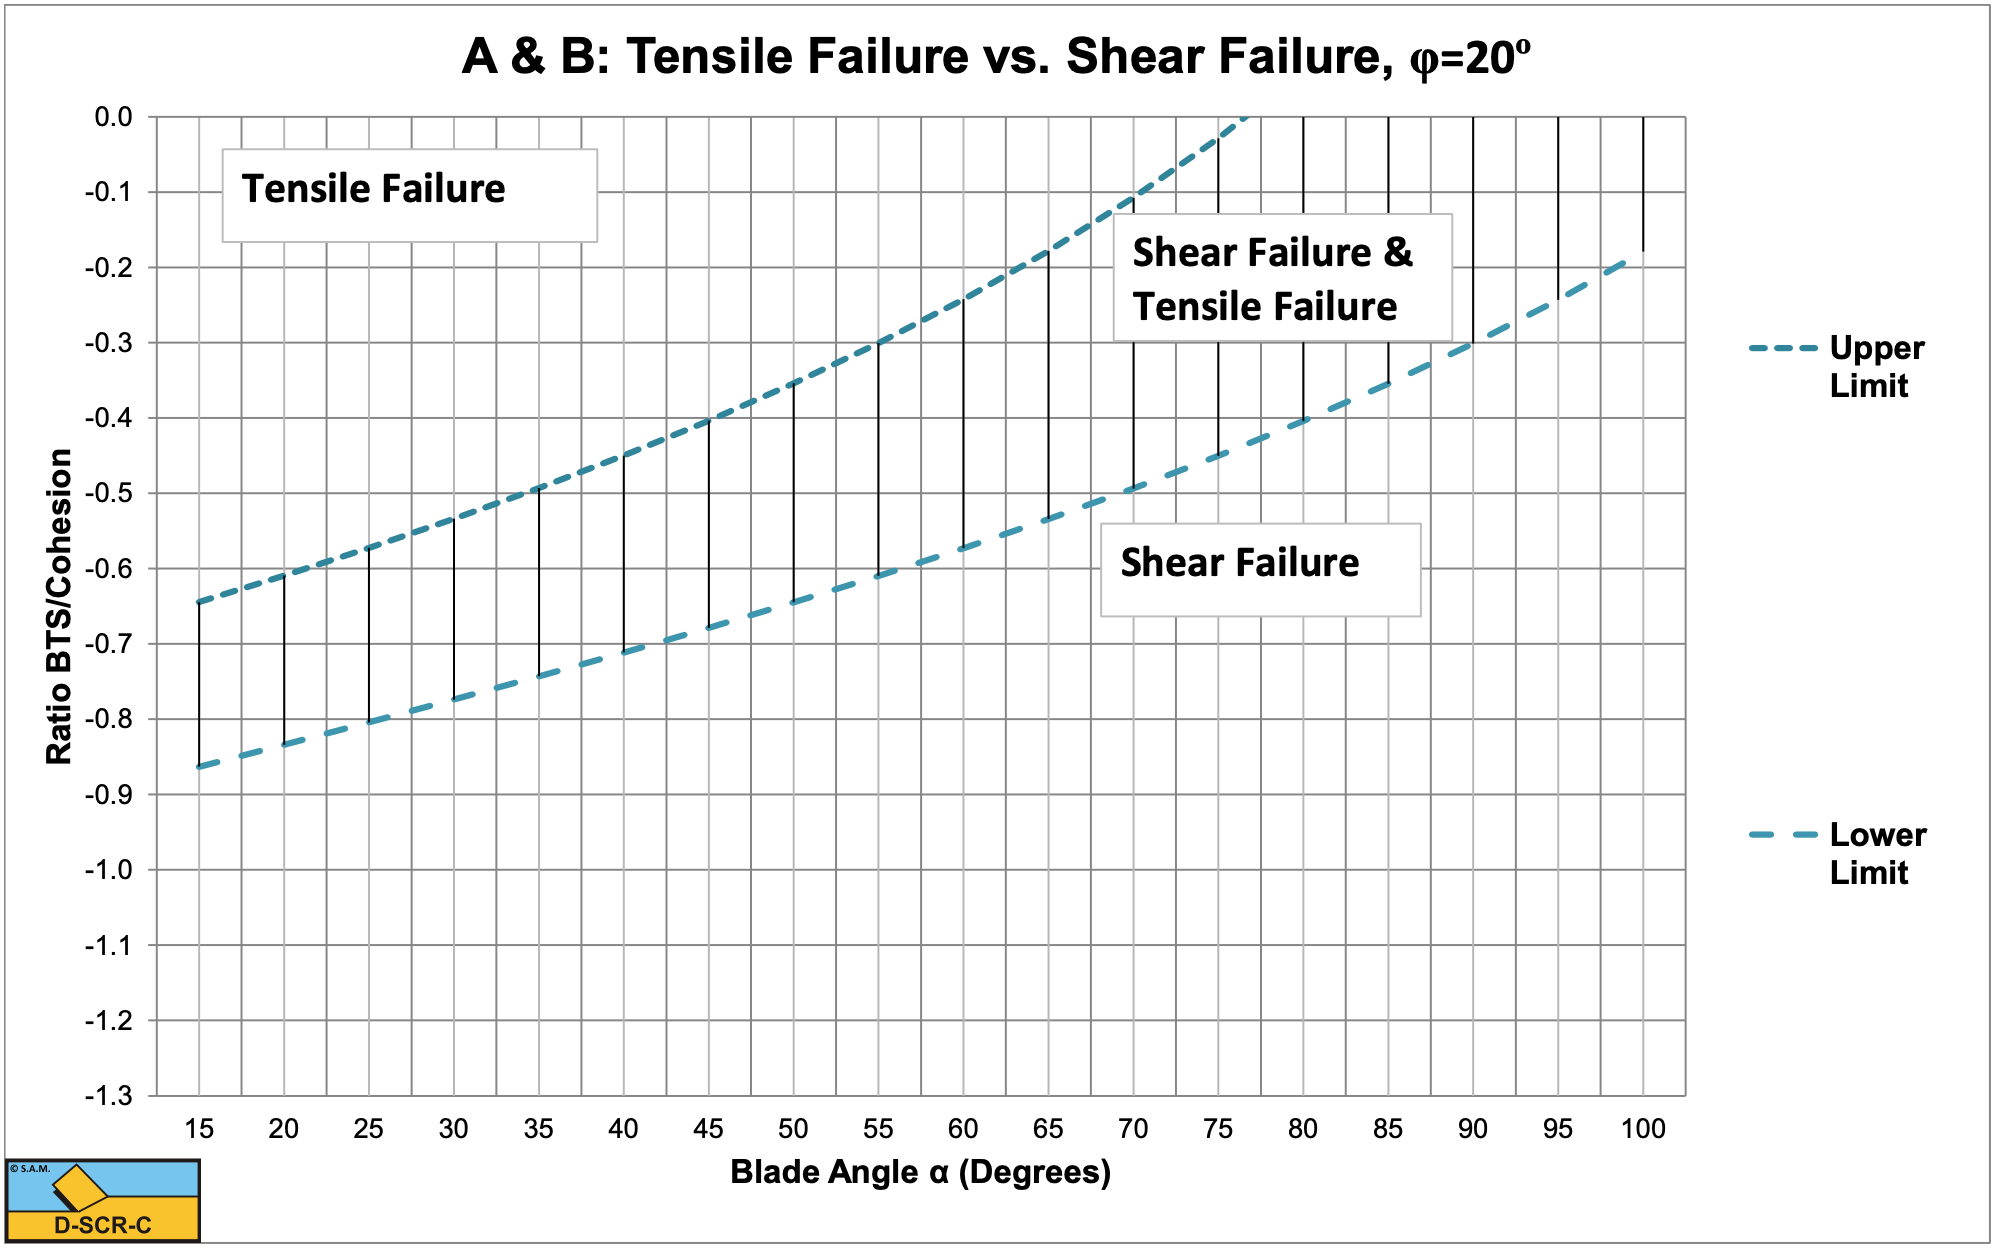
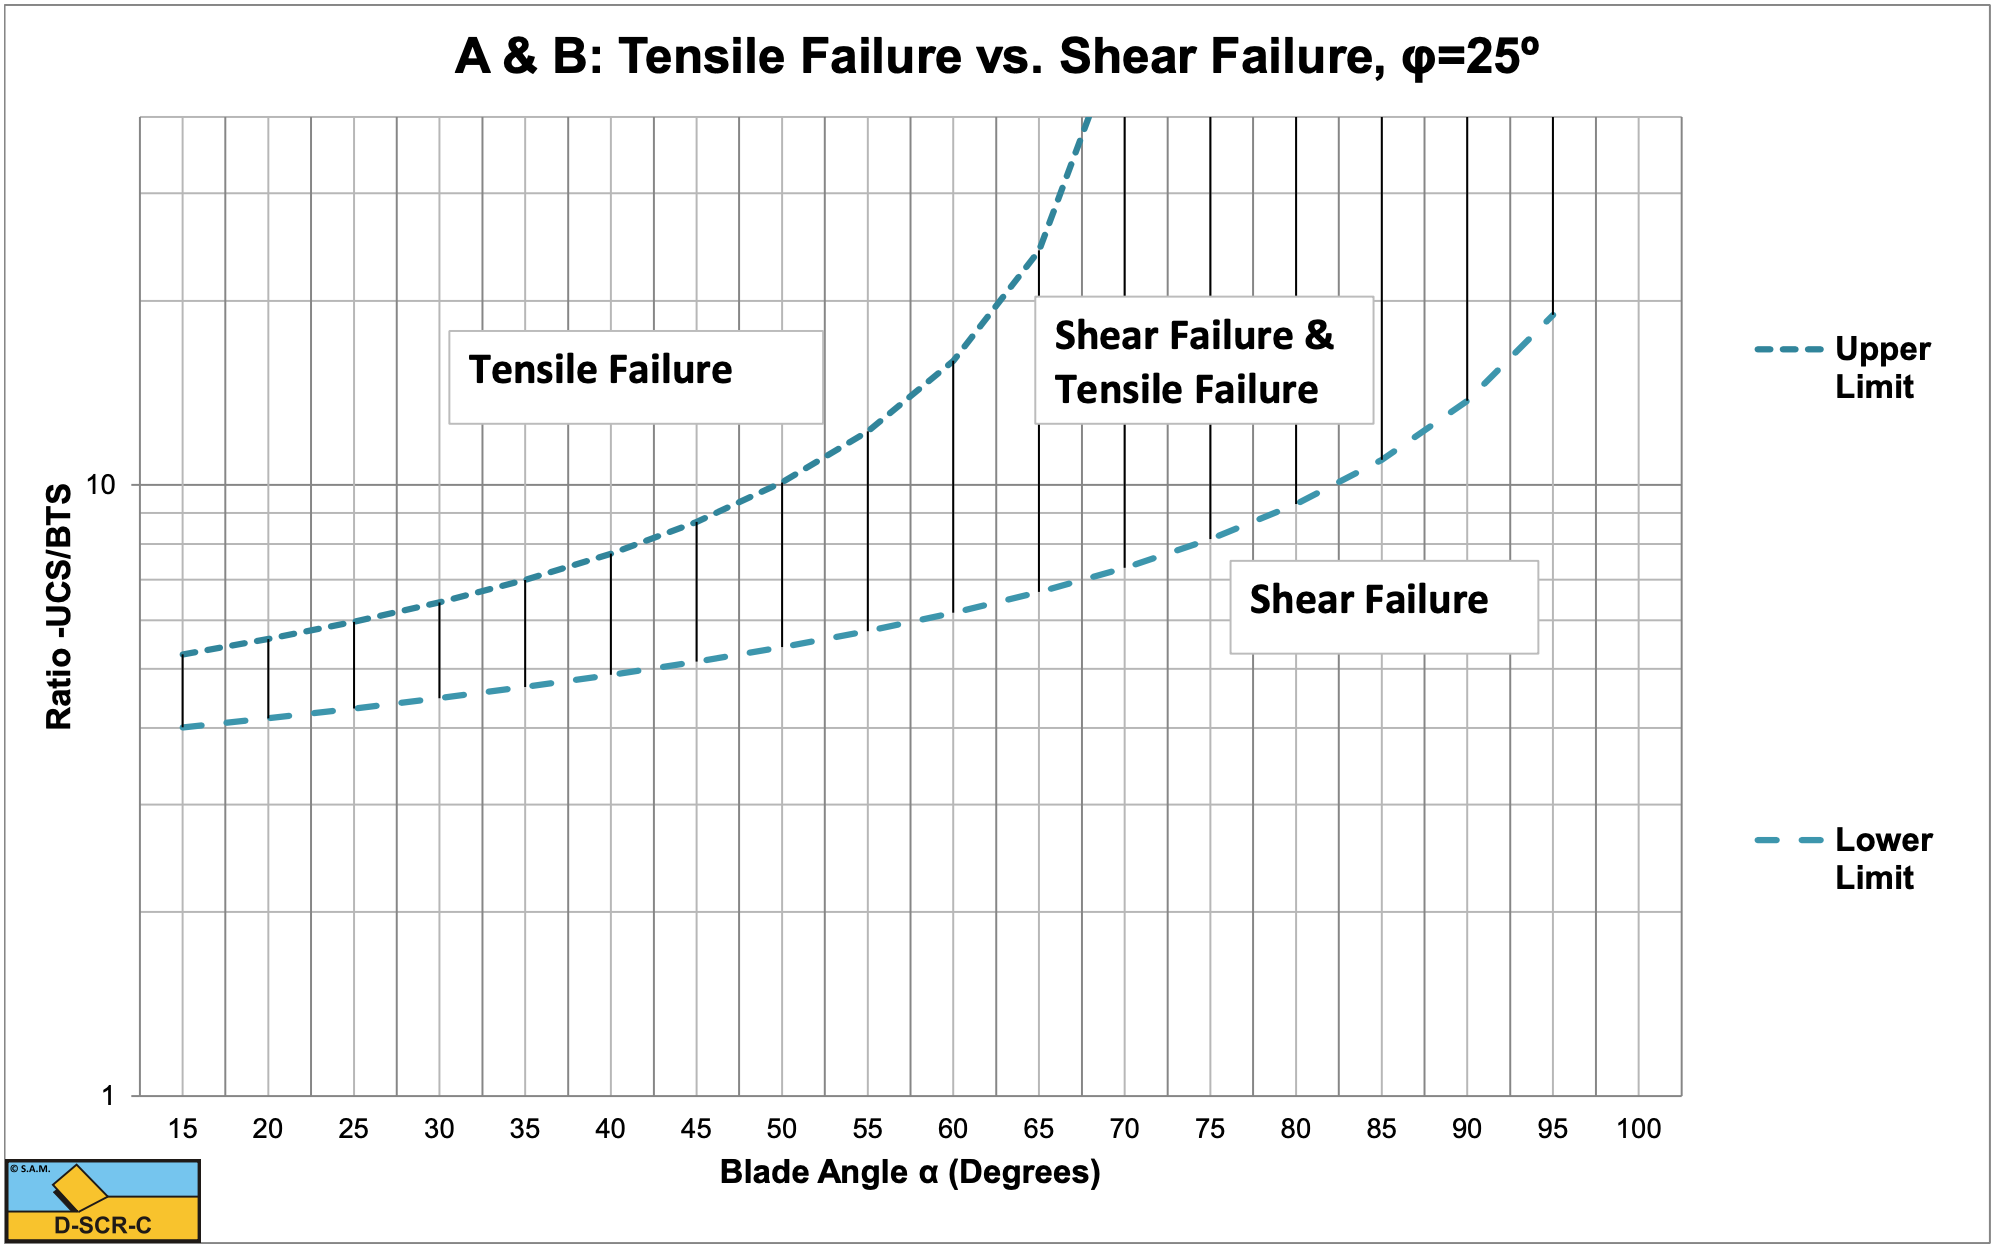
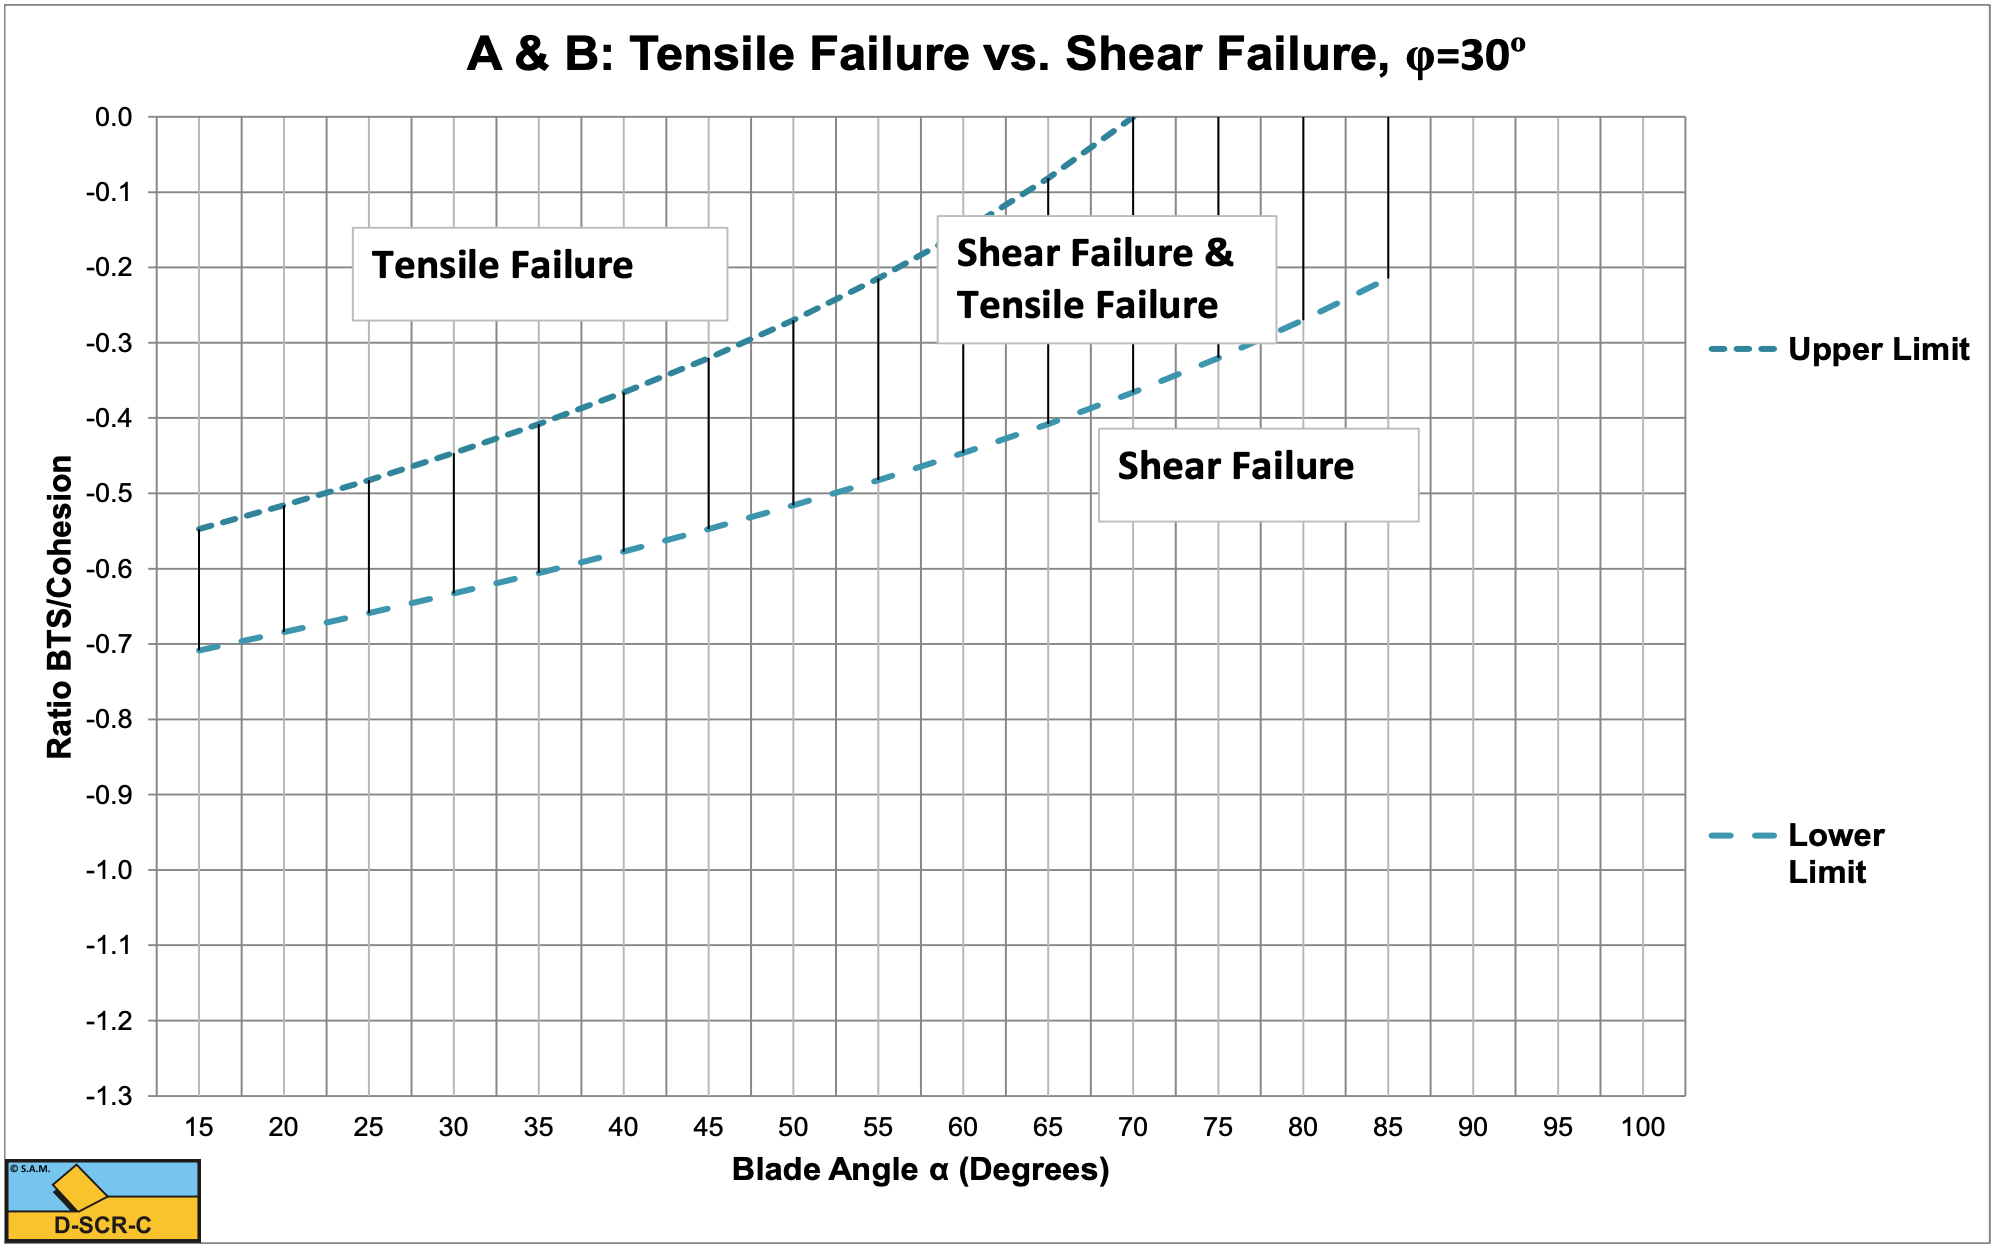
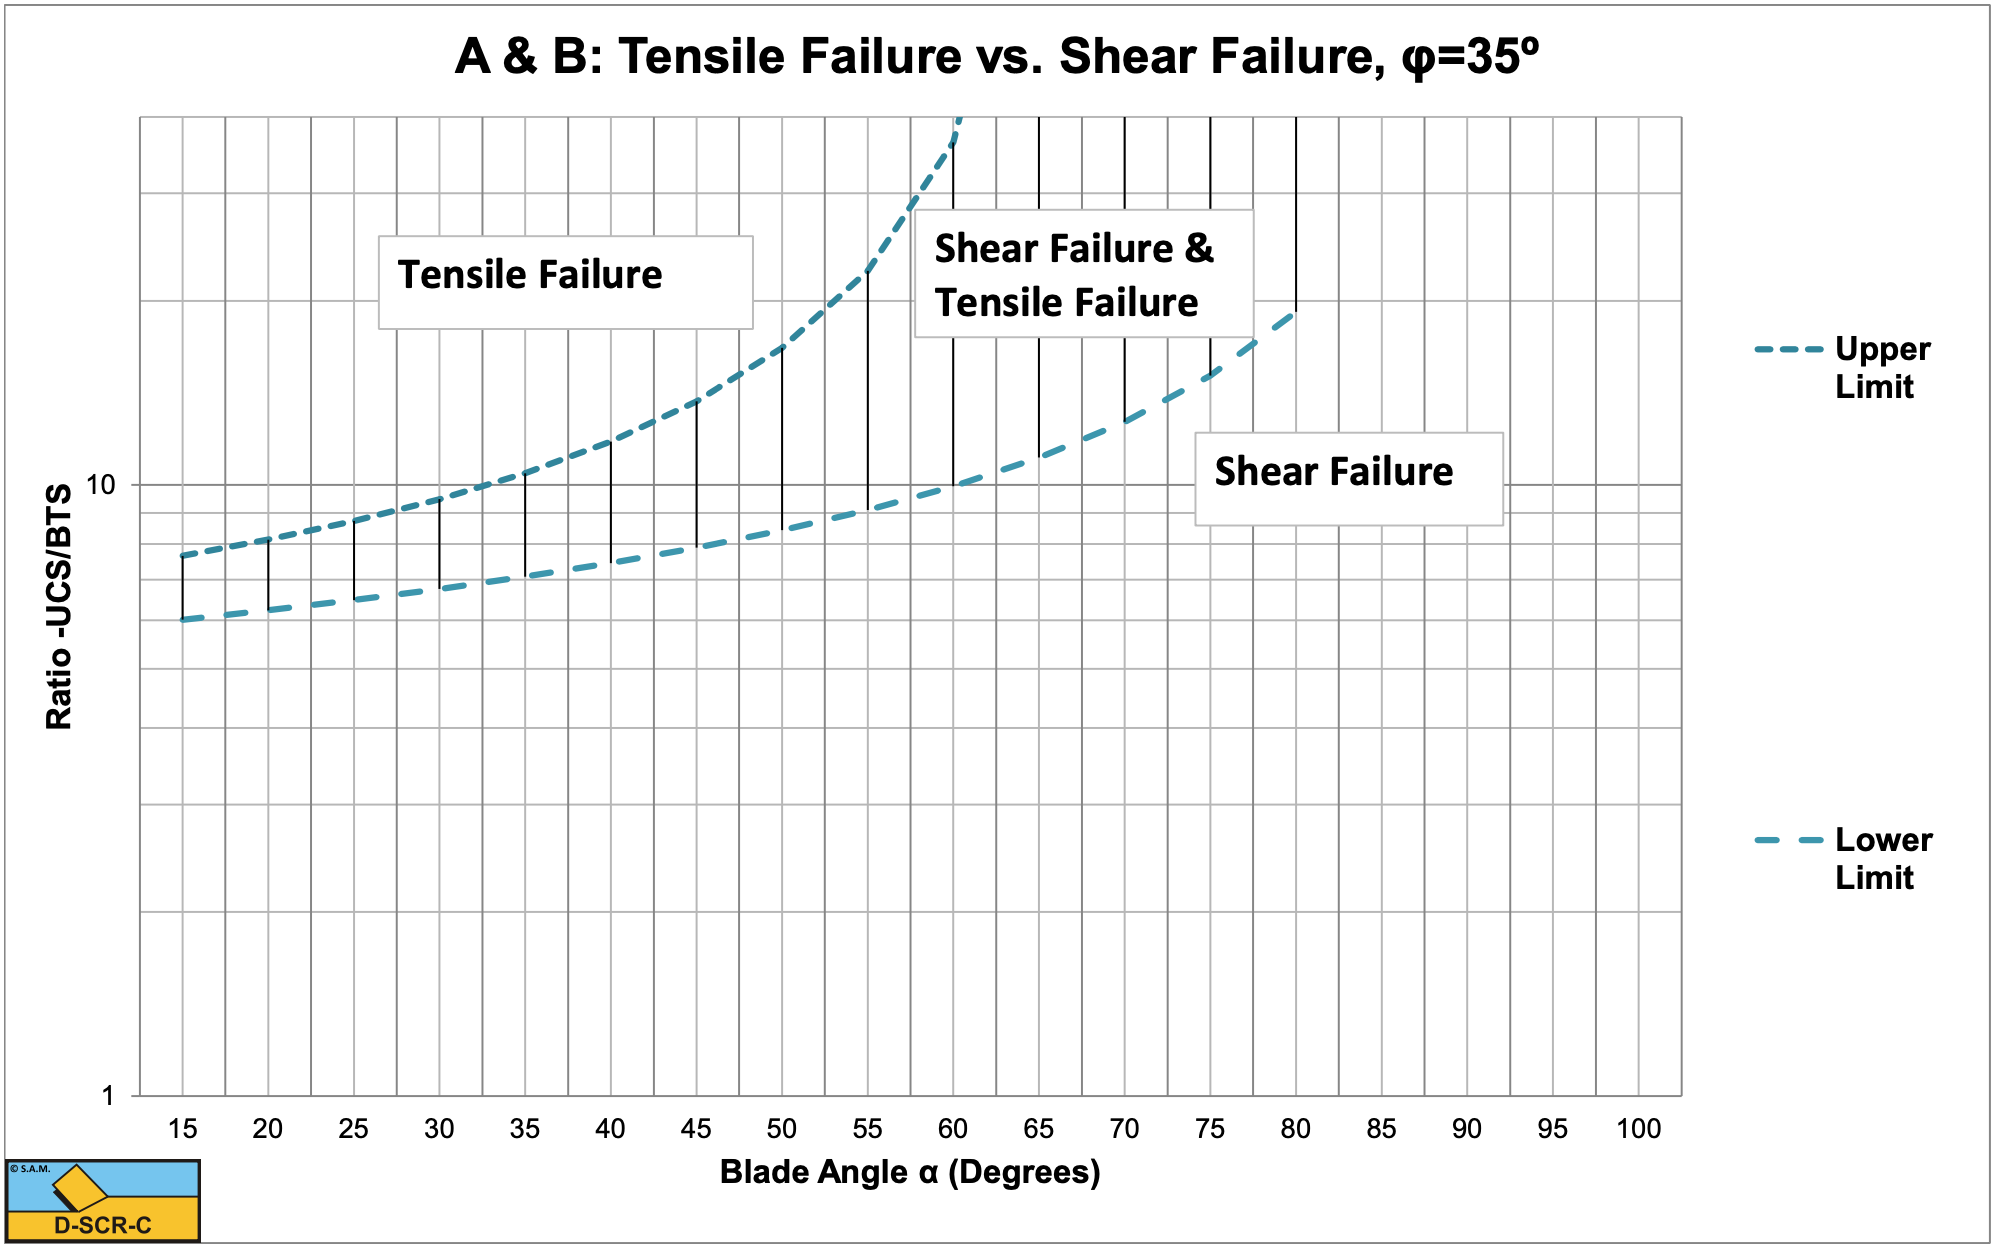
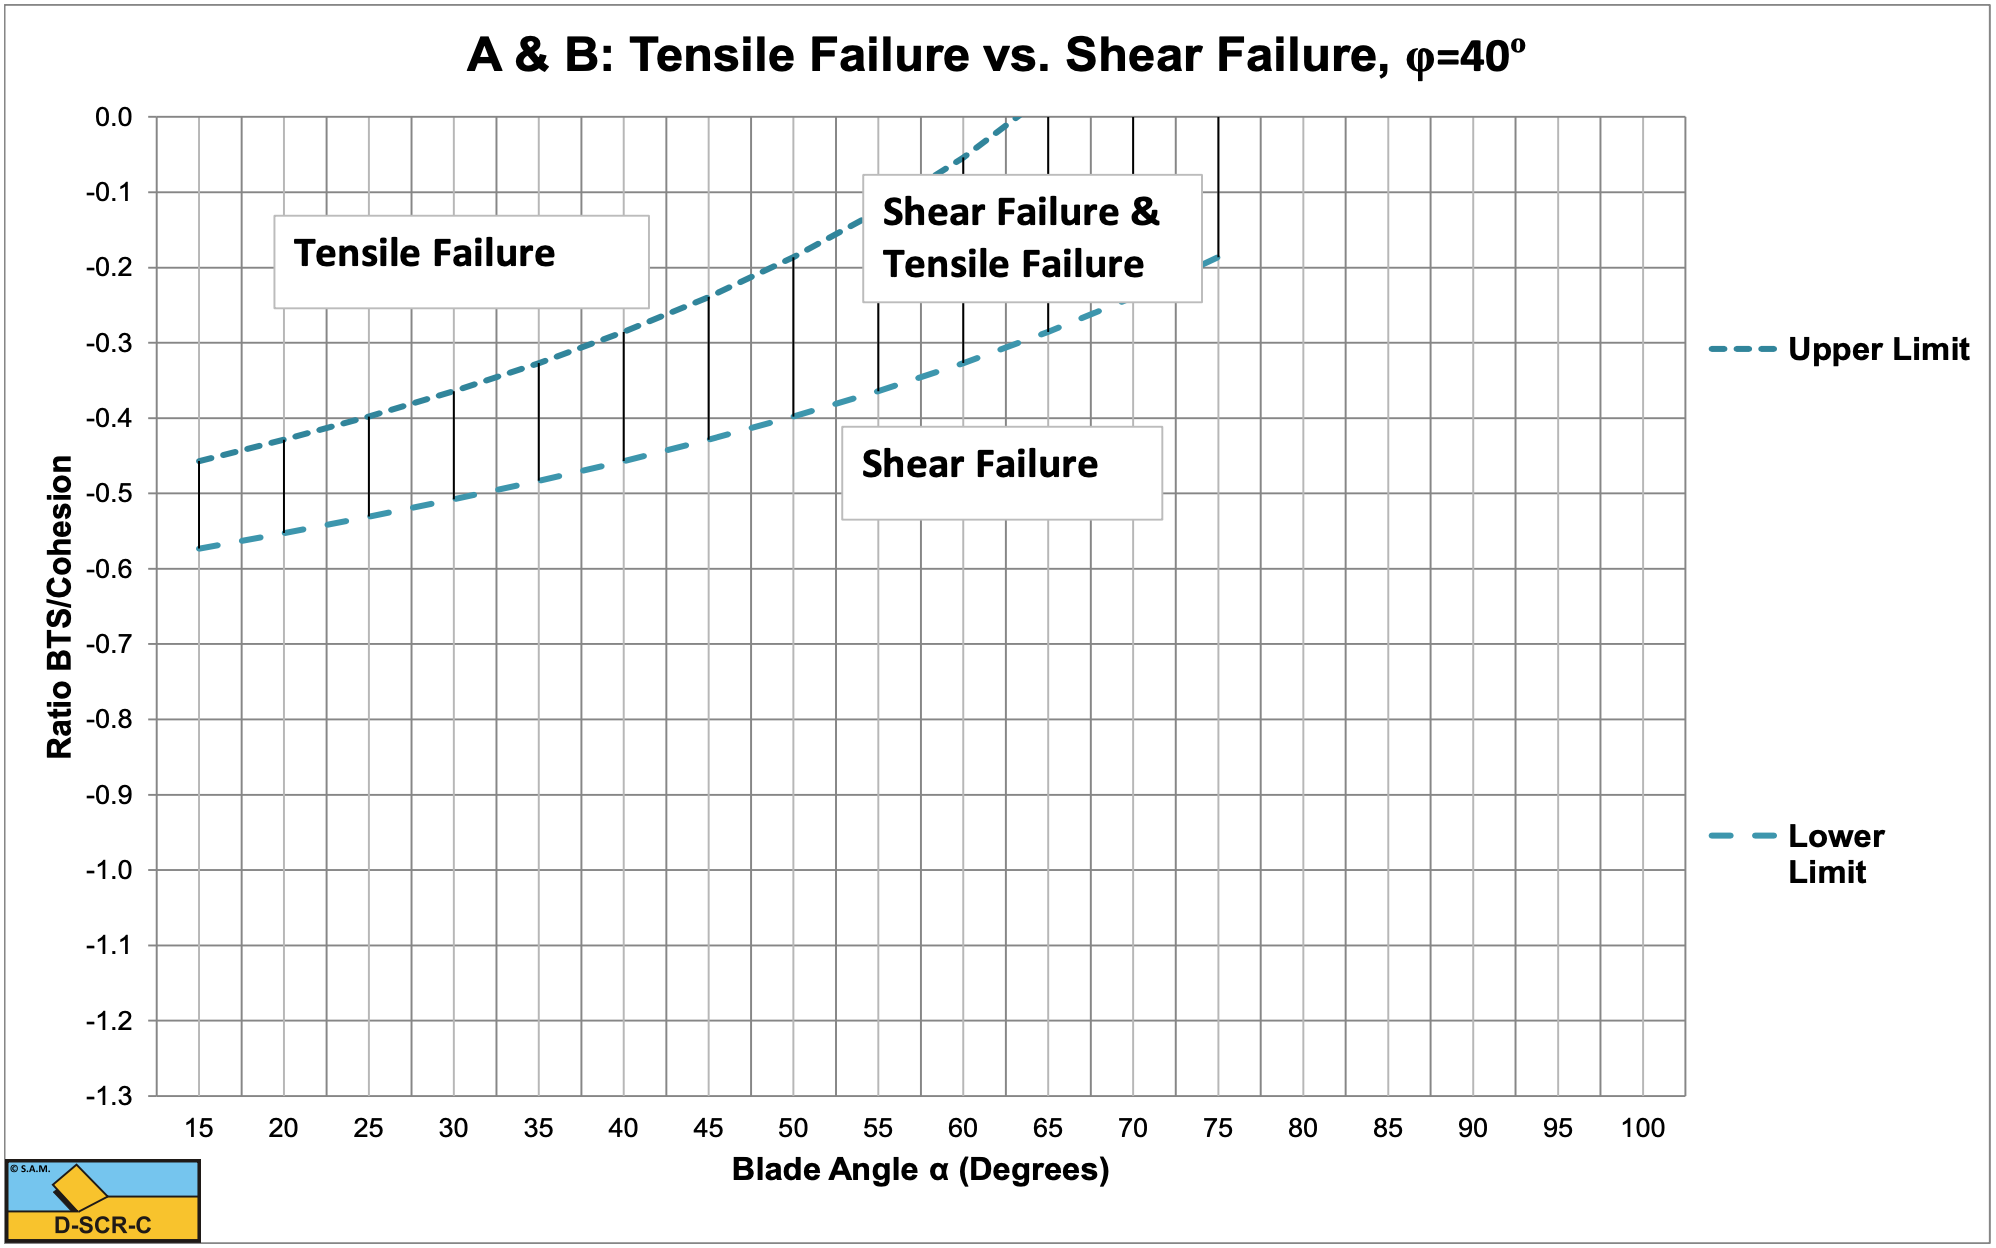
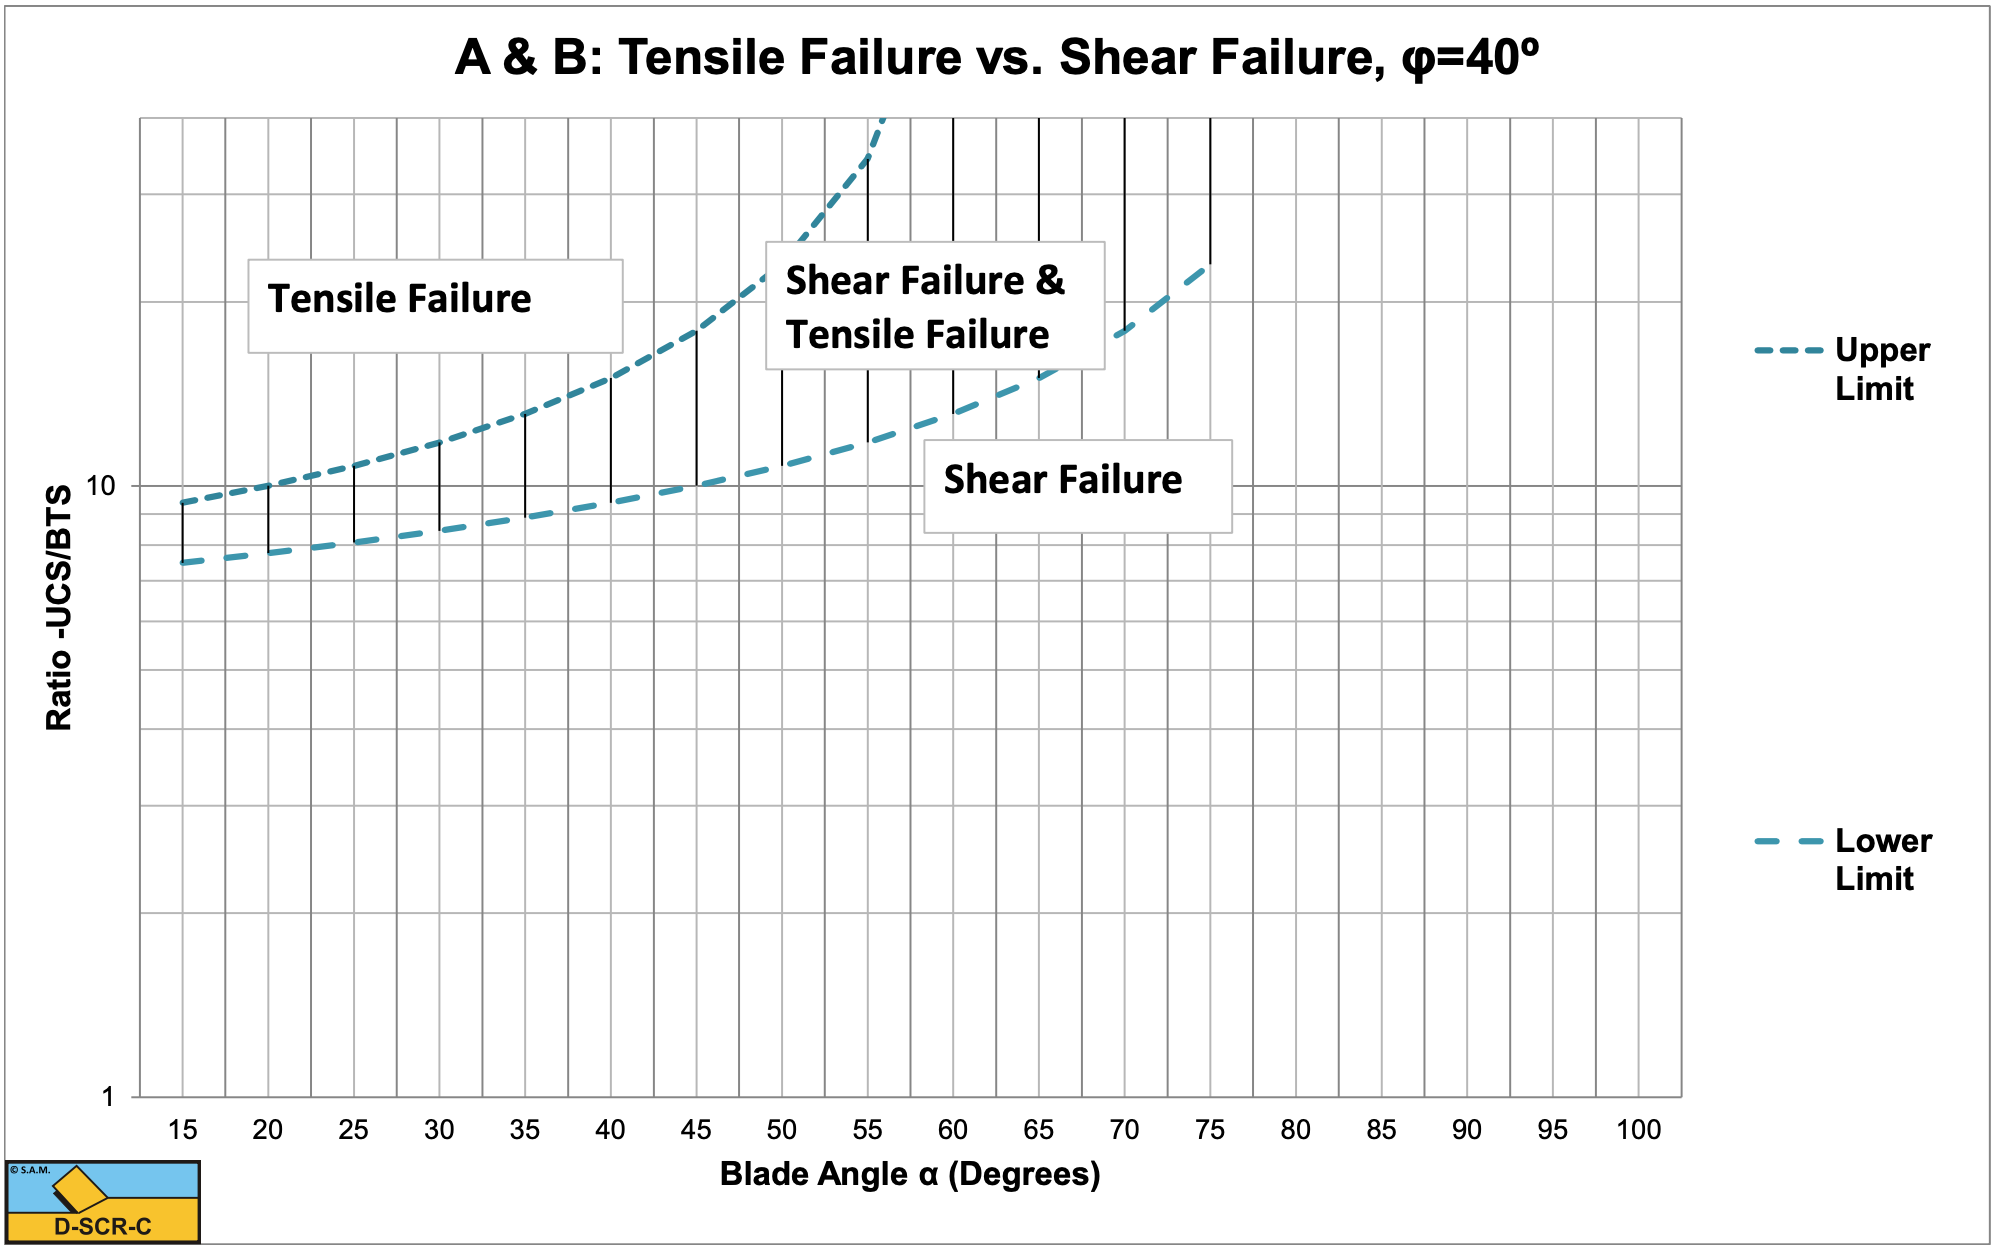
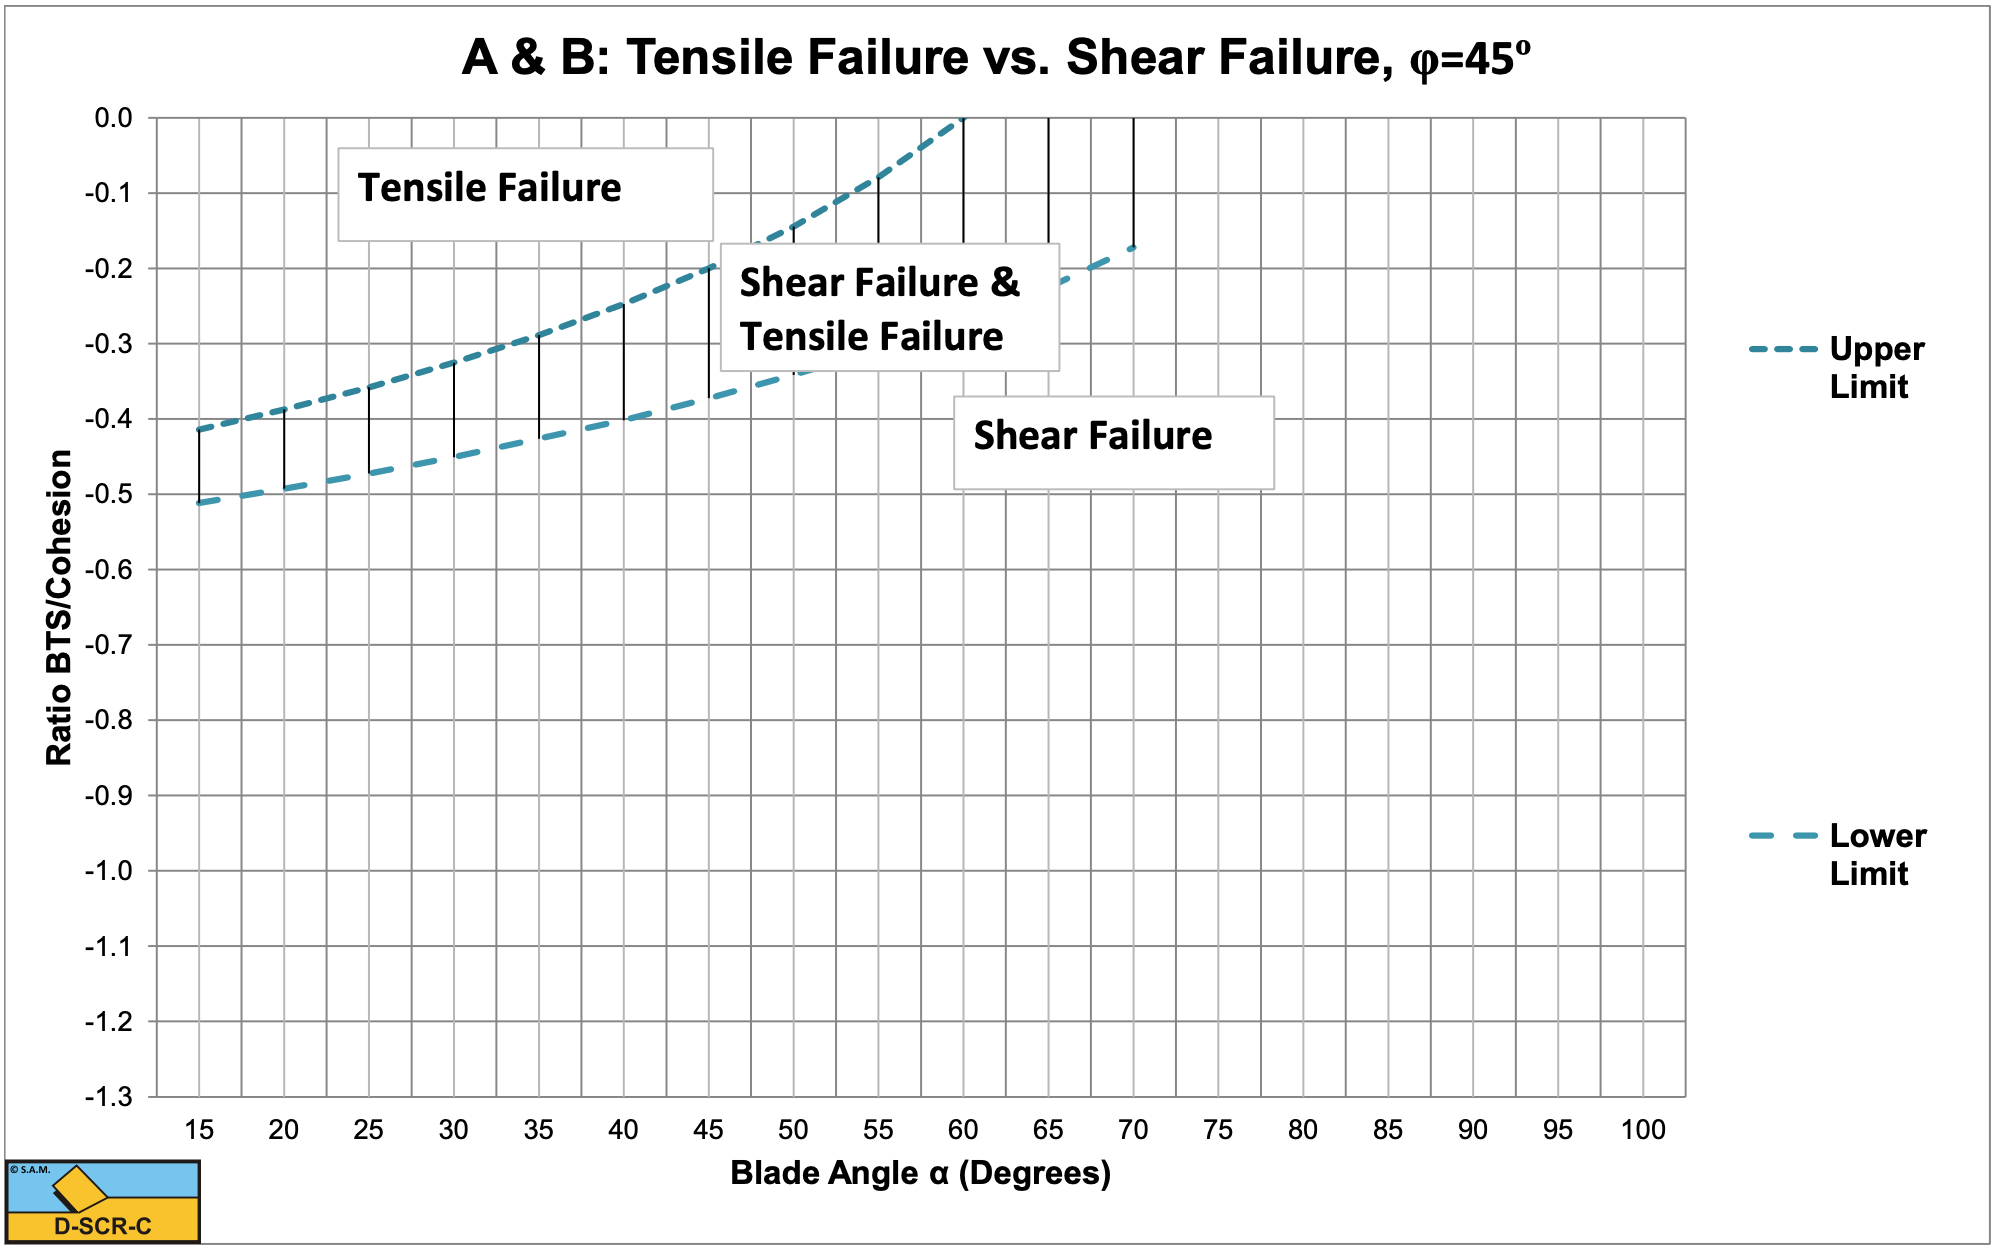
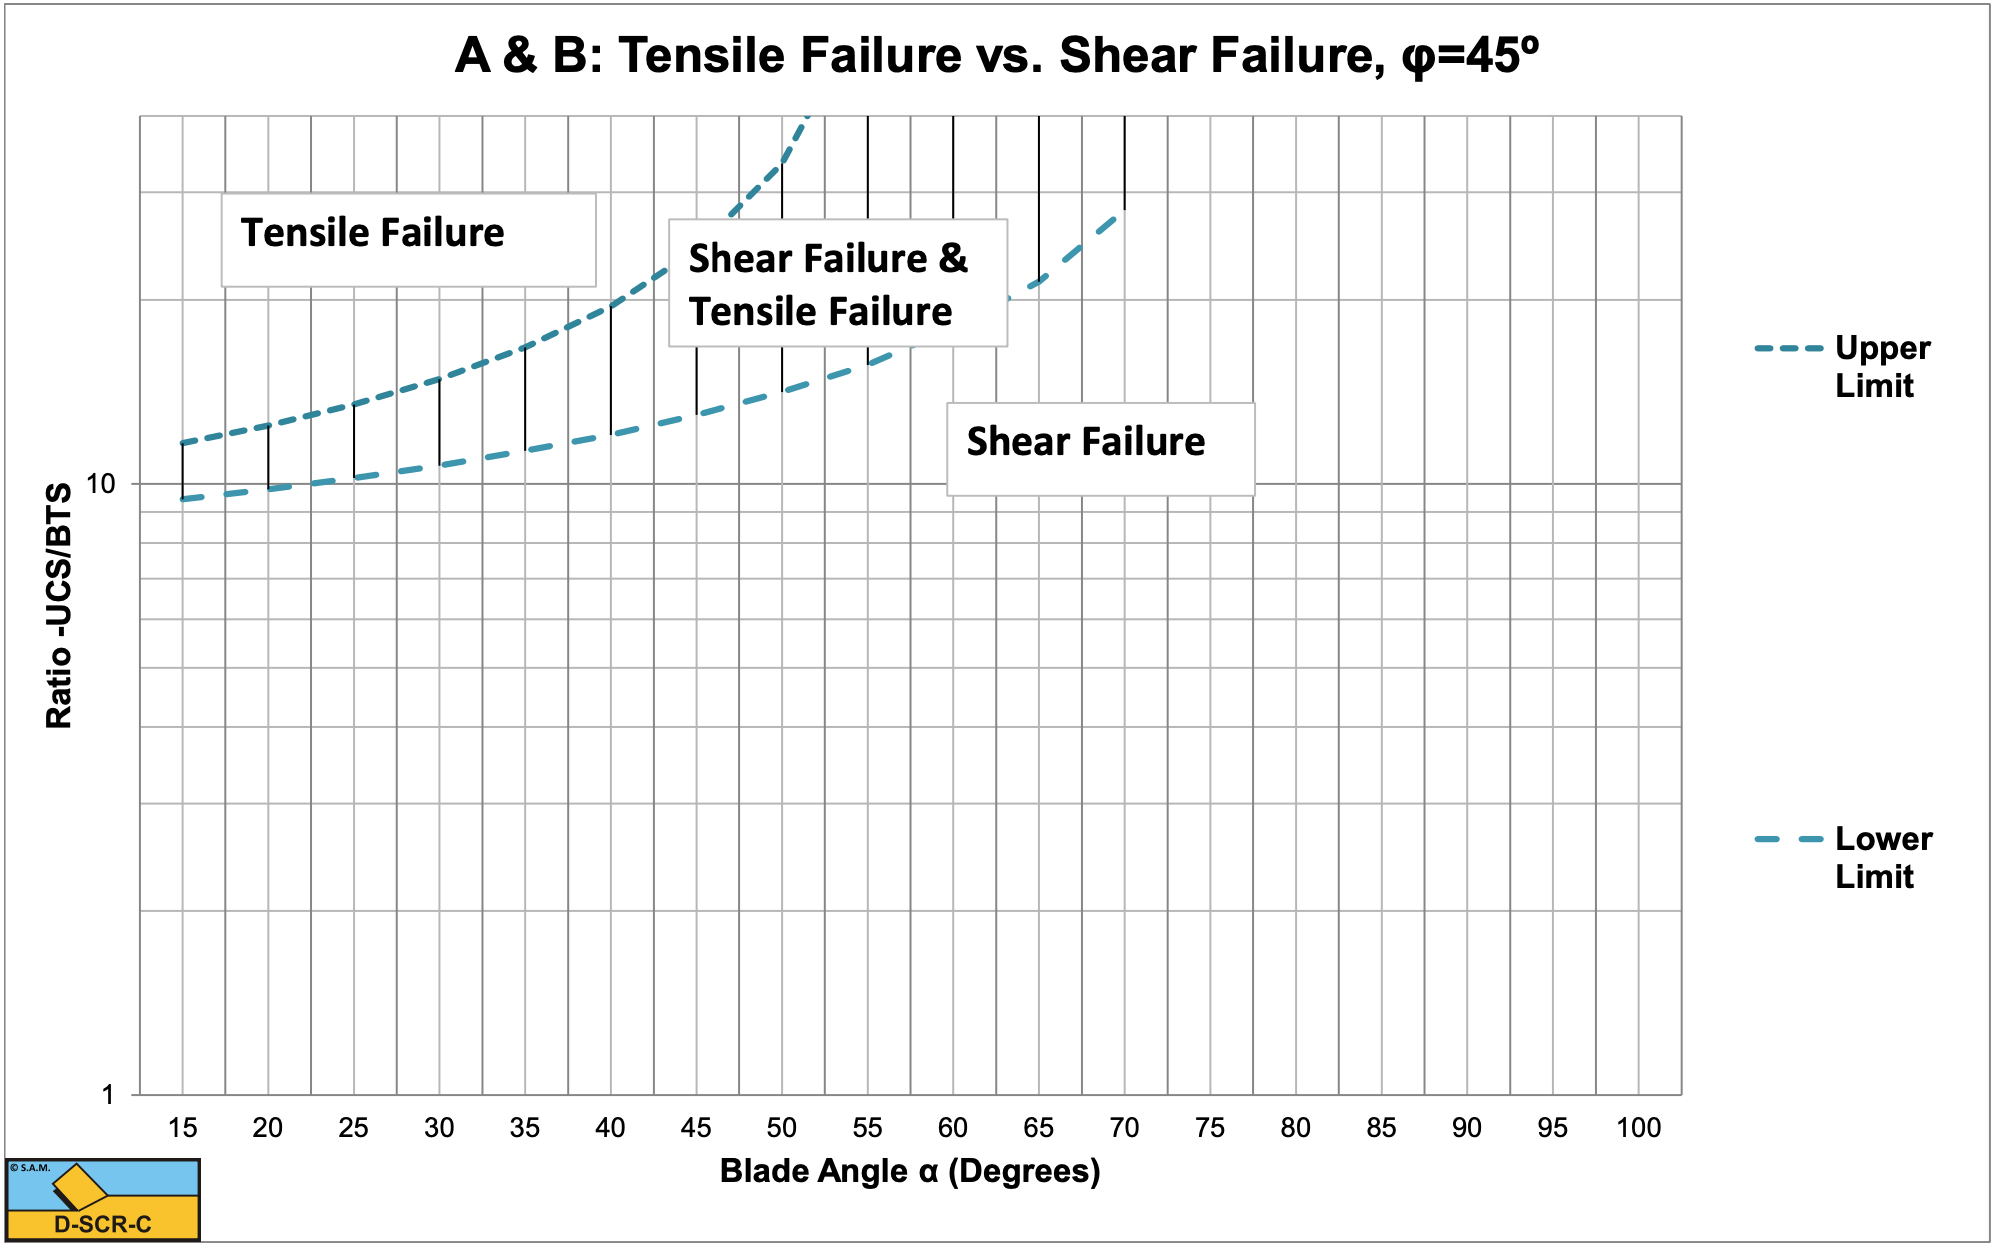
W.3 The Transition Brittle Shear/Brittle Tensile B
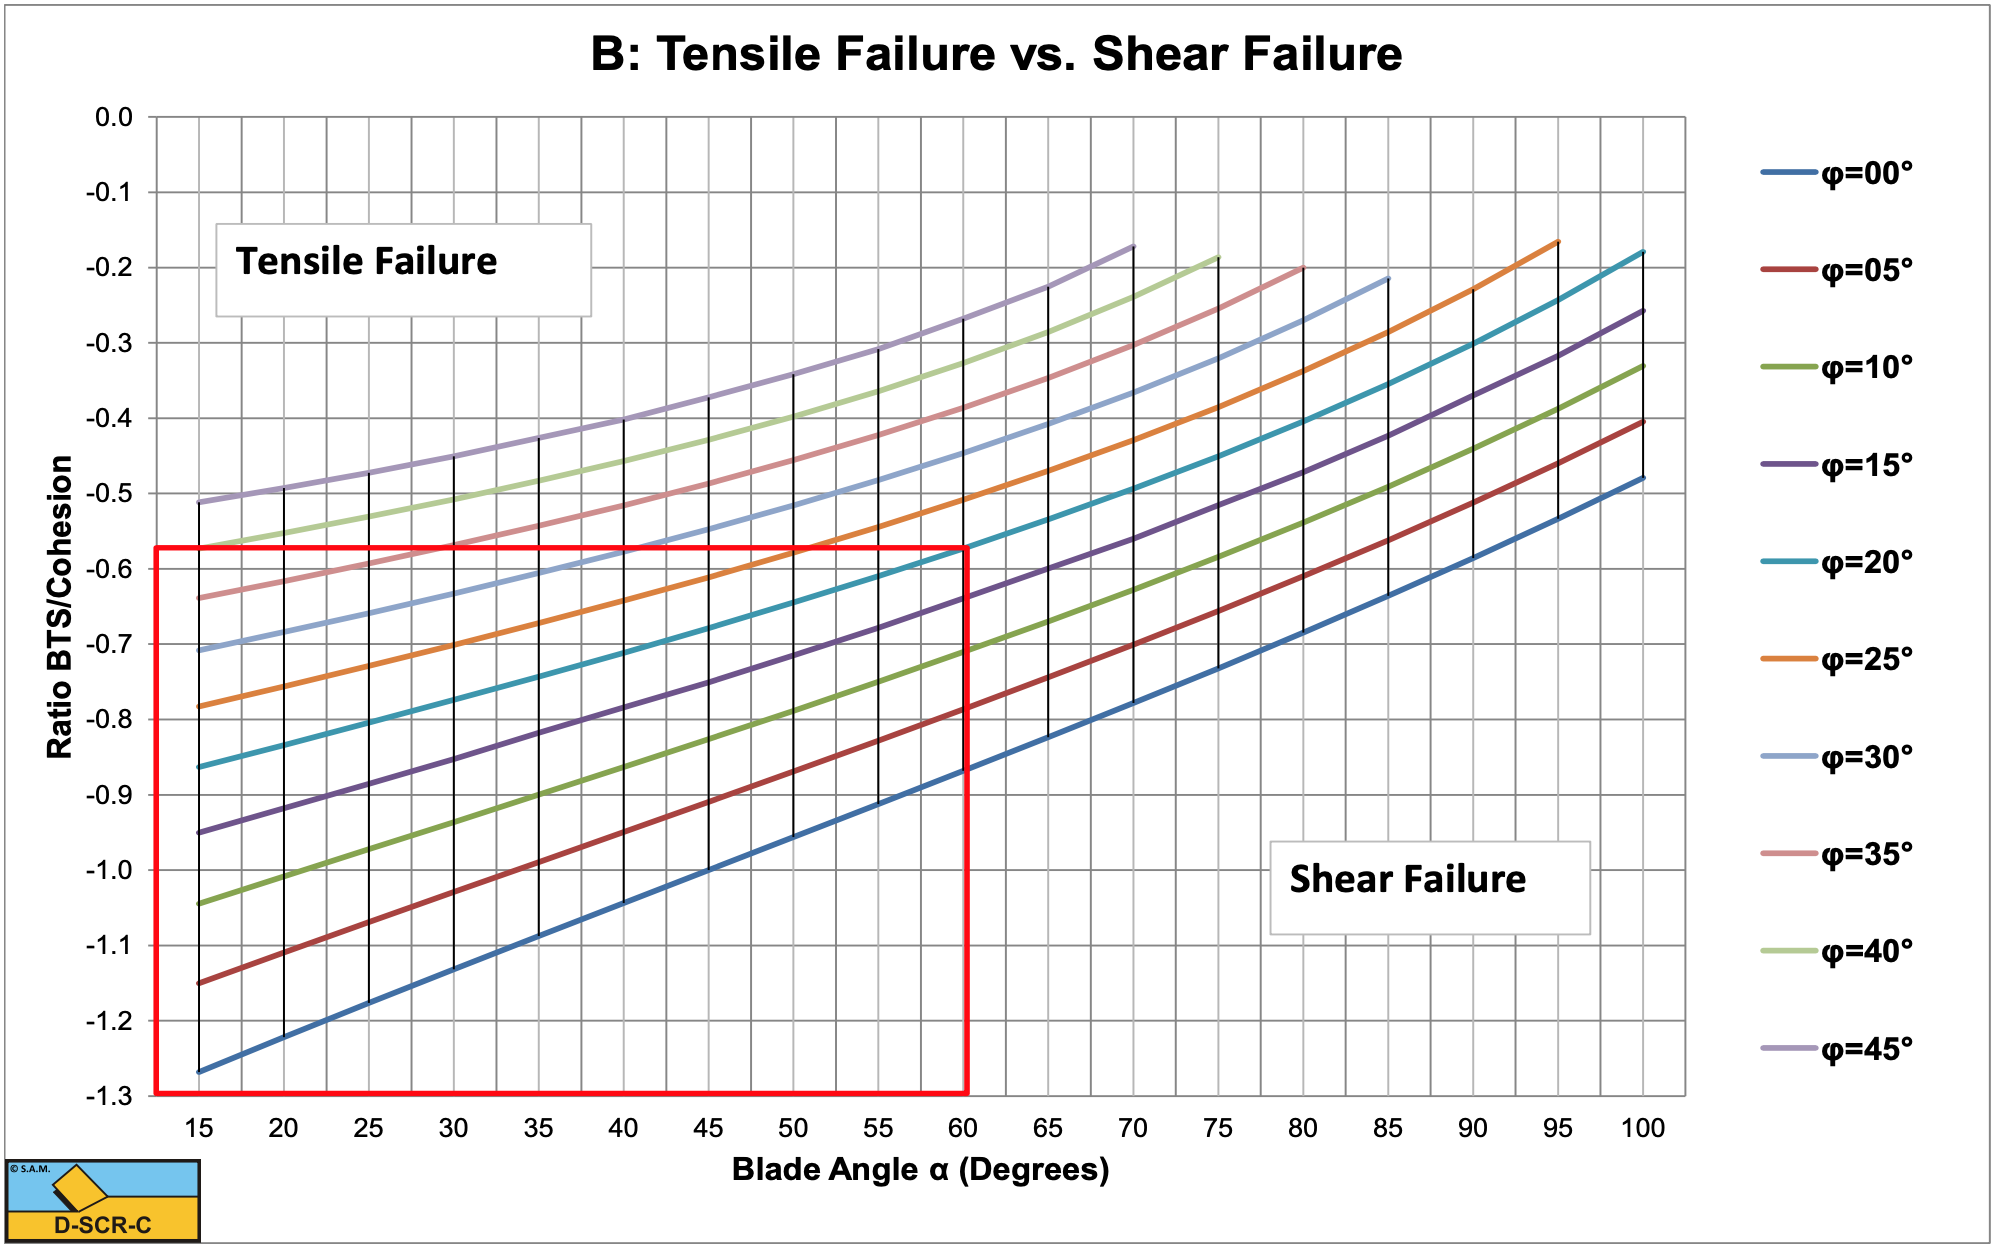
Below the lines the cutting process is subject to shear failure, above the lines to tensile failure. The curves are based on the shear angle resulting from tensile failure.
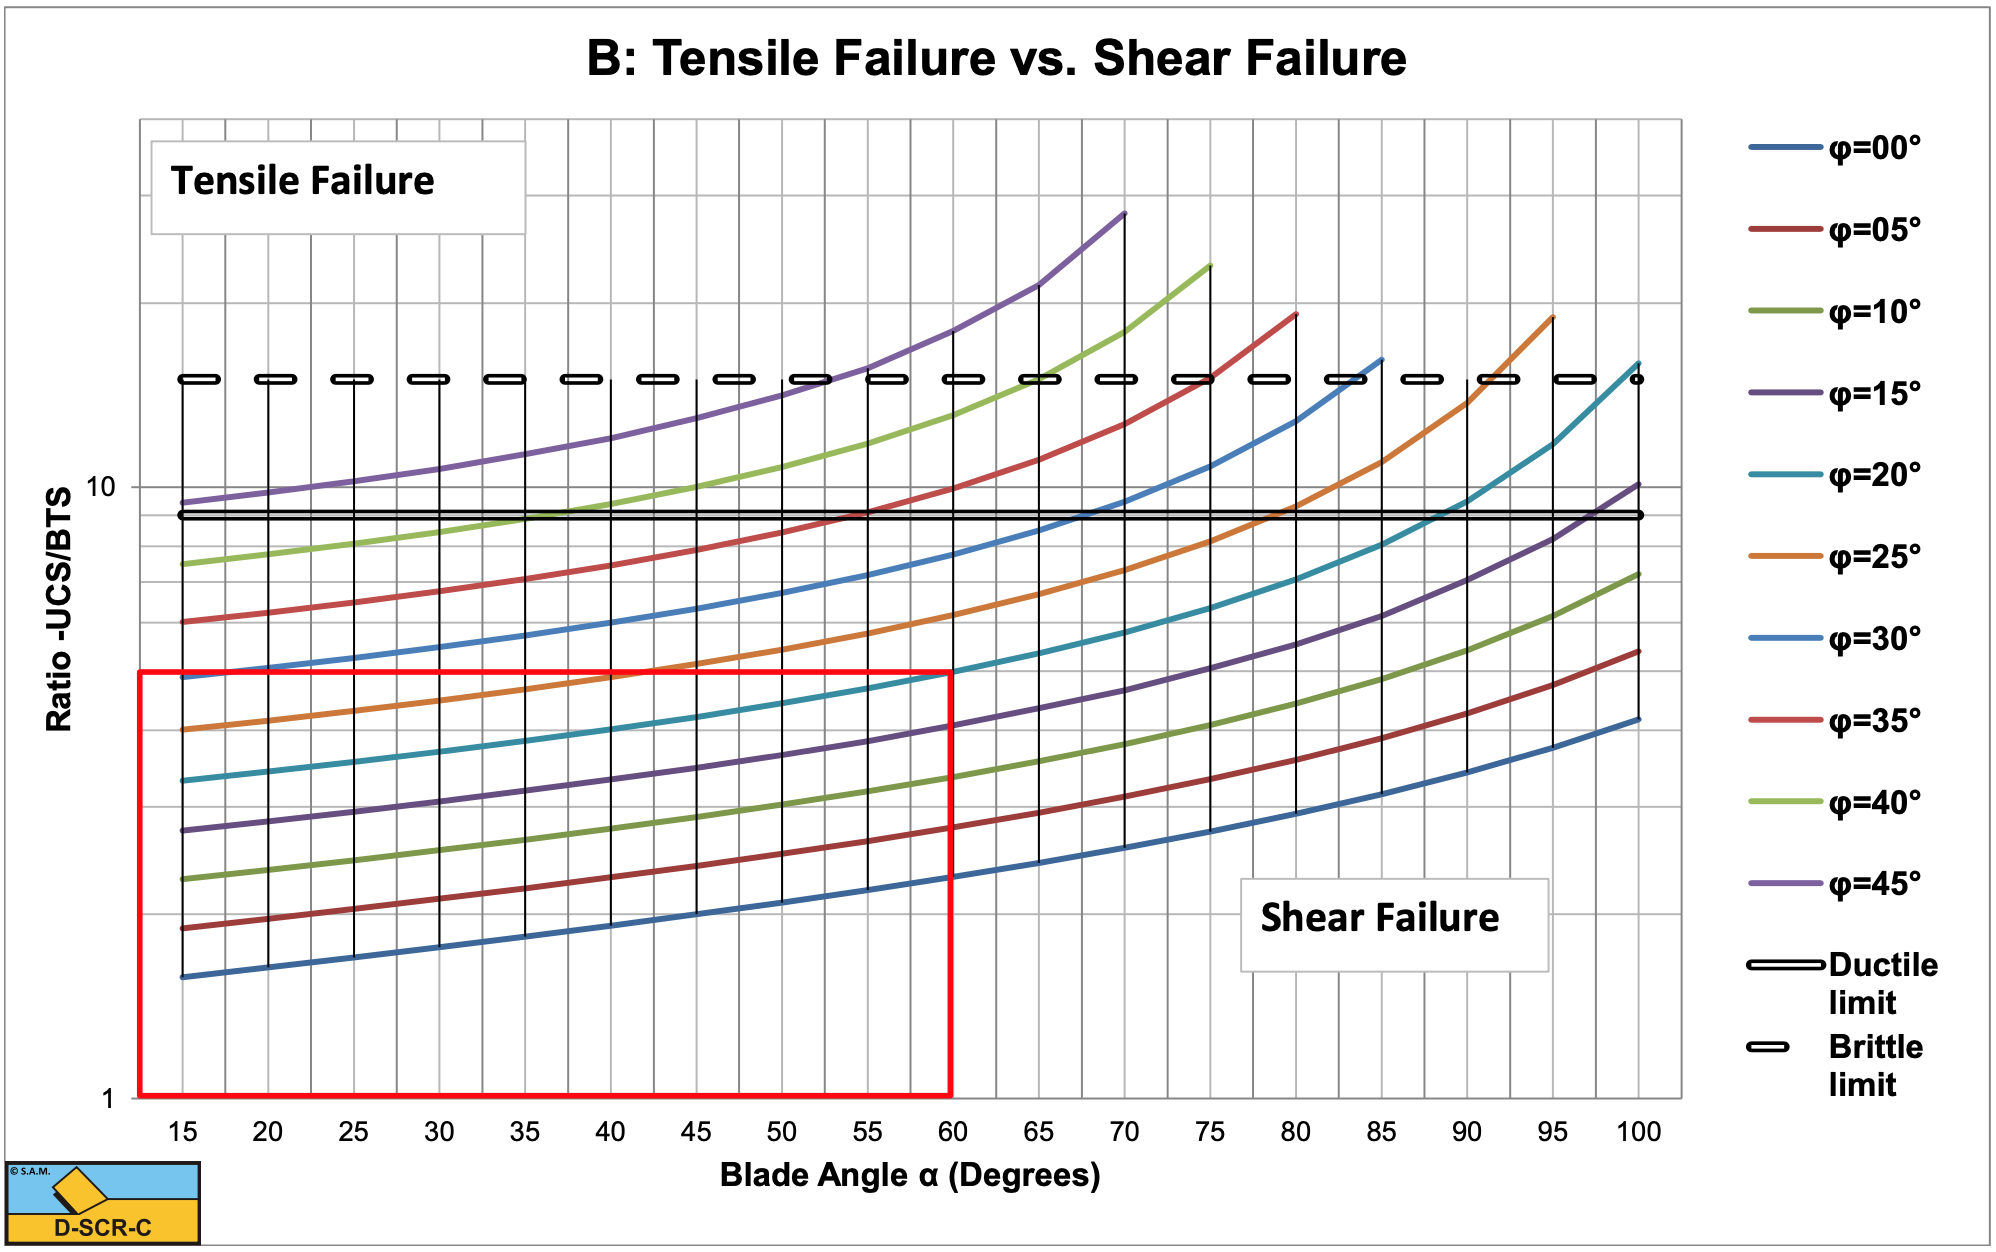
In all figures an example is given for a 60o blade and an internal friction angle of 20o.
In all figures an example is given for a 60o blade and an internal friction angle of 20o.
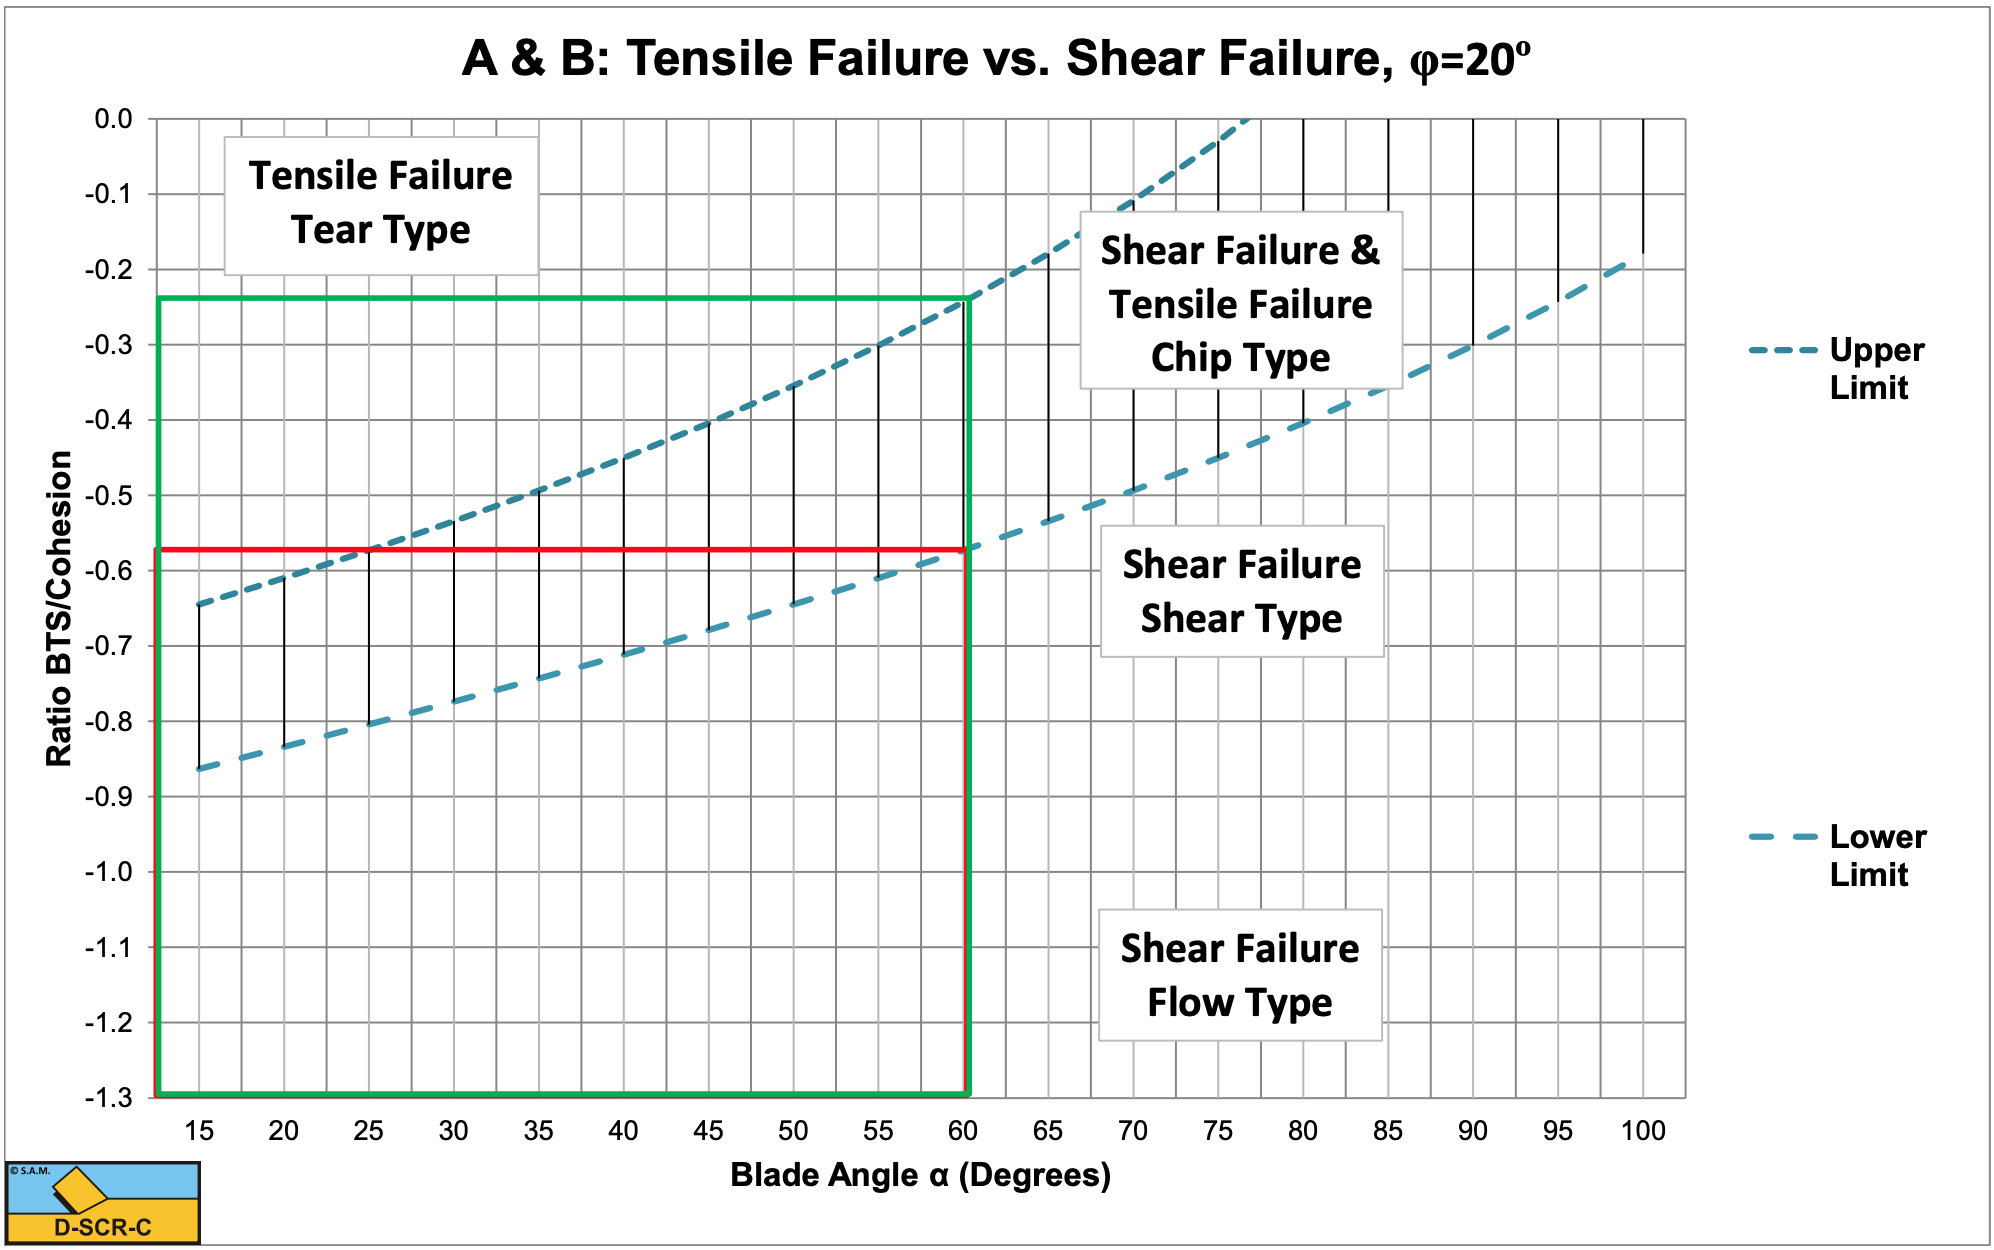
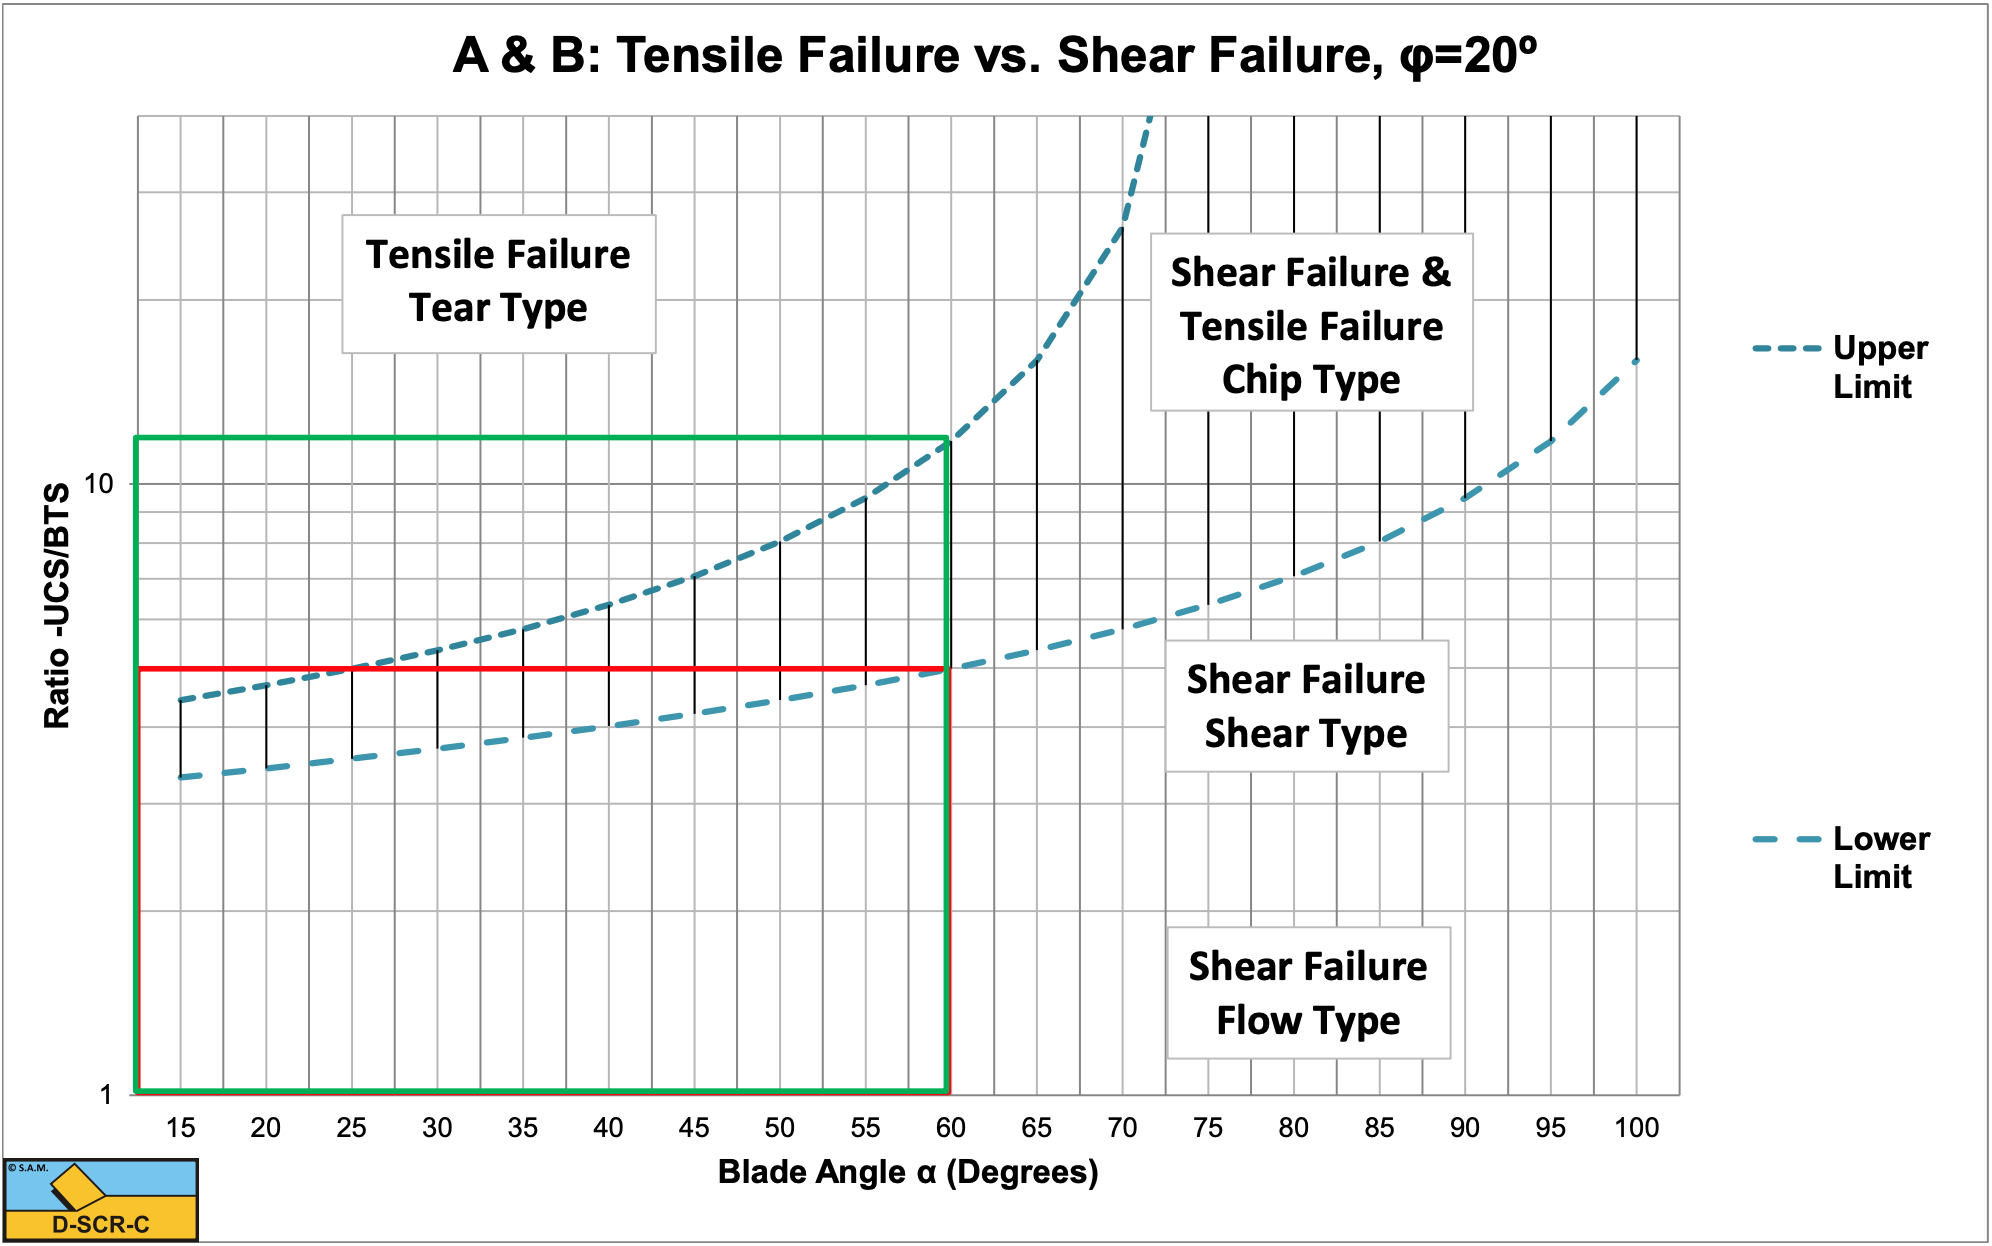
W.4 Transition Ranges Brittle Shear/Brittle Tensile
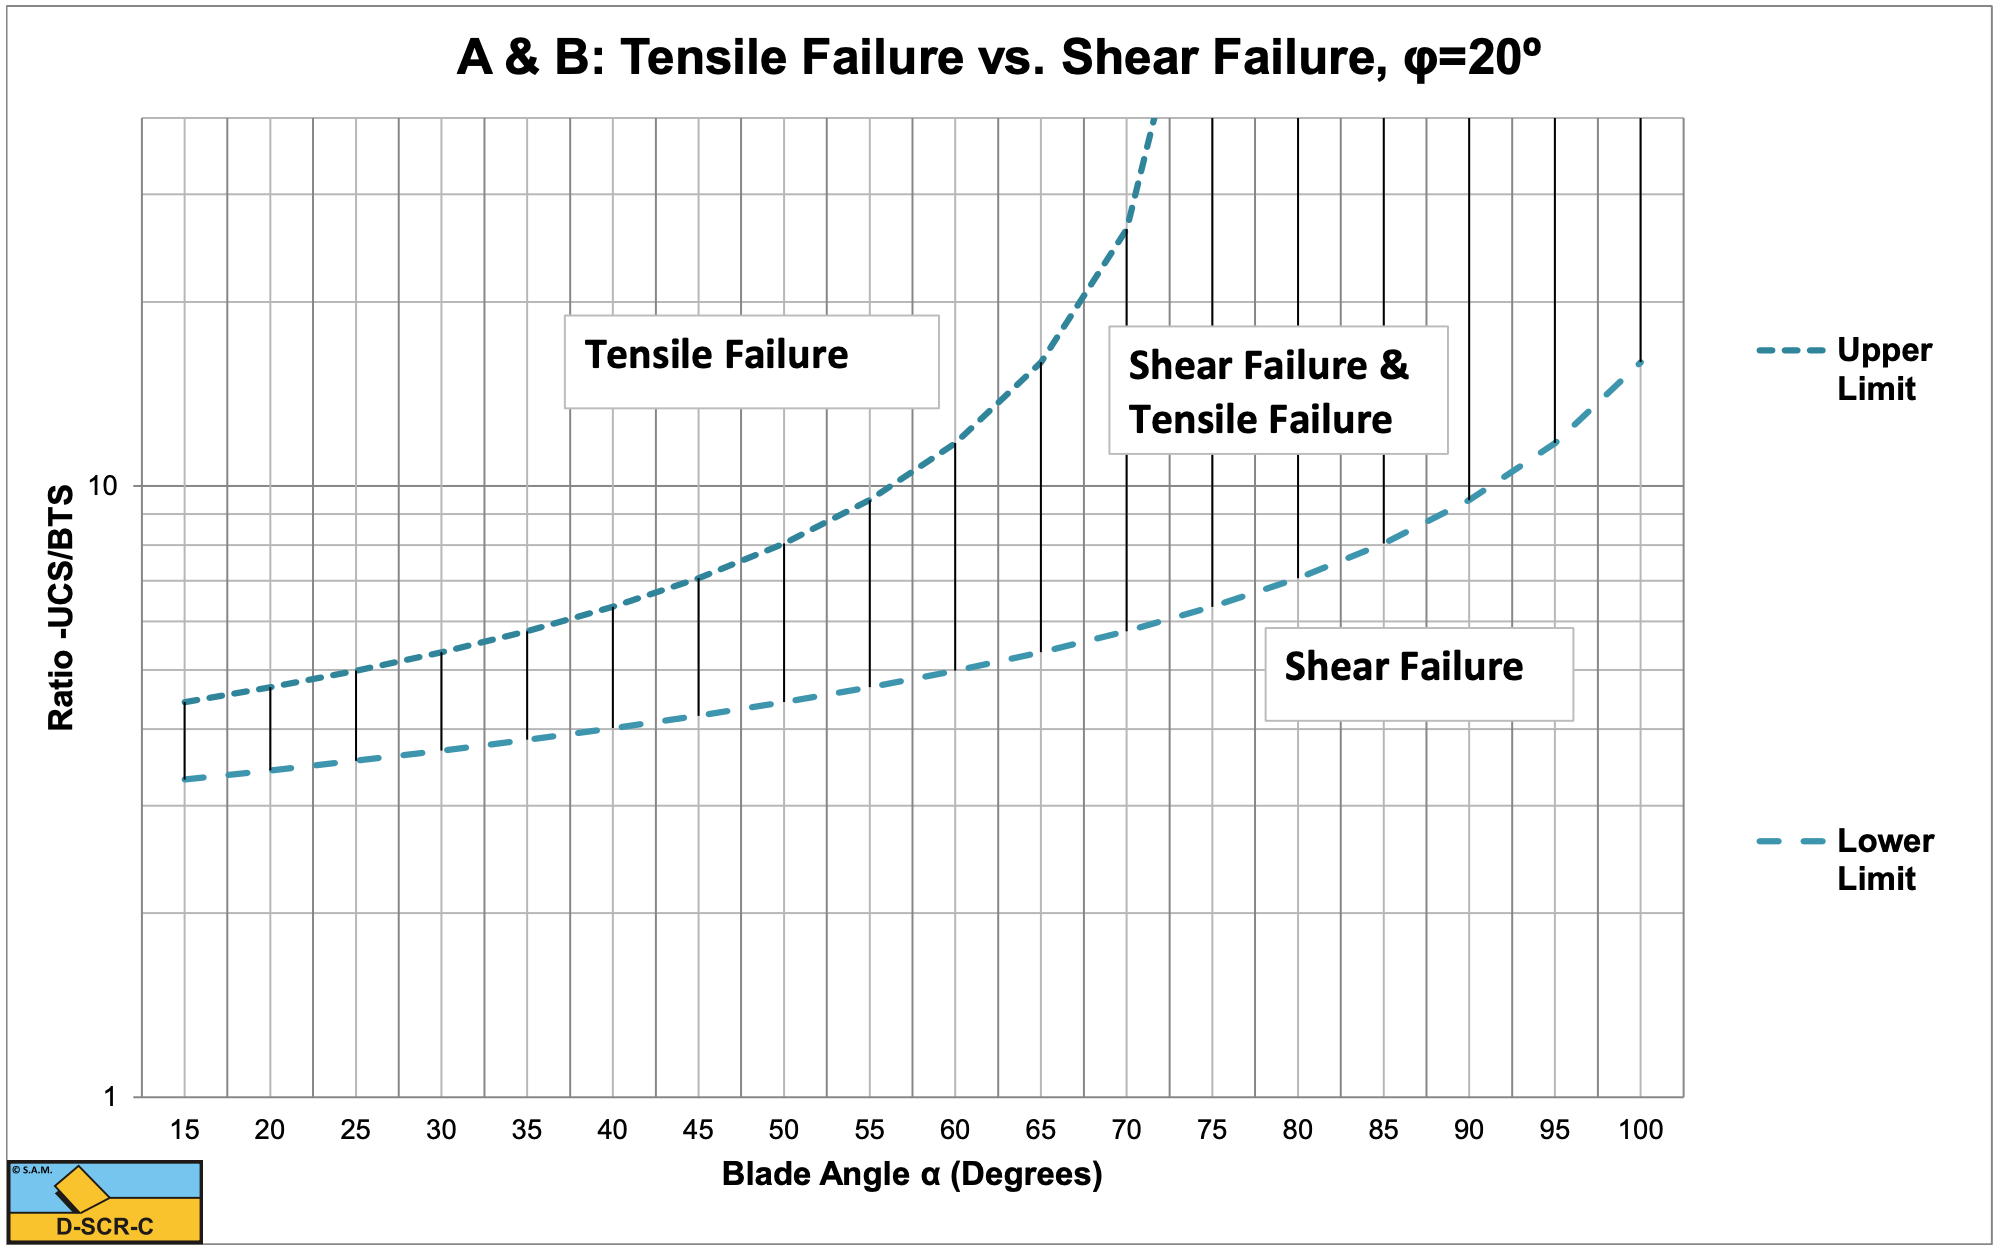
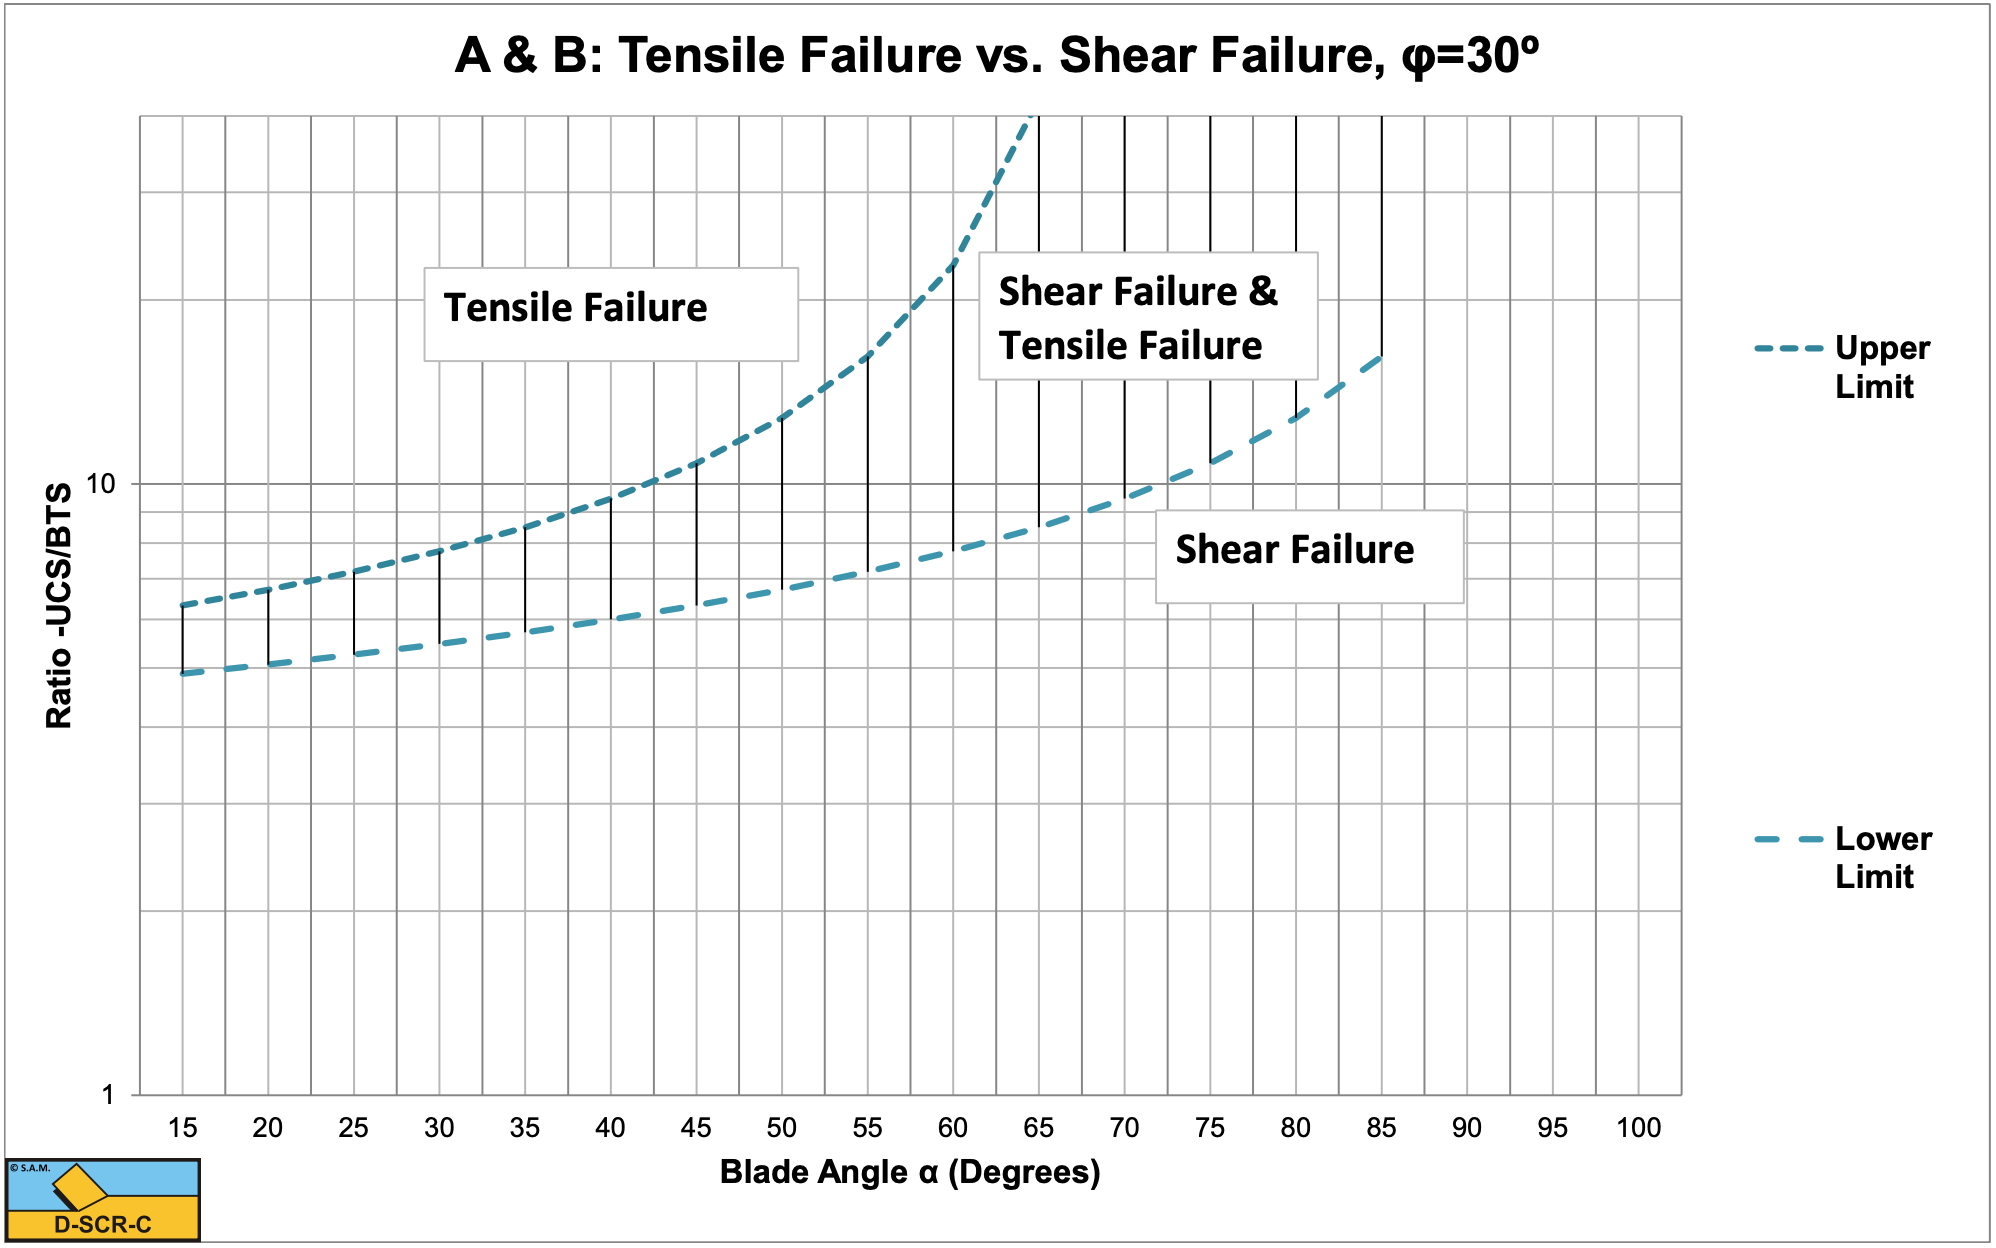
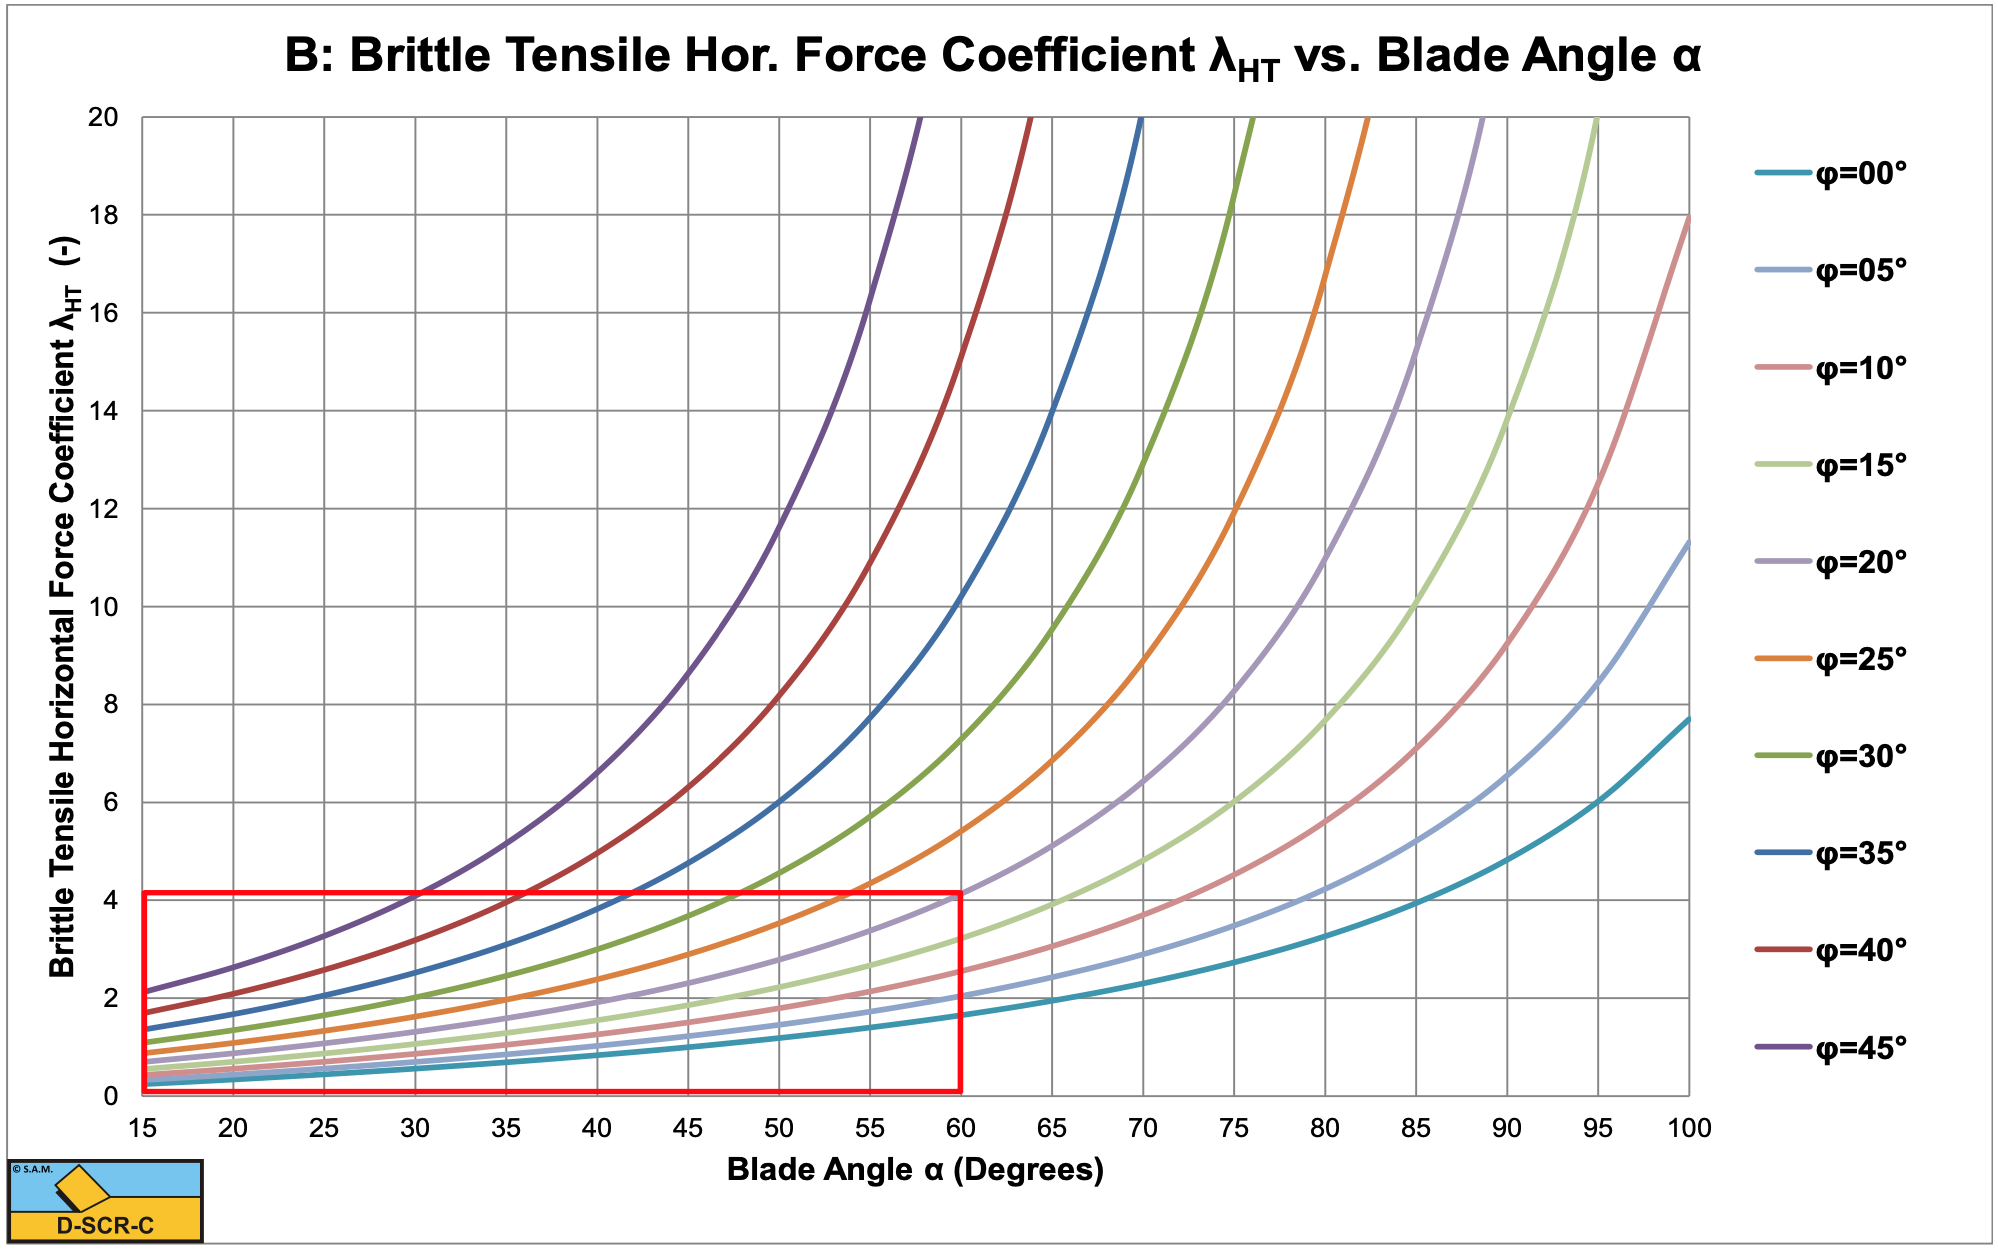
W.5 Brittle Tensile Failure based on Brittle Shear Shear Angle
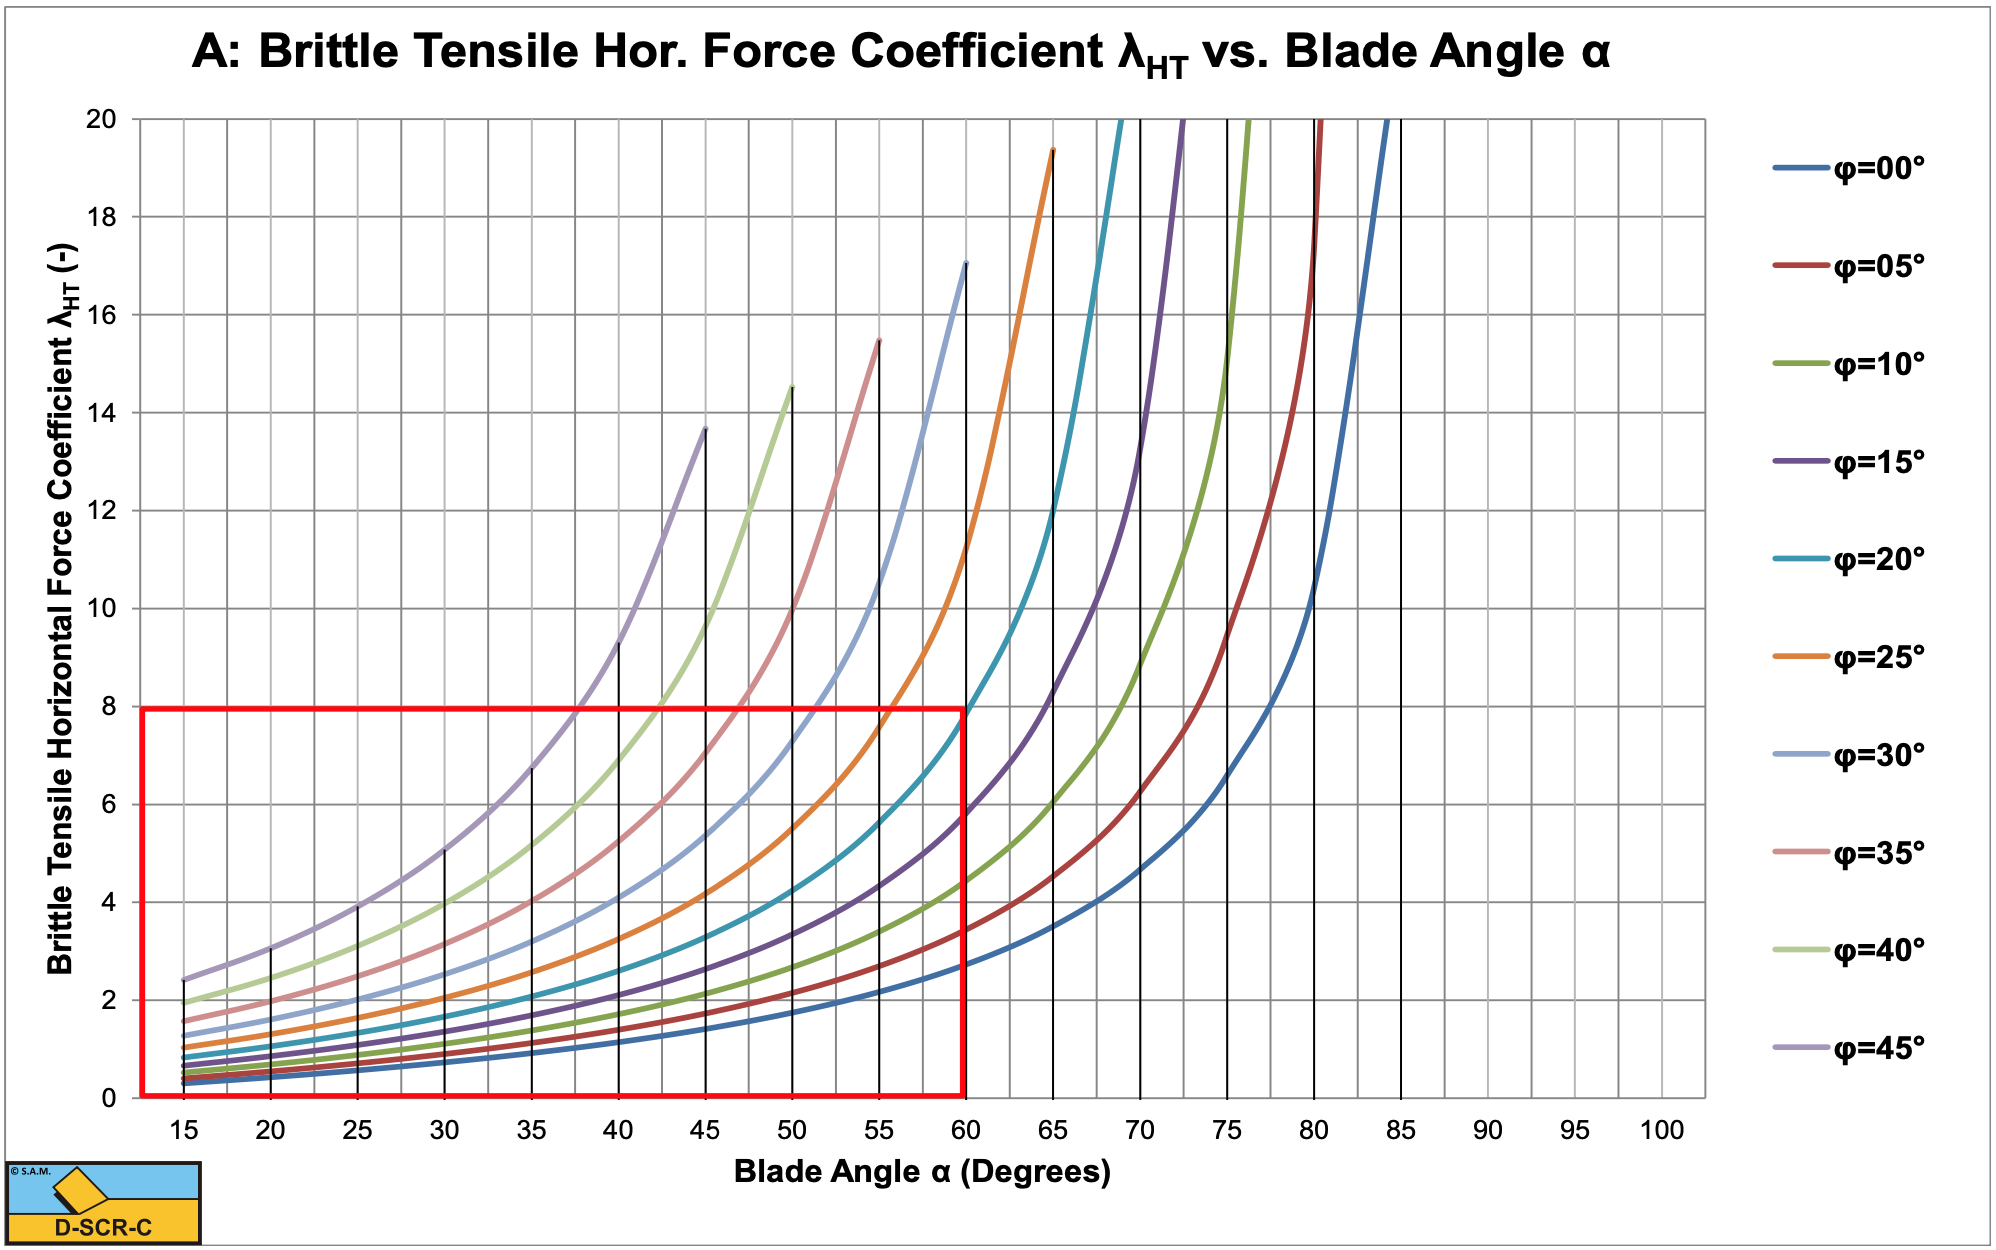
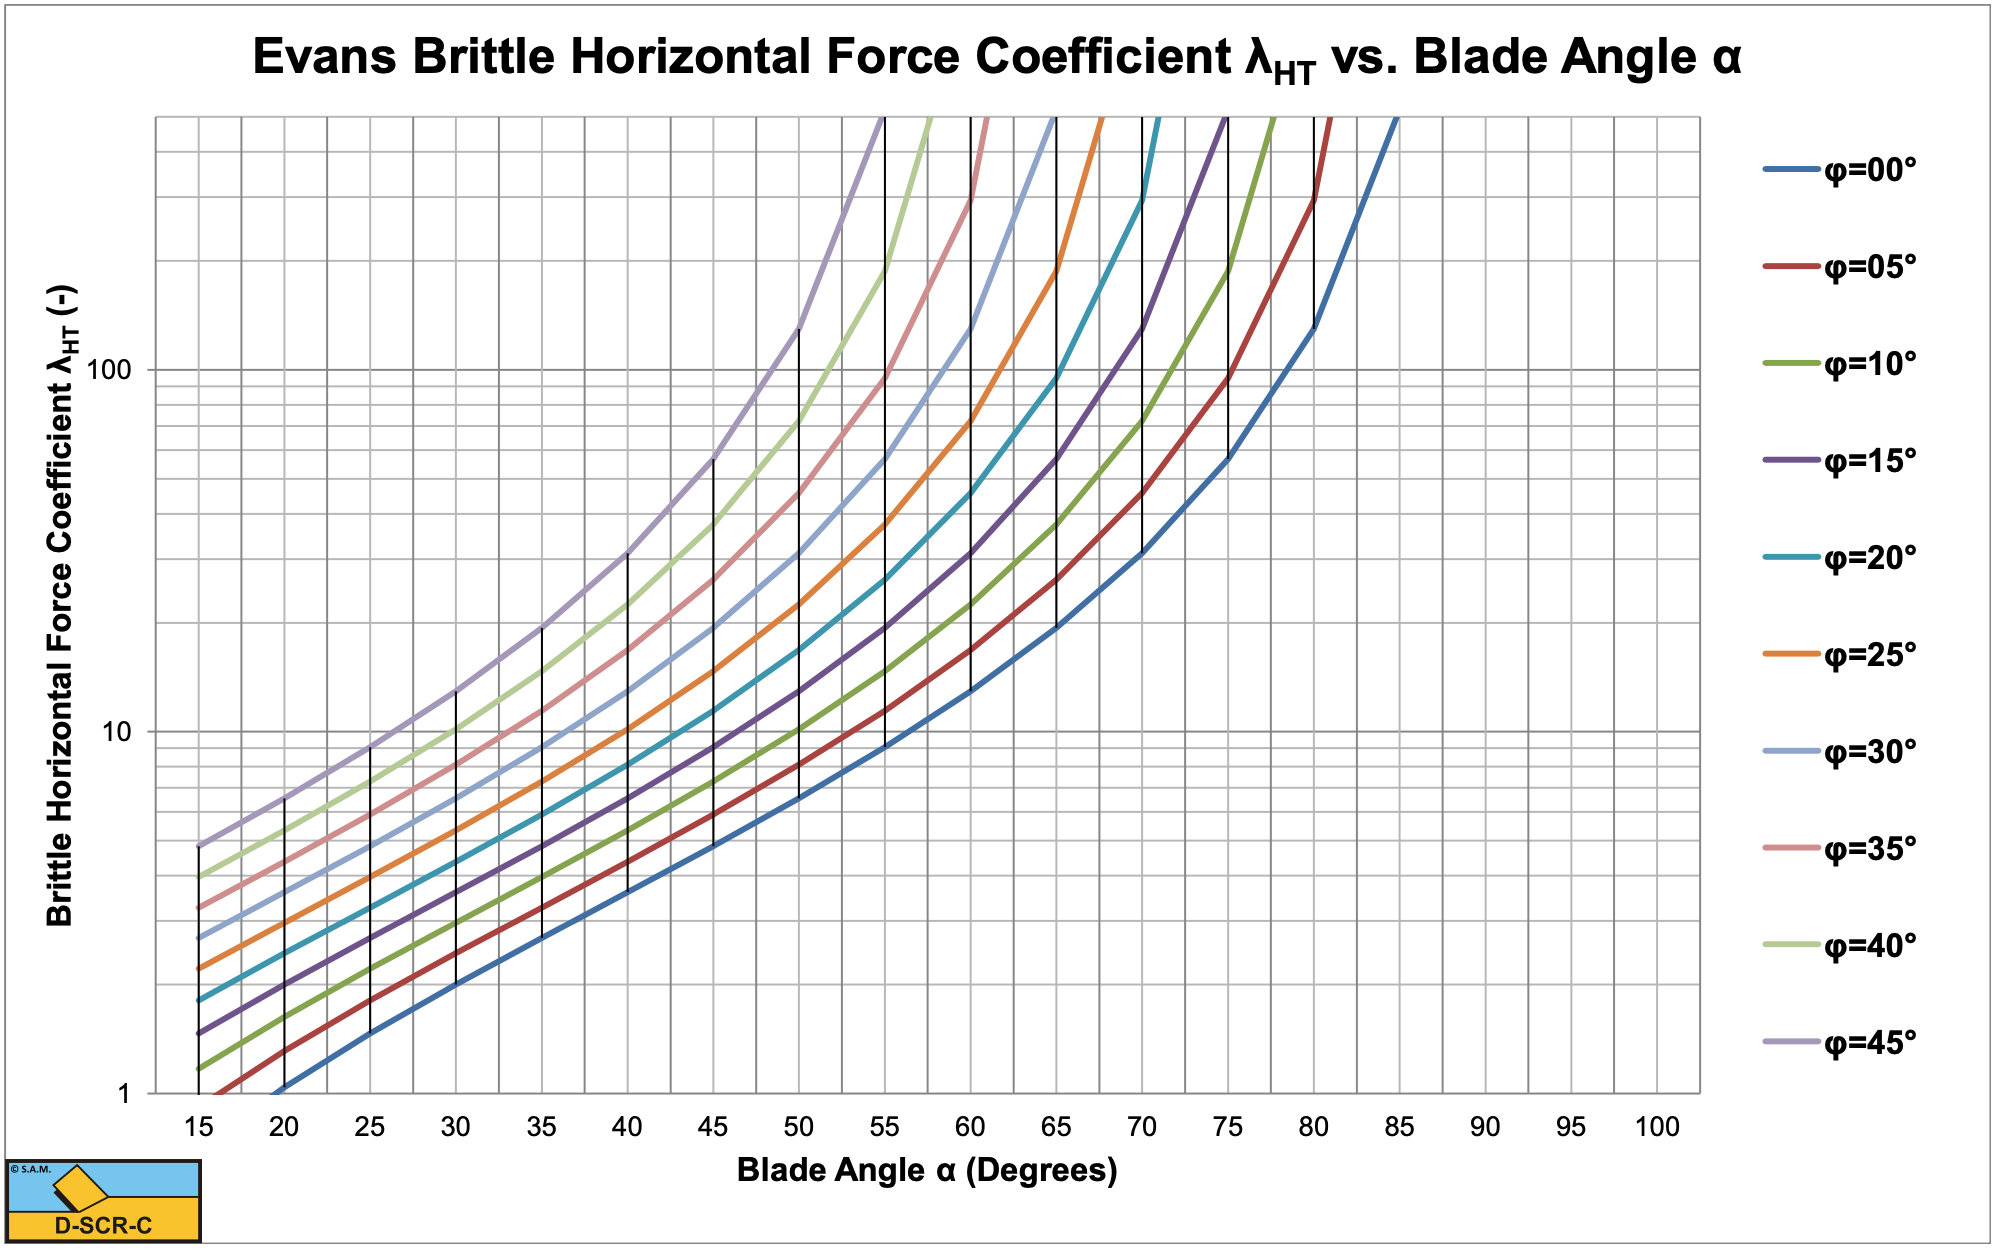
The Evans approach gives much higher values, since it is based on reaching the tensile strength in the whole failure plane. The DSCRCM model assumes reaching the tensile strength only at the start of the tensile crack.
W.6 Brittle Tensile Failure based on Brittle Tensile Shear Angle