
6.6: Crosstab Query
- Page ID
- 15529

Standard MS Access queries produce results with column headings. Crosstab queries are queries where results are displayed with both row and column headings.
We limit our discussion to the use of the Crosstab Query Wizard for creating crosstab queries.
Example
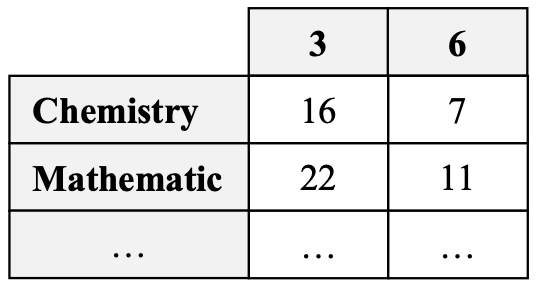
As an example suppose we wish to display for each department a count of the number of 3 and 6 credit hour courses. The counts are to appear in matrix format where rows are labeled with department names and are columns appear with labels 3 and 6. Below is an outline of how the results should appear:
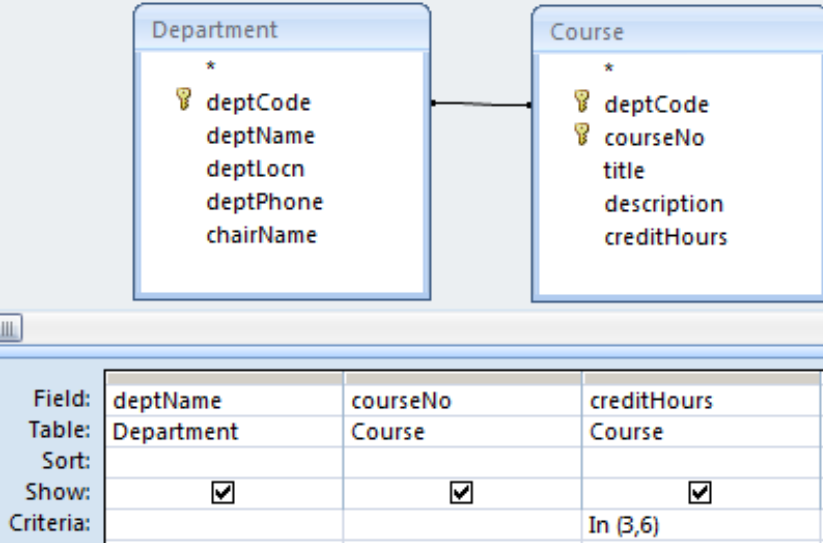
Crosstab queries have at least three fields; one field (department code) is used for row labels, another field (credit hours) is used for column labels, and one field (course number) is used with an aggregate function (Count).
We can begin by creating a Simple query that retrieves all the necessary values:
Next we save the query (say Q1) and create a new query using the Crosstab query wizard. The wizard prompts for
- the table/query to use as the basis for the new crosstab query (the query just saved \(\rightarrow\) Q1)
- the field to use for row labels \(\rightarrow\) deptName
- the field to use for column labels \(\rightarrow\) creditHours
- the field and the aggregate function to use for summarizing data \(\rightarrow\) courseNo / Count
Running the query shows several columns: the department name (values in this column are the row labels), total over the remaining columns for the row, columns for credit hour values 3 and 6 (the column labels). For example:
|
CrosstabQuery |
|||
|---|---|---|---|
|
Dept Name |
Total Of courseNo |
3 |
6 |
|
Statistics |
16 |
15 |
1 |
|
Mathematics |
18 |
6 |
12 |
Exercises
Exercise \(\PageIndex{1}\)
Create and run the query to display for each department a count of the number of 3 and 6 credit hour courses.
Exercise \(\PageIndex{2}\)
Modify the query so that credit hour values appear as row labels and department names appear as column labels.