
6.5: The Debugger
- Page ID
- 36364

The debugger is arguably the most powerful tool in the Squeak tool suite. It is used not just for debugging, but also for writing new code. To demonstrate the debugger, let’s start by writing a bug!

Code \(\PageIndex{1}\) (Squeak): A Buggy Method
suffix
    "assumes that I'm a file name, and answers my suffix, the part after the last dot"
    | dot dotPosition |
    dot := FileDirectory dot.
    dotPosition := (self size to: 1 by: --1) detect: [ :i | (self at: i) = dot ].
    ↑ self copyFrom: dotPosition to: self size
Of course, we are sure that such a trivial method will work, so instead of writing an SUnit test, we just type 'readme.txt' suffix in a workspace and print it (p). What a surprise! Instead of getting the expected answer 'txt', a PreDebugWindow pops up, as shown in Figure \(\PageIndex{1}\).
The PreDebugWindow has a title-bar that tells us what error occurred, and shows us a stack trace of the messages that led up to the error. Starting from the bottom of the trace, UndefinedObject»DoIt represents the code that was compiled and run when we selected 'readme.txt' suffix in the workspace and asked Squeak to print it. This code, of course, sent the message suffix to a ByteString object ('readme.txt'). This caused the inherited suffix method in class String to execute; all this information is encoded in the next line of the stack trace, ByteString(String)»suffix. Working up the stack, we can see that suffix sent detect:. . . and eventually detect:ifNone sent errorNotFound.
To find out why the dot was not found, we need the debugger itself, so click on Debug.
\(\bigstar\) You can also open the debugger by clicking on any of the lines on the stack trace. If you do this, the debugger will open already focussed on the corresponding method.
The debugger is shown in Figure \(\PageIndex{2}\); it looks intimidating at first, but it is quite easy to use. The title-bar and the top pane are very similar to those that we saw in the PreDebugWindow. However, the debugger combines the stack trace with a method browser, so when you select a line in the stack trace, the corresponding method is shown in the pane below. It’s important to realize that the execution that caused the error is still in your image, but in a suspended state. Each line of the stack trace represents a frame on the execution stack that contains all of the information necessary to continue the execution. This includes all of the objects involved in the computation, with their instance variables, and all of the temporary variables of the executing methods.

In Figure \(\PageIndex{2}\) we have selected the detect:ifNone: method in the top pane. The method body is displayed in the center pane; the blue highlight around the message value shows that the current method has sent the message value and is waiting for an answer.
The four panes at the bottom of the debugger are really two mini- inspectors (without workspace panes). The inspector on the left shows the current object, that is, the object named self in the center pane. As you select different stack frames, the identity of self may change, and so will the contents of the self-inspector. If you click on self in the bottom-left pane, you will see that self is the interval (10 to: 1 by -1), which is what we expect. The workspace panes are not needed in the debugger’s mini-inspectors because all of the variables are also in scope in the method pane; you should feel free to type or select expressions in this pane and evaluate them. You can always cancel (l) your changes using the menu or CMD–l.
The inspector on the right shows the temporary variables of the current context. In Figure \(\PageIndex{2}\), value was sent to the parameter exceptionBlock.
\(\bigstar\) To see the current value of this parameter, click on exceptionBlock in the context inspector. This will tell you that exceptionBlock is [self errorNotFound: ...]. So, it is not surprising that we see the corresponding error message.
Incidentally, if you want to open a full inspector or explorer on one of the variables shown in the mini-inspectors, just double-click on the name of the variable, or select the name of the variable and choose inspect (i) or explore (I) from the yellow button menu. This can be useful if you want to watch how a variable changes while you execute other code.
Looking back at the method window, we see that we expected the penultimate line of the method to find dot in the string 'readme.txt', and that execution should never have reached the final line. Squeak does not let us run an execution backwards, but it does let us start a method again, which works very well in code such as this that does not mutate objects, but instead creates new ones.
\(\bigstar\) Click Restart, and you will see that the locus of execution returns to the first statement of the current method. The blue highlight shows that the next message to be sent will be do: (see Figure \(\PageIndex{3}\)).
The Into and Over buttons give us two different ways to step through the execution. If you click Over, Squeak executes the current message-send (in this case the do:) in one step, unless there is an error. So Over will take us to the next message-send in the current method, which is value: this is exactly where we started, and not much help. What we need to do is to find out why the do: is not finding the character that we are looking for.
\(\bigstar\) Click Over, and then click Restart to get back to the situation shown in Figure \(\PageIndex{3}\).
\(\bigstar\) Click Into; Squeak will go into the method corresponding to the highlighted message-send, in this case, Collection»do:.
However, it turns out that this is not much help either: we can be fairly confident that Collection»do: is not broken. The bug is much more likely to be in what we asked Squeak to do. Through is the appropriate button to use in this case: we want to ignore the details of the do: itself and focus on the execution of the argument block.

\(\bigstar\) Click on Through a few times. Select each in the context window as you do so. You should see each count down from 10 as the do: method executes.
When each is 7 we expect the ifTrue: block to be executed, but it isn’t. To see what is going wrong, go Into the execution of value: as illustrated in Figure \(\PageIndex{4}\).
After clicking Into, we find ourselves in the position shown in Figure \(\PageIndex{5}\). It looks at first that we have gone back to the suffix method, but this is because we are now executing the block that suffix provided as argument to detect:. If you select i in the context inspector, you can see its current value, which should be 7 if you have been following along. You can then select the corresponding element of self from the self-inspector. In Figure \(\PageIndex{5}\) you can see that element 7 of the string is character 46, which is indeed a dot. If you select dot in the context inspector, you will see that its value is '.'. And now you see why they are not equal: the seventh character of 'readme.txt' is of course a Character, while dot is a String.
Now that we see the bug, the fix is obvious: we have to convert dot to a character before starting to search for it.


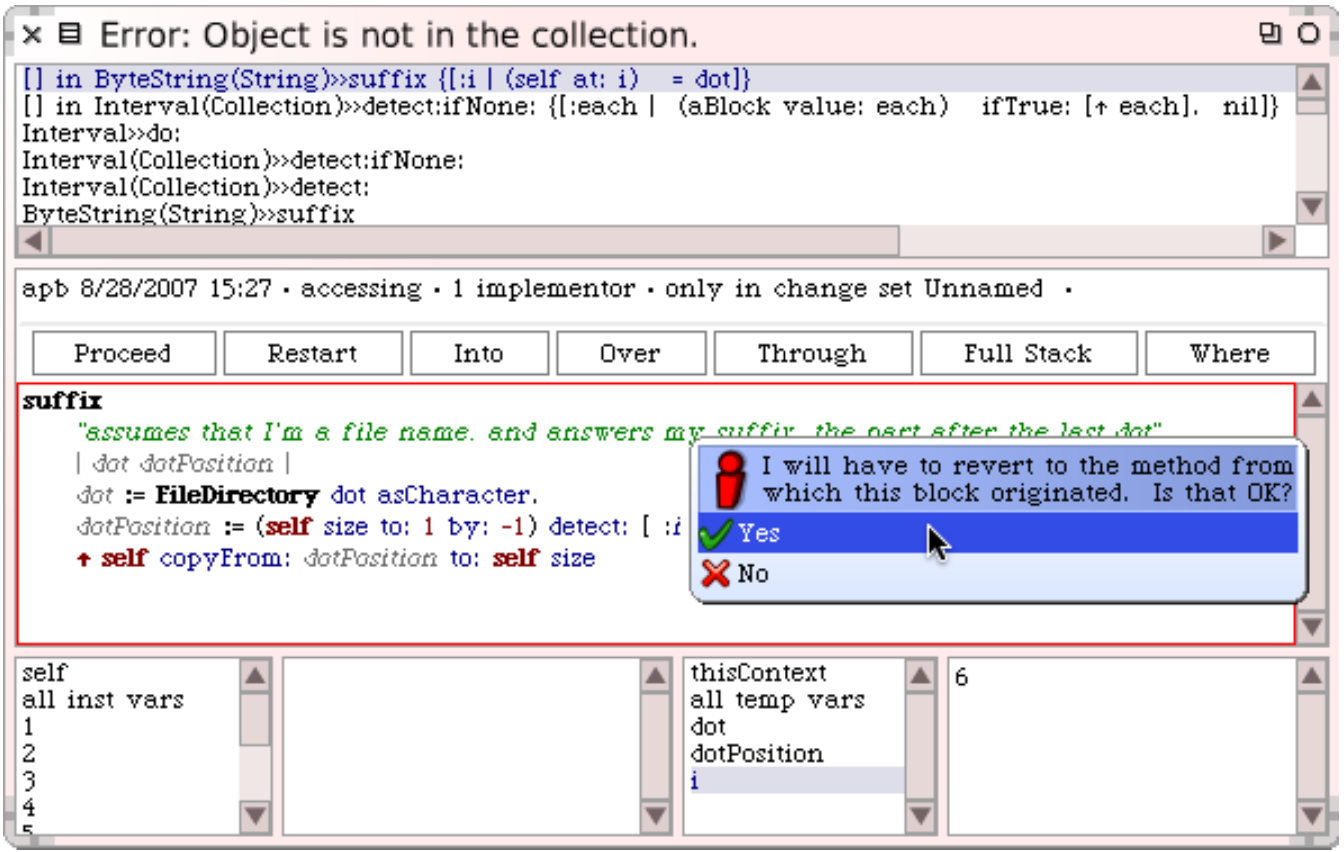
\(\bigstar\) Change the code right in the debugger so that the assignment reads dot := FileDirectory dot asCharacter and accept the change.
Because we are executing code inside a block that is inside a detect:, several stack frames will have to be abandoned in order to make this change. Squeak asks us if this is what we want (see Figure \(\PageIndex{6}\)), and, assuming that we click yes, will save (and compile) the new method.
\(\bigstar\) Click Restart and then Proceed; the debugger window will vanish, and the evaluation of the expression 'readme.txt' suffix will complete, and print the answer '.txt'
Is the answer correct? Unfortunately, we can’t say for sure. Should the suffix be .txt or txt? The method comment in suffix is not very precise. The way to avoid this sort of problem is to write an SUnit test that defines the answer.
Code \(\PageIndex{2}\) (Squeak): A Simple Test for The suffix Method
testSuffixFound
    self assert: 'readme.txt' suffix = 'txt'
The effort required to do that was little more than to run the same test in the workspace, but using SUnit saves the test as executable documentation, and makes it easy for others to run. Moreover, if you add Code \(\PageIndex{2}\) to the class StringTest and run that test suite with SUnit, you can very quickly get back to debugging the error. SUnit opens the debugger on the failing assertion, but you need only go back down the stack one frame, Restart the test and go Into the suffix method, and you can correct the error, as we are doing in Figure \(\PageIndex{7}\). It is then only a second of work to click on the Run Failures button in the SUnit Test Runner, and confirm that the test now passes.

Here is a better test:
Code \(\PageIndex{3}\) (Squeak): A Better Test for The suffix Method
testSuffixFound
    self assert: 'readme.txt' suffix = 'txt'.
    self assert: 'read.me.txt' suffix = 'txt'
Why is this test better? Because it tells the reader what the method should do if there is more than one dot in the target String.
There are a few other ways to get into the debugger in addition to catching errors and assertion failures. If you execute code that goes into an infinite loop, you can interrupt it and open a debugger on the computation by typing CMD–. (that’s a full stop or a period, depending on where you learned English).1 You can also just edit the suspect code to insert self halt. So, for example, we might edit the suffix method to read as follows:
Code \(\PageIndex{4}\) (Squeak): Inserting a halt into The suffix Method
suffix
    "assumes that I'm a file name, and answers my suffix, the part after the last dot"
    | dot dotPosition |
    dot := FileDirectory dot asCharacter.
    dotPosition := (self size to: 1 by: --1) detect: [ :i | (self at: i) = dot ].
    self halt.
    ↑ self copyFrom: dotPosition to: self size
When we run this method, the execution of the self halt will bring up the pre-debugger, from where we can proceed, or go into the debugger and look at variables, step the computation, and edit the code.
That’s all there is to the debugger, but it’s not all there is to the suffix method. The initial bug should have made you realize that if there is no dot in the target string, the suffix method will raise an error. This isn’t the behaviour that we want, so let’s add a second test to specify what should happen in this case.
Code \(\PageIndex{5}\) (Squeak): A Second Test for The suffix Method: The Target Has No Suffix
testSuffixNotFound
    self assert: 'readme' suffix = ''
\(\bigstar\) Add Code \(\PageIndex{5}\) to the test suite in class StringTest, and watch the test raise an error. Enter the debugger by selecting the erroneous test in SUnit, and edit the code so that the test passes. The easiest and clearest way to do this is to replace the detect: message by detect: ifNone:, where the second argument is a block that simply returns the string size.
We will learn more about SUnit in Chapter 7.
- It is also useful to know that you can bring up an emergency debugger at any time by typing CMD–SHIFT–.