
7.2: Graphics Methods
- Page ID
- 15313

You are probably used to Cartesian coordinates, where x and y values can be positive or negative. In contrast, Java uses a coordinate system where the origin is in the upper-left corner. That way, x and y are always positive integers. Figure 16.2.1 shows these coordinate systems.
Graphical coordinates are measured in pixels; each pixel corresponds to a dot on the screen.

To draw on the canvas, you invoke methods on a Graphics object. You don’t have to create the Graphics object; it gets created when you create the Canvas, and it gets passed as an argument to paint.
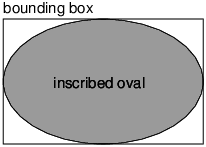
The previous example used fillOval, which has the following signature:
/**
 * Fills an oval bounded by the specified rectangle with
 * the current color.
 */
public void fillOval(int x, int y, int width, int height)
The four parameters specify a bounding box, which is the rectangle in which the oval is drawn. x and y specify the the location of the upper-left corner of the bounding box. The bounding box itself is not drawn (see Figure 16.2.2).
To choose the color of a shape, invoke setColor on the Graphics object:
g.setColor(Color.red);
The setColor method determines the color of everything that gets drawn afterward. Color.red is a constant provided by the Color class; to use it you have to import java.awt.Color. Other colors include:
black       blue      cyan     darkGray   gray    green
lightGray   magenta   orange   pink       white   yellow
You can create your own colors by specifying the red, green, and blue (RGB) components. For example:
Color purple = new Color(128, 0, 128);
Each value is an integer in the range 0 (darkest) to 255 (lightest). The color (0, 0, 0) is black, and (255, 255, 255) is white.
You can set the background color of the Canvas by invoking setBackground:
canvas.setBackground(Color.white);