
11.2: Sexual Demographics in America
- Page ID
- 48367

Let’s model the question of heterosexual partners in graph theoretic terms. To do this, we’ll let \(G\) be the graph whose vertices, \(V\), are all the people in America. Then we split \(V\) into two separate subsets: \(M\), which contains all the males, and \(F\), which contains all the females.2 We’ll put an edge between a male and a female iff they have been sexual partners. This graph is pictured in Figure 11.2 with males on the left and females on the right.
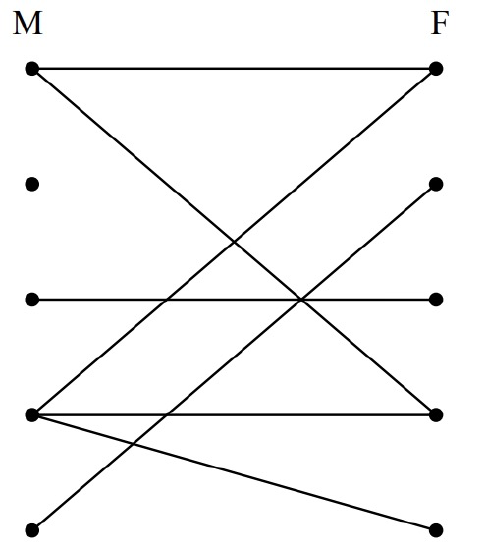
Actually, this is a pretty hard graph to figure out, let alone draw. The graph is enormous: the US population is about 300 million, so \(|V| \approx 300M\). Of these, approximately 50.8% are female and 49.2% are male, so \(|M| \approx 147.6 M\), and \(|F| \approx 152.4M\). And we don’t even have trustworthy estimates of how many edges there are, let alone exactly which couples are adjacent. But it turns out that we don’t need to know any of this—we just need to figure out the relationship between the average number of partners per male and partners per female. To do this, we note that every edge has exactly one endpoint at an \(M\) vertex (remember, we’re only considering male-female relationships); so the sum of the degrees of the \(M\) vertices equals the number of edges. For the same reason, the sum of the degrees of the \(F\) vertices equals the number of edges. So these sums are equal:
\[\nonumber \sum_{x \in M} \text{deg}(x) = \sum_{y \in F} \text{deg}(y)\]
Now suppose we divide both sides of this equation by the product of the sizes of the two sets, \(|M| \cdot |F|:\)
\[\nonumber \dfrac{\sum_{x \in M} \text{deg}(x)}{|M|} \cdot \dfrac{1}{|F|} = \dfrac{\sum_{y \in F} \text{deg}(y)}{|F|} \cdot \dfrac{1}{|M|}\]
The terms above in parentheses are the average degree of an \(M\) vertex and the average degree of an \(F\) vertex. So we know:
\[\text{Avg. deg in }M = \dfrac{|F|}{|M|} \cdot \text{Avg. deg in }F\]
In other words, we’ve proved that the average number of female partners of males in the population compared to the average number of males per female is determined solely by the relative number of males and females in the population.
Now the Census Bureau reports that there are slightly more females than males in America; in particular \(|F| / |M|\) is about 1.035. So we know that males have on average 3.5% more opposite-gender partners than females, and that this tells us nothing about any sex’s promiscuity or selectivity. Rather, it just has to do with the relative number of males and females. Collectively, males and females have the same number of opposite gender partners, since it takes one of each set for every partnership, but there are fewer males, so they have a higher ratio. This means that the University of Chicago, ABC, and the Federal government studies are way off. After a huge effort, they gave a totally wrong answer.
There’s no definite explanation for why such surveys are consistently wrong. One hypothesis is that males exaggerate their number of partners—or maybe females downplay theirs—but these explanations are speculative. Interestingly, the principal author of the National Center for Health Statistics study reported that she knew the results had to be wrong, but that was the data collected, and her job was to report it.
The same underlying issue has led to serious misinterpretations of other survey data. For example, a couple of years ago, the Boston Globe ran a story on a survey of the study habits of students on Boston area campuses. Their survey showed that on average, minority students tended to study with non-minority students more than the other way around. They went on at great length to explain why this “remarkable phenomenon” might be true. But it’s not remarkable at all. Using our graph theory formulation, we can see that all it says is that there are fewer minority students than non-minority students, which is, of course, what “minority” means.
Handshaking Lemma
The previous argument hinged on the connection between a sum of degrees and the number of edges. There is a simple connection between these in any graph:
Lemma 11.2.1. The sum of the degrees of the vertices in a graph equals twice the number of edges.
Proof. Every edge contributes two to the sum of the degrees, one for each of its endpoints. \(\quad \blacksquare\)
We refer to Lemma 11.2.1 as the Handshaking Lemma: if we total up the number of people each person at a party shakes hands with, the total will be twice the number of handshakes that occurred.
2For simplicity, we’ll ignore the possibility of someone being both a man and a woman, or neither.