
2.7: Exercises
- Page ID
- 30771

Analysis
1. Determine the impedance of the circuit of Figure \(\PageIndex{1}\) for a 1 kHz sine.
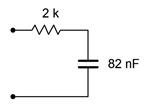
Figure \(\PageIndex{1}\)
2. Determine the impedance of the circuit of Figure \(\PageIndex{1}\) for a 5 kHz sine.
3. Determine the impedance of the circuit of Figure \(\PageIndex{2}\) for a 10 kHz sine.
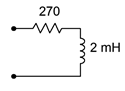
Figure \(\PageIndex{2}\)
4. Determine the impedance of the circuit of Figure \(\PageIndex{2}\) for a 50 kHz sine.
5. Determine the impedance of the circuit of Figure \(\PageIndex{3}\) for a 1 kHz sine.
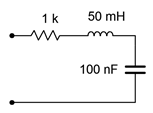
Figure \(\PageIndex{3}\)
6. Determine the impedance of the circuit of Figure \(\PageIndex{3}\) for a 500 Hz sine.
7. Determine the impedance of the circuit of Figure \(\PageIndex{4}\).
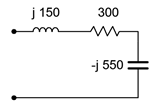
Figure \(\PageIndex{4}\)
8. In the circuit of Figure \(\PageIndex{4}\), if the input frequency is 100 Hz, what is the value of the inductor, in mH?
9. In the circuit of Figure \(\PageIndex{4}\), if the input frequency is 200 Hz, what is the value of the capacitor, in \(\mu\)F?
10. Draw the voltage and current waveforms for the circuit of Figure \(\PageIndex{5}\).
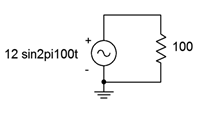
Figure \(\PageIndex{5}\)
11. Draw the voltage and current waveforms for the circuit of Figure \(\PageIndex{6}\).
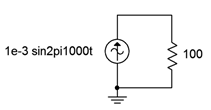
Figure \(\PageIndex{6}\)
12. Draw the voltage and current waveforms for the circuit of Figure \(\PageIndex{7}\) if \(E\) is a one volt peak sine at a frequency of 10 kHz and \(C\) = 3.3 nF.
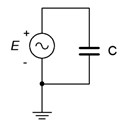
Figure \(\PageIndex{7}\)
13. Draw the voltage and current waveforms for the circuit of Figure \(\PageIndex{8}\) if \(E\) is a two volt peak-peak sine at a frequency of 40 Hz and \(L\) = 33 mH.
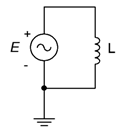
Figure \(\PageIndex{8}\)
14. Draw the voltage and current waveforms for the circuit of Figure \(\PageIndex{9}\) if \(I\) is a 10 \(\mu\)A peak sine at a frequency of 2 kHz and \(C\) = 6.8 nF.
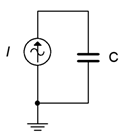
Figure \(\PageIndex{9}\)
15. Draw the voltage and current waveforms for the circuit of Figure \(\PageIndex{10}\) if \(I\) is a two amp peak-peak sine at a frequency of 40 Hz and \(L\) = 33 mH.
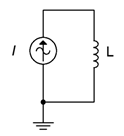
Figure \(\PageIndex{10}\)
16. Determine the impedance of the circuit of Figure \(\PageIndex{11}\).
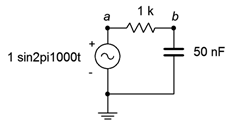
Figure \(\PageIndex{11}\)
17. Determine the impedance of the circuit of Figure \(\PageIndex{11}\) using a frequency of 10 kHz.
18. For the circuit of Figure \(\PageIndex{11}\), determine the circulating current and the voltages across each component. Draw a phasor diagram of the three component voltages. Also find the time delay between the voltages of the components.
19. For the circuit of Figure \(\PageIndex{11}\) using a frequency of 10 kHz, determine the circulating current and the voltages across each component. Draw a phasor diagram of the three component voltages and determine the time delay between the capacitor and resistor voltages.
20. Determine the impedance of the circuit of Figure \(\PageIndex{12}\).
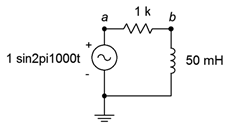
Figure \(\PageIndex{12}\)
21. Determine the impedance of the circuit of Figure \(\PageIndex{12}\) using a frequency of 10 kHz.
22. For the circuit of Figure \(\PageIndex{12}\), determine the circulating current and the voltages across each component. Also find the time delay between the voltages of the components.
23. For the circuit of Figure \(\PageIndex{12}\) with a frequency of 3 kHz, determine the circulating current and the voltages across each component. Also find the time delay between the voltages of the components.
24. For the circuit of Figure \(\PageIndex{13}\), determine the circulating current.
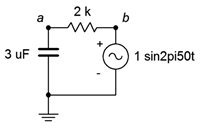
Figure \(\PageIndex{13}\)
25. Determine the impedance of the circuit of Figure \(\PageIndex{13}\) using a frequency of 1.5 kHz.
26. For the circuit of Figure \(\PageIndex{13}\), determine the circulating current and the voltages across each component. Also find the time delay between the voltages of the components.
27. For the circuit of Figure \(\PageIndex{13}\) with a frequency of 1.5 kHz, determine the circulating current and the voltages across each component. Also find the time delay between the voltages of the components.
28. For the circuit of Figure \(\PageIndex{14}\), determine the circulating current and the voltages across each component. Draw a phasor diagram of the three component voltages and determine the time delay between the inductor and resistor voltages.
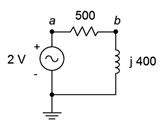
Figure \(\PageIndex{14}\)
29. For the circuit of Figure \(\PageIndex{15}\), determine the circulating current and the voltages across each component.
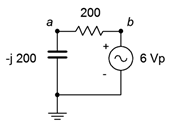
Figure \(\PageIndex{15}\)
30. For the circuit of Figure \(\PageIndex{16}\), determine the circulating current and the voltages across each component.
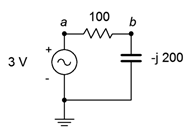
Figure \(\PageIndex{16}\)
31. For the circuit of Figure \(\PageIndex{17}\), determine the applied voltage and the voltages across each component.
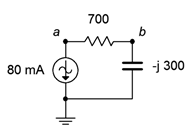
Figure \(\PageIndex{17}\)
32. For the circuit of Figure \(\PageIndex{18}\), determine the applied voltage and the voltages across each component.
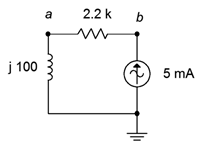
Figure \(\PageIndex{18}\)
33. For the circuit of Figure \(\PageIndex{19}\), determine the circulating current and the voltages across each component.
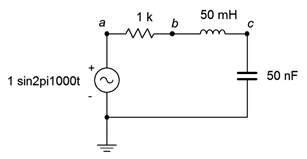
Figure \(\PageIndex{19}\)
34. Repeat the previous problem using an input frequency of 10 kHz.
35. For the circuit of Figure \(\PageIndex{20}\), determine the circulating current and the voltages across each component. The source is a 10 volt peak sine at 20 kHz, \(R = 200 \Omega\), \(C\) = 100 nF and \(L\) = 1 mH.
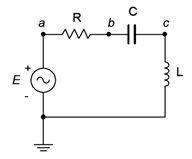
Figure \(\PageIndex{20}\)
36. For the circuit of Figure \(\PageIndex{20}\), find \(v_b\) and \(v_{ac}\).
37. For the circuit of Figure \(\PageIndex{21}\), find \(v_b\) and \(v_{ac}\). The source is a 50 volt peakpeak sine at 10 kHz, \(R = 100 \Omega\), \(C\) = 200 nF and \(L\) = 1 mH.
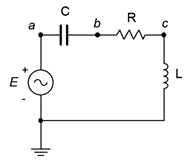
Figure \(\PageIndex{21}\)
38. For the circuit of preceding problem, determine the circulating current and the voltages across each component.
39. For the circuit of Figure \(\PageIndex{22}\), determine the circulating current and the voltages across each component. \(E\) is a 1 volt peak 2 kHz sine. Also, draw a phasor diagram of the four component voltages.
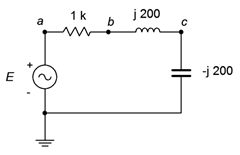
Figure \(\PageIndex{22}\)
40. For the circuit of Figure \(\PageIndex{22}\), find \(v_b\) and \(v_{ca}\). \(E\) is a 1 volt peak 2 kHz sine.
41. For the circuit of Figure \(\PageIndex{23}\), determine \(v_b\), \(v_c\) and \(v_{ac}\). \(E\) is a 10 volt peak 15 kHz sine.
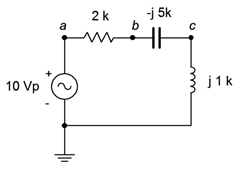
Figure \(\PageIndex{23}\)
42. For the circuit of Figure \(\PageIndex{24}\), determine the circulating current and the voltages across each component. \(E\) is a 100 millivolt peak 250 Hz sine. Further, draw a phasor diagram of the four component voltages.
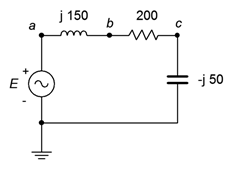
Figure \(\PageIndex{24}\)
43. For the circuit of Figure \(\PageIndex{25}\), determine the circulating current and the voltages across each component. \(E\) is a 2 volt RMS 1 kHz sine. Also, draw a phasor diagram of the four component voltages.
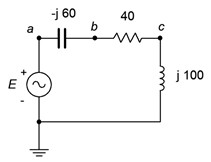
Figure \(\PageIndex{25}\)
44. For the circuit of Figure \(\PageIndex{26}\), determine \(v_b\), \(v_c\) and \(v_{ac}\). \(E\) is a 1 volt peak 25 kHz sine.
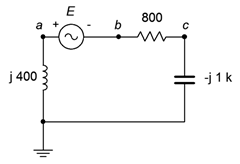
Figure \(\PageIndex{26}\)
45. For the circuit of Figure \(\PageIndex{27}\), determine the voltages across each component. The source is a 50 mA peak sine at 15 kHz, \(R = 200 \Omega\), \(C\) = 100 nF and \(L\) = 1.5 mH.
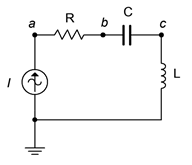
Figure \(\PageIndex{27}\)
46. For the circuit of Figure \(\PageIndex{28}\), determine \(v_{ac}\), \(v_b\) and \(v_c\). The source is a 10 mA peak-peak sine at 50 kHz, \(R = 2 k\Omega\), \(C\) = 10 nF and \(L\) = 800 \(\mu\)H.
Figure \(\PageIndex{28}\)
47. For the circuit of Figure \(\PageIndex{29}\), determine the voltages across each component. The source is a 2 mA RMS sine at 1 kHz, \(R = 1.2 k\Omega\), \(C\) = 750 nF and \(L\) = 6.8 mH.
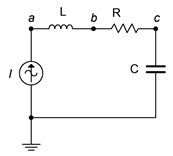
Figure \(\PageIndex{29}\)
48. For the circuit of Figure \(\PageIndex{30}\), determine \(v_{ac}\), \(v_b\) and \(v_a\). The source is a 2 mA peak-peak sine at 300 kHz, \(R = 560 \Omega\), \(C\) = 6.8 nF and \(L\) = 400 \(\mu\)H.
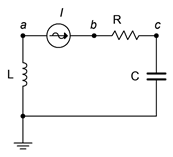
Figure \(\PageIndex{30}\)
49. For the circuit of Figure \(\PageIndex{31}\), determine the voltages across each component.
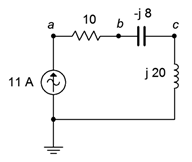
Figure \(\PageIndex{31}\)
50. For the circuit of Figure \(\PageIndex{32}\), determine the voltages across each component. Further, draw a phasor diagram of the four component voltages.
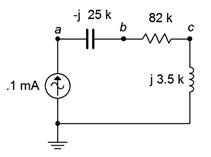
Figure \(\PageIndex{32}\)
51. For the circuit of Figure \(\PageIndex{33}\), \(v_{ac}\), \(v_b\) and \(v_c\). The source is 5 mA peak at 8 kHz.
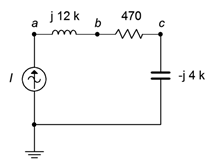
Figure \(\PageIndex{33}\)
52. For the circuit of Figure \(\PageIndex{34}\), determine the voltages across each component. The source is 20 mA peak at 100 kHz.
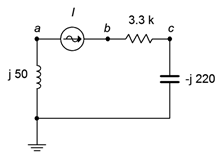
Figure \(\PageIndex{34}\)
53. For the circuit of Figure \(\PageIndex{35}\), determine the voltages across each component.
Figure \(\PageIndex{35}\)
54. For the circuit of Figure \(\PageIndex{36}\), determine the voltages \(v_b\) and \(v_{db}\). \(E1 = 2\angle 0^{\circ}\) and \(E2 = 5\angle 90^{\circ}\).
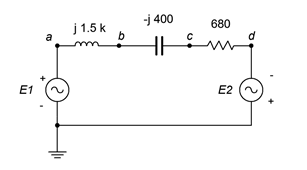
Figure \(\PageIndex{36}\)
55. Determine the inductance and capacitance values for the circuit of problem 52.
56. For the circuit of Figure \(\PageIndex{36}\), determine the inductor and capacitor values if the source frequency is 12 kHz.
57. For the circuit of Figure \(\PageIndex{37}\), determine the voltages across each component. \(E1 = 1\angle 0^{\circ}\) and \(E2 = 8\angle 60^{\circ}\).
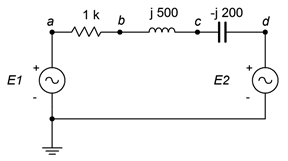
Figure \(\PageIndex{37}\)
Design
58. Redesign the circuit of Figure \(\PageIndex{11}\) using a new capacitor such that the current magnitude from the source is 100 \(\mu\)A.
59. Redesign the circuit of Figure \(\PageIndex{12}\) using a new frequency such that the current magnitude from the source is 200 \(\mu\)A.
60. For the circuit of Figure \(\PageIndex{11}\), determine a new capacitor such that \(|X_C| = R\).
61. For the circuit of Figure \(\PageIndex{12}\), determine a new frequency such that \(|X_L| = R\).
Challenge
62. For the circuit of Figure \(\PageIndex{19}\), determine a new frequency such that \(|X_C| = |X_L|\).
63. Determine the output voltage across the capacitor of Figure \(\PageIndex{11}\) at frequencies of 100 Hz, 5 kHz and 20 kHz. In light of this, if the input signal was a 1 kHz square wave instead of a sine wave as pictured, how would this circuit affect the shape of the output waveform (hint: consider superposition)?
64. Assume that you are troubleshooting a circuit like the one shown in Figure \(\PageIndex{20}\). \(E\) is a 2 volt peak sine at 2 kHz, \(R = 390 \Omega\), \(C\) = 100 nF and \(L\) = 25 mH. The circulating current measures approximately 4 mA with a lagging phase angle of just under −40 degrees. What is the likely problem?
65. Given the circuit shown in Figure \(\PageIndex{20}\), find the values for \(C\) and \(L\) if the source is a 6 volt sine wave at 1 kHz, \(R = 2 k\Omega\), \(v_R\) = 4 V and \(v_L\) = 5 V.
66. The circuit of Figure \(\PageIndex{38}\) can be used as part of a loudspeaker crossover network. The goal of this circuit is to steer the low frequency tones to the low frequency transducer (labeled here as “Loudspeaker” and often referred to as a woofer). A similar network substitutes a capacitor for the inductor to steer the high frequency tones to the high frequency transducer (AKA tweeter). These networks can be pictured as frequency sensitive voltage dividers. At very low frequencies, \(X_C\) is very large and blocks low frequency tones from reaching the tweeter. A mirror situation occurs with the inductor/woofer variant. The crossover frequency is the frequency at which the reactance magnitude equals the resistance. Assuming simple \(8 \Omega\) resistances for the woofer and tweeter, determine capacitor and inductor values that would yield a 1.5 kHz crossover frequency. How might this concept be extended to a mid-range loudspeaker that only produces tones in the middle of the musical frequency spectrum? (Note, this concept will be revisited in the final simulation problem, below, and also in the Simulation portion of Chapter 4 which covers series-parallel circuits.)
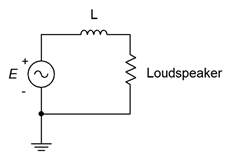
Figure \(\PageIndex{38}\)
Simulation
67. Simulate the solution of design problem 58 and determine if the values produce the required results.
68. Simulate the solution of design problem 59 and determine if the values produce the required results.
69. Simulate the solution of design problem 60 and determine if the values produce the required results. Hint: if the reactance/resistance magnitudes are the same, then the voltage magnitudes will be identical.
70. Simulate the solution of design problem 61 and determine if the values produce the required results. Hint: if the reactance/resistance magnitudes are the same, then the voltage magnitudes will be identical.
71. Simulate the solution of challenge problem 62 and determine if the new frequency produces the required results. Hint: if the reactance magnitudes are the same, then the voltage magnitudes will be identical. Further, their phases will cause these voltages to cancel, leaving the resistor voltage equal to the source voltage.
72. Using a transient analysis, crosscheck the crossover design of the final challenge problem, above. Plot the resistor (loudspeaker) voltage across the range of 100 Hz to 20 kHz for both sections.