
2.2: Investigation
- Page ID
- 28654

Activity A – Reading data from a single weather station
Begin by launching the NWS weather conditions page <https://www.wrh.noaa.gov/mesowest/getobext.php?wfo=pqr&sid=KPDX&num=72&raw=0>. Once you have it you should see something like Figure 2.2.1.
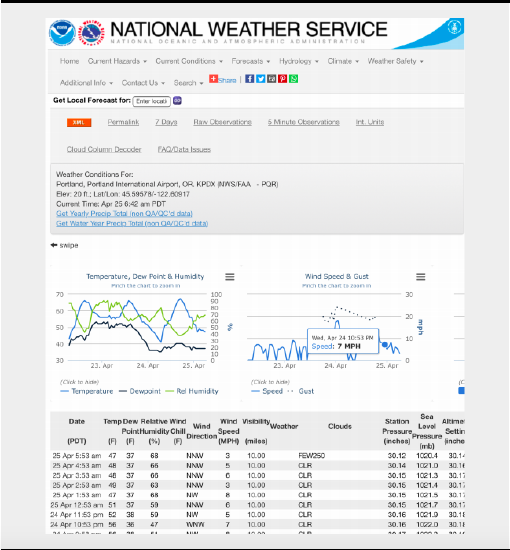
This page includes station metadata (e.g. latitude, longitude, and elevation), graphs showing temperature, dew point, humidity, wind speed and gust, and 1-hour precipitation over a three-day period, and the raw data used to construct these graphs. The latter table also includes wind direction, visibility, air pressure, and cloud types.
Weather station data - Questions
- What is the latitude longitude and elevation of the station?
- What kinds of data are being shown for this station? List the data types and write a definition for each one?
- How is the data being shown on the page? A way of showing data is often referred to as a data visualization strategy.
- What for you are the strengths and limitations of each data visualization technique?
- Look at the graph of temperature, dew point, and relative humidity. What seems to be the relationship between air temperature and relative humidity?
Activity B – Calculating climate statistics for a single station
Many of the data pages on the NWS site include a mixture of observational weather data (what is at the moment), forecast (what’s likely), and climate data\(^{1}\)(what’s normal and what’s extreme). The page you are looking at right now is unique in that it’s only observational data. What we will do with it now is to calculate some short-range climate statistics.
Climate statistics - Questions
- What is the highest and lowest temperature for all three days?
- What is the temperature range for all three days?
- What is the average temperature for all three days? This one may take you a while with a calculator.
- Answer questions 1, 2, and 3 for each day
- How does the average for each day compare to the three-day average? The difference between the daily averages and the longer period average is referred to as a temperature anomaly.
- Finally graph of the temperature anomalies you calculated.
Footnotes
\(^{1}\)Climate statistics are customarily calculated on the basis of what’s normal for at least 30 year periods.