
6.2: Investigation
- Page ID
- 28689

Activity A – Atmosphere/ocean circulation and climate regulation
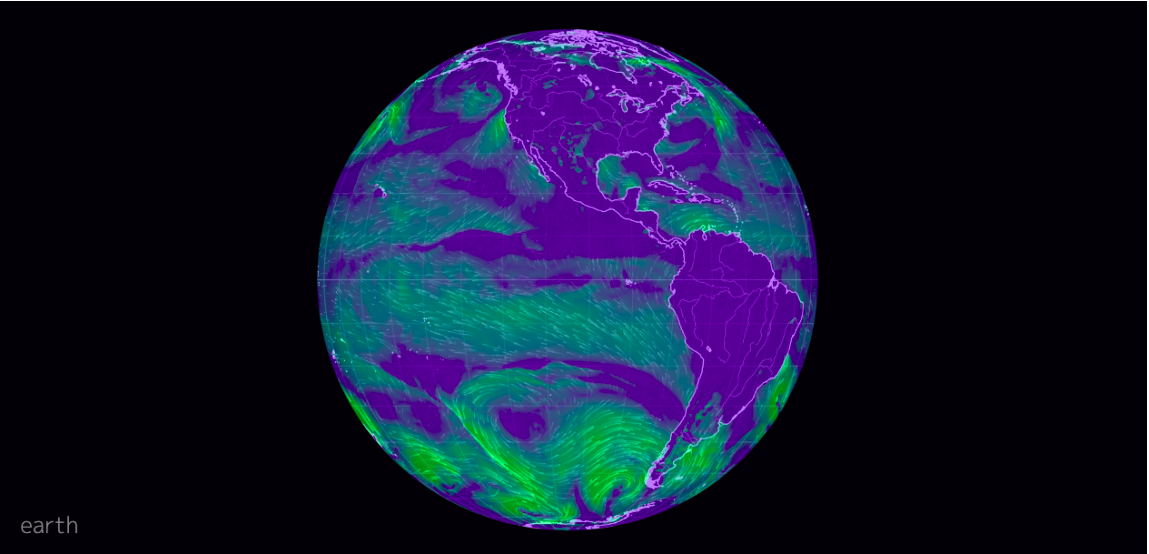
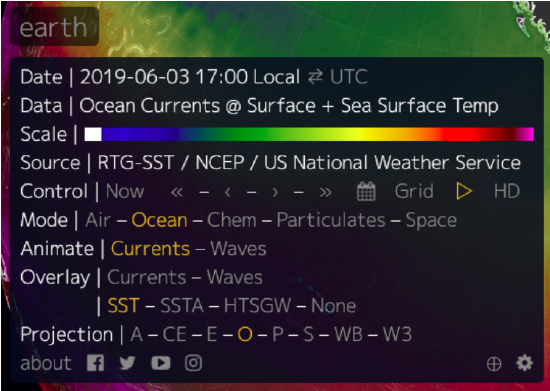
To begin this activity, launch Earth <https://earth.nullschool.net/>. This should give you a view of the earth that looks like Figure 6.2.1.
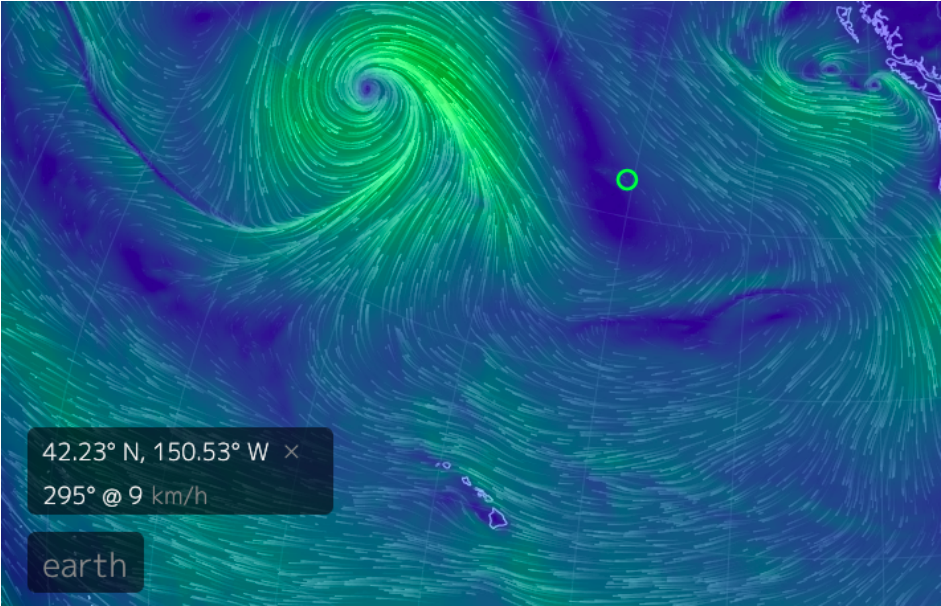
As you examine the globe you will notice four things. First, you can click and drag it to rotate it. Second, you can either swipe on your computer track pad or move the scroll wheel on your mouse to zoom in and out of the globe. Third, the globe shows wind direction with moving white streaks and wind speed by the length of the streaks and the color underlying them. Finally, if you click on the globe you will see a marker (green circle) appear at that place and a message panel in the lower right of the screen that gives the longitude, latitude, wind direction, and wind speed (Figure 6.2.2).
Once you have succeeded in setting up Earth in the previously described manner, create a worksheet in which you will record your answers to the following questions.
Questions
- What is the approximate latitude and longitude of where you are?
- What is the wind speed and direction there?
- Where near you is the wind speed the lowest?
- Where is it the fastest?
- Where does air seem to be flowing into a point? Looks rather like water flowing into a drain.
- Where does the air seem to be flowing away from a point?
For the entire planet to maintain a stable average annual temperature the solar energy it receives at the top of the atmosphere should equal the energy it radiates out into space in the form of infrared. However, even under equilibrium conditions like this, whole regions of the globe receive more energy than they lose (places like the tropics), while other sections loose more than they receive (polar areas). The implication of this is that heat energy must be moved from areas of excess to areas of deficit. Otherwise cold places would be much colder than they are now and warm places would be much warmer.
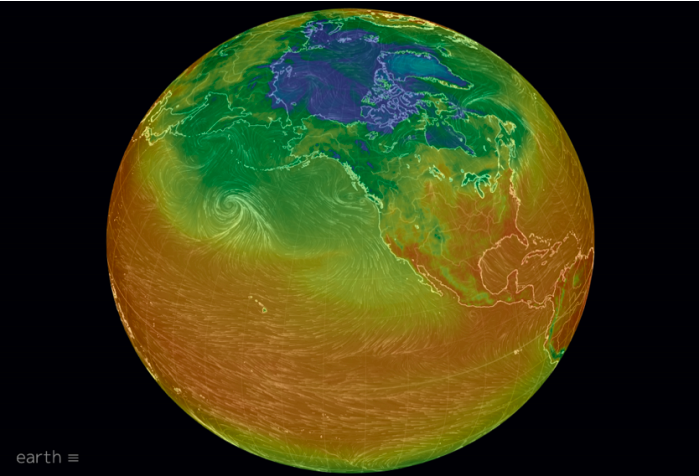
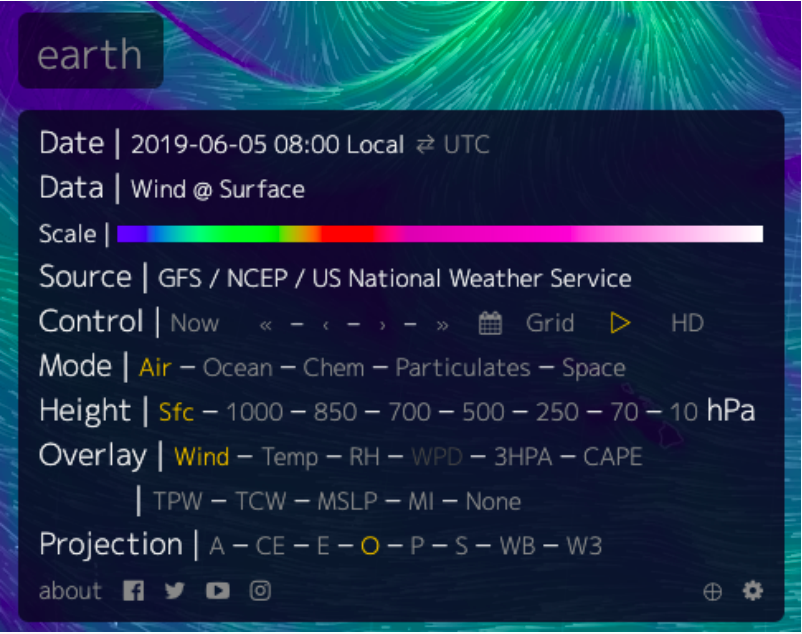
To investigate how atmospheric circulation causes the needed redistribution you will need to display surface air temperature on the globe. To do this click on the word “earth” in the lower-left, and then “Overlay” and “Temp” (see Figure 6.2.3). This will replace the windspeed overlay with current air temperature (Figure 6.2.4). Click the title “Earth’ again to hide the control menu.
With both wind direction and surface temperature being shown, Look for lines of fixed latitude (horizontal lines) where temperature changes. investigate these questions.
Questions
- Where do you find tongues of cooler air with neighboring warmer air to the left and right?
- What is the temperature difference between the center of one of these cool air tongues and the surrounding air at the same latitude? Click on the globe at each location to get a latitude and longitude and an air temperature for each.
- How does wind direction correspond with this tongue?
- Repeat questions 7-9 for a tongue of warmer air compared with cooler air to the left and right.
- How does your answer to the previous questions address the question of how heat energy is distributed from areas of energy excess to areas of deficit?
- Do you see the pattern more clearly over the ocean or over the land? What might cause differences between these patterns over ocean and land?
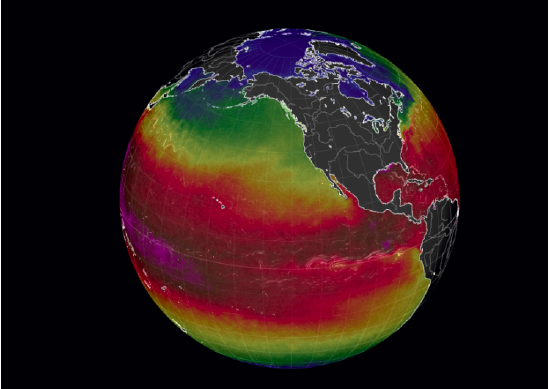
For the last part of this activity display the controller and select “Ocean” from the “Mode” menu, “Currents” from the “Animate” menu, and “SST” from the “Overlay menu (Figure 6.2.5). This will give you a display that looks something like Figure 6.2.6.
With both ocean currents and SST displayed answer the following three questions.
Questions
- Where do you find tongues of cooler water reaching out toward the equator? Where do you find tongues of warmer water moving towards poles?
- What is the temperature difference between a point in the center of these tongues and the surrounding water at the same latitude? Give the longitudes, latitudes, and temperatures of the points you used to answer this question.
- Based on your response to question 14 in this activity, what would you expect about the relationship between these tongues and the direction of current flow?
- Zoom in on one of these tongues until you can see the animated current lines. Was your response to question 15 accurate?
- What complicates giving a simple yes or no your answer in question 16?
Activity B – Atmospheric circulation: Patterns and drivers
For this activity you will need to set the display to show the flow of air near the earth’s surface and surface air pressure. To do this open the control menu and select “Air” from the “Mode” menu and “MSLP” from the “Overlay” menu. MSLP is short for Mean Sea Level Air Pressure. Air pressure is the force that air exerts on a surface. Here in the US MSLP is often measured in pounds per square inch, with average air pressure being around 14 \(lb/in^{2}\) . In the viewer it is measured in hectopascals (hPa) with average MSLP being around 1012 hPa. Like everything else about the earth there is a lot of variation from the average. The colors of the overlay range from almost black (600 hPa or lower) to white (more than 1030 hPa). Armed with this information what would you say in response to following questions.
Questions
- Find a low-pressure area near the equator. Look for a broad band rather than a spot. What is the lowest MSLP you find in this band?
- Is air flowing into or out of this area?
- Based on your answer to the previous question is air rising from or falling onto the center of the band? Note this area is referred to as the Inter Tropical Convergence Zone or ITZC.
- Now rotate the globe until you are looking at Antarctica. Find a high-pressure area near the south pole. What is the highest MSLP your find in this area?
- Is air flowing to or out of this area?
- Based on your answer to question 5 is air rising from or falling onto the center of this area?
- Surface air pressure is largely dependent on air temperature. Warm air tends to be associated with low MSLP since air expands and becomes less dense as it warms. Cold air on the other hand tends to be associated with high MSLP since air contracts and becomes denser as it cools. Based on this bit of basic physics what’s driving the air flow you observed in questions 2, 3, 5, and 6?
For the final segment of this activity look at a low-pressure spot in the Northern Hemisphere. Atmospheric scientists refer to this as a low-pressure center.
Questions
- What is the MSLP in the center of that spot?
- How is the air flowing relative to the center of the spot? In other words, is it flowing into or out of it? Is it moving clockwise or counterclockwise?
- Now look for a high-pressure area next to the low-pressure center. What is the MSLP in the center of that area?
- How is the air flowing relative to the center of this area? Make sure to talk about into or out of and clockwise and counterclockwise.
- Given that these two centers are in close proximity to each explain create an overall description of what is happening with airflow going from one center to the next.
- Next look for a similar spot in the southern hemisphere.
- What is the MSLP in the center of the spot and how is air flowing relative to that point?
- Look for an area of high-pressure nest to the low pressure center. What is MSLP in the center of that area and how is air flowing relative to that point?
- How is what you concluded in questions 13 and 14 similar to what you concluded in 8 through 12 and how is different?
- What do you think causes these differences?
Activity C – Ocean circulation: Patterns and drivers
For this activity you will need to set the globe to show ocean currents and current velocity. To do this open the control menu (click on “earth”), select “Ocean” from the “Mode” menu, and “Currents” from both the “Animate” menu. This last selection will set automatically set the overlay to currents, so you get colors ranging from dark blue (low velocity) to red (high velocity). A point of information – Surface currents are the bulk movement of water near the surface of the ocean. Water flows differently at different depths. A topic for other activities.
Questions
- What are the highest and lowest velocities you found on the globe? Where were they?
- Turning your attention toward the equator, how does the current velocity there compare to the oceans north and south of it? You will probably need to zoom in on part of the equator to answer this.
- In general, which way are the currents flowing in the area you zoomed in on?
- Without changing the place on the equator, you are looking at open the control menu and select “Air” from the “Mode” menu. How does the air flow around the equator correspond with the current direction you observed in question 3? How might this explain what drives surface currents?
Next reset the display for currents and current velocities and turn your attention to Antarctica. Make sure to zoom out to where you can see the entire globe.
Questions
- Find the high velocity stream surrounding the continent. Generally, in which direction is it flowing? Again, you will need to zoom in to see the current lines.
- Zoom out again until you can see the entire globe with the south pole in the center of the view. How does the general air flow around Antarctica correspond to what you observed in the previous question?
- Is this consistent with what you concluded in question 4? What complicates your answer?
For the final part of the activity reset the display to show ocean current direction and velocity and turn the globe so you can see the North Atlantic.
Questions
- What happens to the high velocity current on or near the equator as it approaches South America? Concentrate on the northern section of that stream.
- How does the velocity and direction of that current as it flows along the eastern coast of North America compare to the surround ocean? Use numbers in your answer. The current as it passes along east coast of the US and Canada is called the Gulf Stream.
- Now set the display to show currents and SST (sea surface temperature). How does the temperature of the Gulf Stream compare to the surrounding ocean?
The Gulf stream is part of a basin wide circulation of water that moves warm water northward on one side of the Atlantic and cool water southward on the other side. Note this is the general trend, as you probably notice the details are a bit more complicated than this. An important aspect of oceanic circulation is that the oceans regularly exchange mass and energy with the atmosphere above them, so sea surface temperature has a strong influence on the temperature of the air above warm and cold currents.
Questions
- Given all this how might the currents off the coast of North America, Europe, and Africa influence the climate of the communities along those coastlines?
- Is your answer to the previous question consistent with what you know about the climate of those areas? If not, what are some additional factors, we might need to look at to explain those climates?