
1.2: Investigation
- Page ID
- 28577

Activity A – Weather
To begin this activity, access a virtual reality recording of fifteen seconds of the weather at a station in Northeast Portland, Oregon (refer to the on-line tool address on page 1)
What appears when you do this is a panoramic video showing the backyard of a house in Northeast Portland with a home weather station (Figure 1.2.1). The green dot on the roof of the house marks the location of the station. As You can look up, down, and around this panoramic video. You can also zoom in and out of the scene and switch the date from May 17 to 31 to compare the weather on these two days (see Figure 1.2.2 for instructions on how to do this).
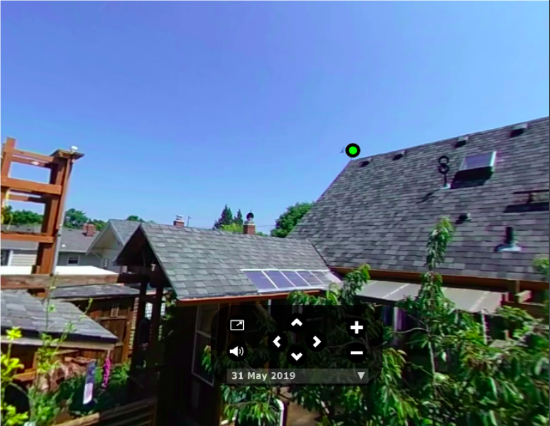
The controls in the center bottom allow you to look in all directions, zoom in and out, and change the date of the scene.
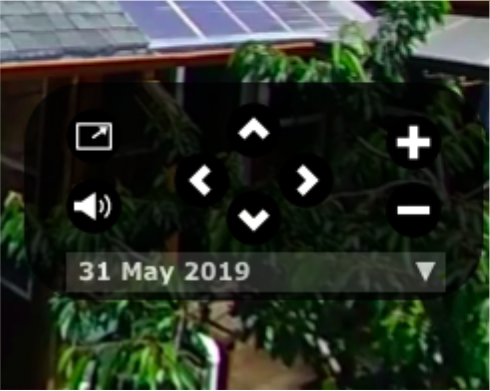
The four arrows in the center controls where in the scene you are looking. The plus and minus symbols allow you to look more closely at something in the scene. The pull-down menu with the date allows you to switch the date to see the weather on either the 17th or 31st of May.
Qualitative observations:
Begin by watching the video for 17 May. In your own words describe what you see by listing the specific characteristics (weather elements) you are able to see in the video and then what in the scene you could use to “measure” these elements.
Next switch to the scene for 31 May. Using the same list, you compiled for 17 May, describe how the two days compare to one another.
Quantitative observations:
Return to 17 May and turn around until you can see the green dot marking the station location. Click on the green dot. When you do this an image that looks like figure 3 will show up on the left side of the scene. The photo part of this image contains weather data gathered by the station at 17:00 (5 pm) for that day. Record this data for 17 May and then switch to 31 May and record the weather data for that day as well. Using these data answer the following questions.
Weather elements - Questions
- What are the weather elements measured by the station?
- How does the weather on 17 May 2019 compare to that of 31 May 2019?
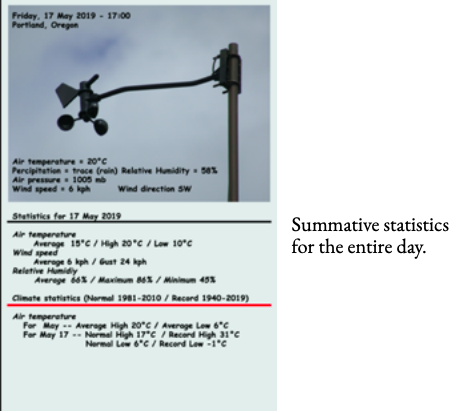
The photo to the right shows the wind gauge for the station as well as the data gathered at 17:00 (5 pm)
Climate statistics show what is normal and abnormal for the month of May and for this specific day.
Part B – Daily weather
Beginning with the data window for 17 May 2019 answer the following questions
Comparing weather to daily statistics - Questions
- How does the air temperature recorded at 17:00 compare to the average, high, and low temperatures for that same day? Use the portion of the data window having the title “Statistics for 17 May 2019.
- How does the recorded wind speed compare?
- How does the relative humidity compare?
For questions 4 through 6, switch to May 31 and repeat questions 1 through 3. In other words, question 4 is question 1 for May 31 and so on.
Part C – Climate statistics
Return to May 17 and access the data window for this station. Using these data answer the following questions.
Comparing weather to long term statistics - Questions
- How do the high and low temperatures for 17 May 2019 compare to the average high and low temperatures for the entire Month of May?
- How do the high and low temperatures for 17 May 2019 compare to the normal high and low temperatures for 17 May averaged over a 30–year period (1981 to 2010)?
- How do the high and low temperatures for 17 May 2019 compare with record high and low temperatures for 17 May recorded over an 80–year period (1940-2019)?
- Next switch to 31 May 2019 to answer these questions…
- How do the high and low temperatures for 31 May 2019 compare to the average high and low temperatures for the entire Month of May?
- How do the high and low temperatures for 31 May 2019 compare with the normal high and low temperatures for 31 May averaged over a 30-year period (1981 to 2010)?
- How do the high and low temperatures for 31 May 2019 compare with record high and low temperatures for 31 May recorded over an 80-year period (1940-2019)?
Part D – Synthesis
Synthesis Questions
- Which of the two days you looked at (17 May 2019 and 31 May 2019) was the closest to normal air temperature based on normal for these days averaged over 30 years?
- Based on what you learned in activities A through C why is a belief about climate change based on the weather from a few days or weeks a questionable strategy?
- How would you explain this to a friend? Think about using an analogy or telling a story. Communicating climate science to folks who aren’t familiar with it often requires translation.