
7.2: Investigation
- Page ID
- 28696

Activity A – Monsoonal flow
A monsoon is a seasonal cycle of intense precipitation followed by an extended period of dry, hot weather. Southeast Asia is one of the places on the planet where this cycle is the most dramatic. Countries in this area, India being a prime example, receive nearly 90% of their annual rainfall between mid-June and late September. In contrast winter and spring is often characterized by clear, sometimes cold weather. The aim of this activity is understanding how this cycle is possible and what it has to do with atmosphere / ocean interactions.
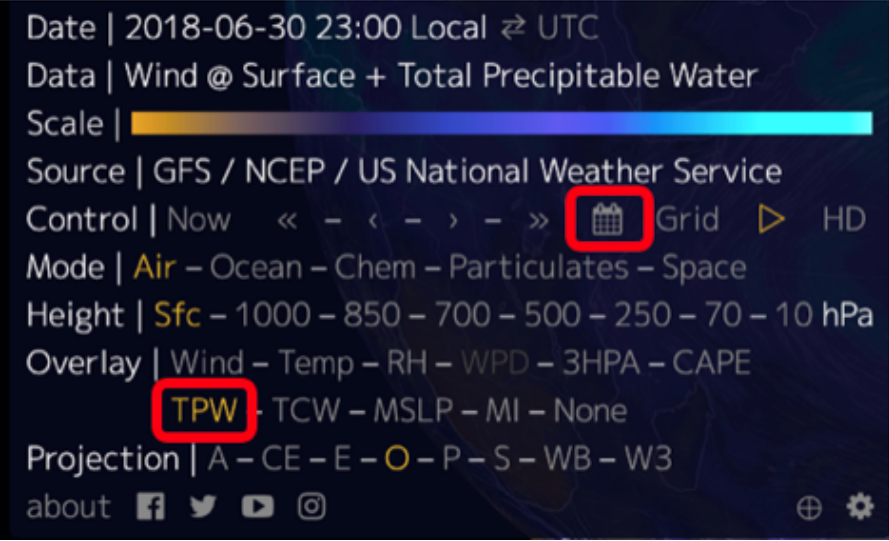
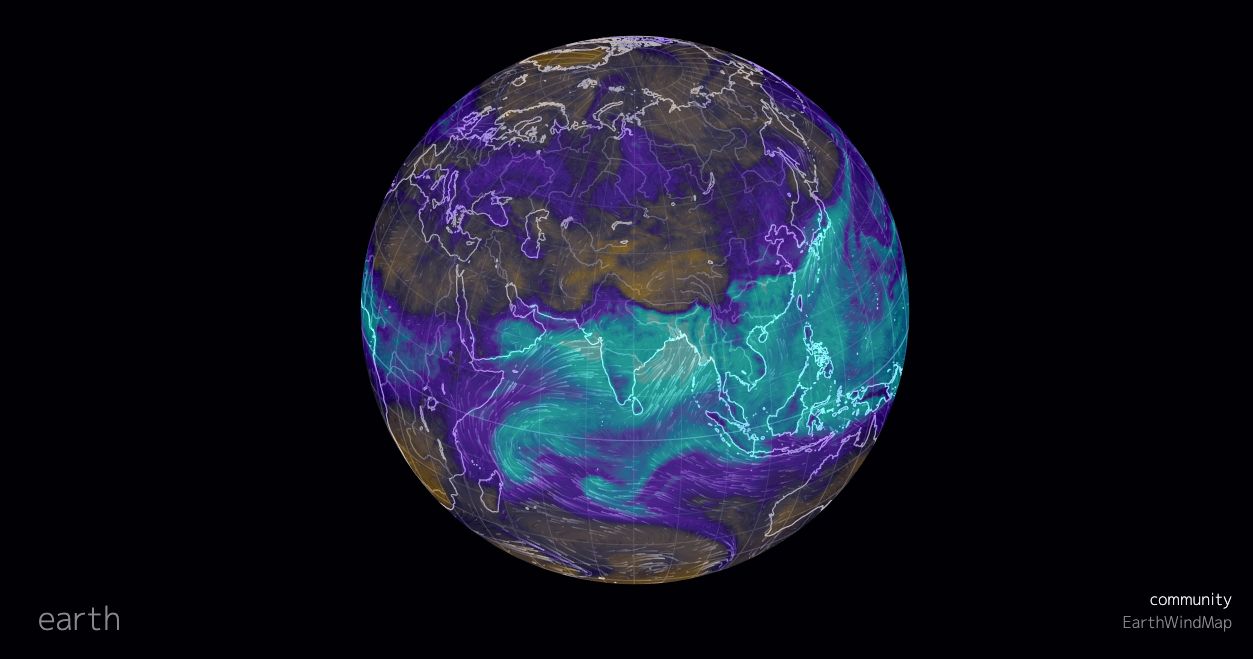
Launch Earth by typing in the address <https://earth.nullschool.net/> into your browser. Once you have done so turn the globe until you see India and southeast Asia. Then click on the “earth” label in the lower left corner of the screen. This will open up a panel that controls the kind of information displayed on the globe. From the controller select TPW (Total Precipitable Water) from the “Overlay” menu and then click on the calendar symbol from the “Control” menu (see Figure 7.2.1). From the calendar select July 1, 2018 – Make sure to click on “Apply” at the bottom of the calendar to show TPW and wind direction for this date.
Questions to investigate
- What is the windspeed, wind direction, and precipitation over the center and over the southern tip of India?
- What is the windspeed, wind direction, and precipitation over these same two places on December 31, 2018? To find this out you will need to reopen the calendar and set it for this date. Remember to click on “Apply” to show wind and TPW for this time.
- How does the wind and precipitation over of these two places change from July to December?
- The following paragraph describes a commonplace event that can help you understand how monsoons work. Using the information from this paragraph, draw a diagram showing the relative temperature of land and water, the direction of the wind, and determine whether this would correspond to the rainy or dry season of a monsoon.
Land-sea breeze
If you have every spent any time at a coast, you have probably experienced a land-sea breeze. You may also have noticed that the breeze changes direction with time of day. This is because during the day the land becomes warmer than the ocean. As a consequence, the air over land warms, becomes less dense, and rises. This then, pulls in air from the ocean. At night, the land cools more than the surrounding ocean, with air over the land sinking and flowing out into the ocean, where air is rising. In many respects, this is similar to air rising over India during the summer.
Activity B – Tropical cyclone and hurricanes
Tropical cyclones are storms that originate in tropical oceans above but not at the equator. Hurricanes are a subset of these storms characterized by intense precipitation, winds, and markedly low pressures at their center. Satellite imagery and data from weather aircraft has given us remarkably detailed and comprehensive insight into the structure and dynamics of these phenomena. Chief among these insights is that the intensity and frequency of these storms is dependent the incredible heat stored in tropical ocean water. This has raised concerns among climate researchers that as the earth’s climate system warms so do the tropical oceans, meaning that even more energy becomes available for creating larger and more frequent storms. While this idea may seem straightforward, the complications of atmosphere / ocean exchanges makes for a picture that is not quite so clear. Never-the-less the appearance of several major hurricanes in the Northern Hemisphere during the past decade tends to support the link between a warming of the earth and an increase in hurricane strength and/or frequency.
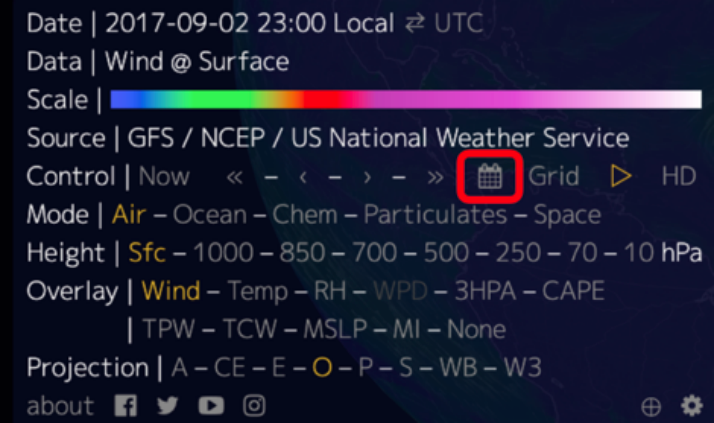
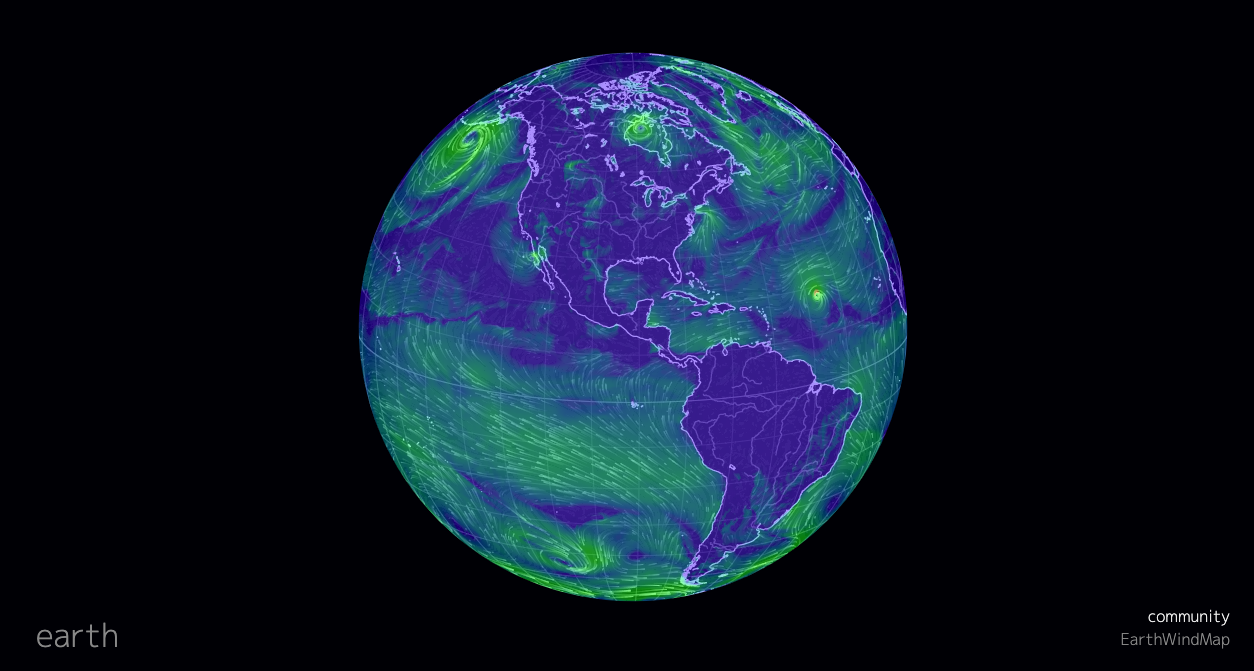
In this part of the activity you will be looking at several weeks of hurricane activity that took place in September 2017. To start this activity, turn the globe until you are looking down on the Gulf of Mexico and the tropical Atlantic Ocean. Next open the display controller and access the calendar. From the calendar select September 3, 2017. When you click “Apply” you should get a display that looks like Figure 7.2.4.
You will begin with the hurricane located at in middle of the Atlantic Ocean to investigate the general structure and dynamics of Hurricanes.
Questions to investigate
- What is the direction of air flow relative to the center of the storm?
- How does wind speed and direction change as you move from the center of the storm outwards? To address this question, begin at the center of the storm and select five points going from the center to a point 5° from the center of the storm. Click on each of those four points (they should be in a line) recording the latitude, longitude, wind speed, and wind direction at each point.
- How does air pressure change as you move from the center of the storm outwards? To address this question, open the display controller and select “MSLP” from the “Overlay” menu. Click on the same points you used for the previous questions and record the latitude, longitude, and air pressure at each place.
To continue, open the display controllers and look for the double arrow next to calendar symbol. Clicking on this will advance the display 1 day. Using this control look for the following.
Questions to investigate
- When and where the hurricane first makes landfall?
- When and where the hurricane makes landfall in North America?
- What happens as the hurricane moves further inland in North America
- Given that hurricanes derive their energy from atmosphere / ocean exchanges how do you explain what happened in question 6?
An additional useful on-line resource
Historical Hurricane Tracks from NOAA <https://coast.noaa.gov/hurricanes/>
Activity C – Interdecadal and interannual variations
Interdecadal and interannual variations are large scale fluctuations in oceanic and atmospheric conditions that produce multi-year cycles of regional climate change. One of the best know examples, ENSO or El Niño / Southern Oscillation, involve alternating cooling and warming at opposing sides of the equatorial Pacific Ocean resulting from changes in air pressure and surface winds in the overlying atmosphere. Because these changes take place over such a large area what happens in the equatorial Pacific affects seasonal temperature and precipitation throughout much of the Western Hemisphere. For instance, during a warm phase of an ENSO (El Niño) January-March temperatures in northwestern North America tend to be warmer than average, while during cool phase ENSO (la Niña) January-March temperatures in this same area tend to be colder than average.
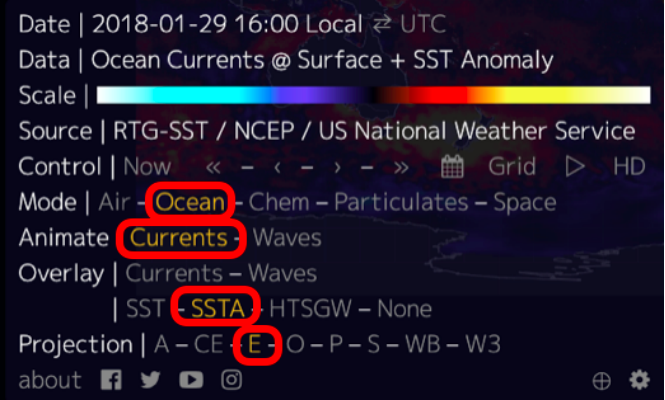
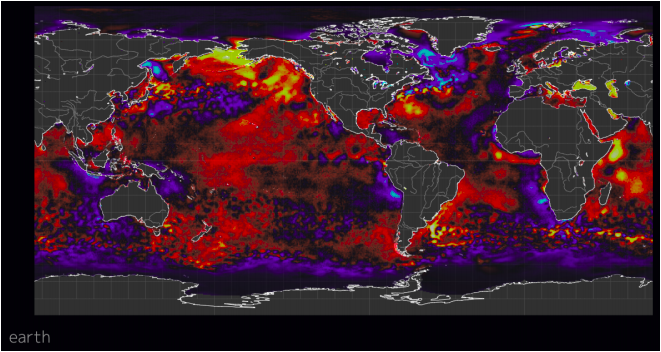
In this part of the activity you will be looking at conditions in and above the equatorial Pacific Ocean during an El Niño and a la Niña year to understand how an ENSO works. To get started with this open the display control panel and select “Ocean” from the “Mode” menu, “Currents” from the “Animate” menu, and “SSTA” from the “Overlay” menu. Also select “E” from the “Projection” menu (Figure 7.2.5). The last selection will switch the view from a globe to a flat map, which will make it possible to see the entire Pacific Ocean. Selecting “SSTA” means that you are displaying sea surface temperature anomaly, meaning that you are looking at the deviation of sea surface temperature from a long-term average (Figure 7.2.6).
Questions
- Once you have set up the map, reopen the display control panel and click on the calendar symbol. Using the calendar set the date to the 30th of January 2018 – 2018 was an La Nina year. Using this map answer the following questions.
- What country is nearest to 10°S / 83°W? Is the sea surface warmer or colder than average? By how much?
- What country is nearest to 1°N / 141°E? Is the sea surface warmer or colder than average? By how much?
Now select the 30th of January 2016 – 2016 was a El Nino year.
Questions
- What is the SSTA at 10°S / 83°W and 1°N / 141°W?
- How does the SSTA at each place compare to the SSTA on the 30th of January in 2018?
Next open the display controller and select “Air” from the “Mode” menu. The display will show wind speed and direction?
Questions
- What is the wind speed and direction at 10°S / 83°W, 0° / 150°W, and 1°N / 140°E?
- What is the wind speed and direction at these same points on the 30th of January 2016?
- Based on what you just looked at how would you describe the changes in ocean and atmospheric conditions that occur when you switch from an el Nino to a la Nina?