
12.2: Investigation
- Page ID
- 28598

Activity A: Becoming familiar with Earth Viewer and the Geologic Time Scale
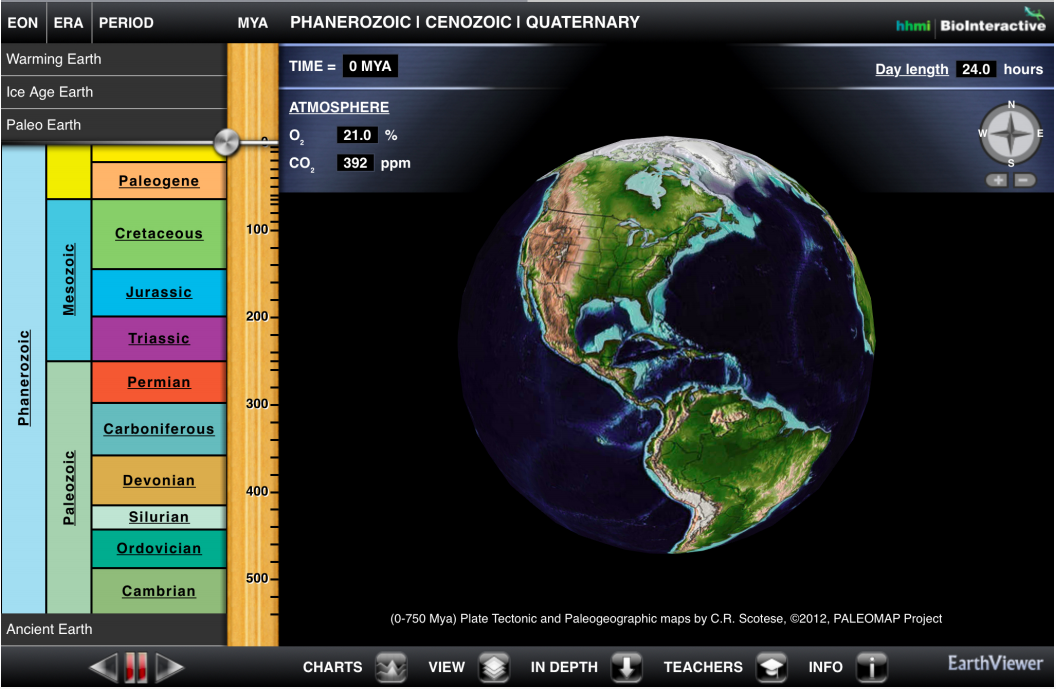
Begin by launching Earth Viewer <https://media.hhmi.org/biointeractive/earthviewer_web/earthviewer.html>. On the right side of the frame you see a globe that you can rotate. On the left side is a graphic timeline that you use for seeing the earth at different times in its history. There are actually four timelines available in this Atlas. One of these, “Paleo Earth”, is visible when you first launch the viewer and encompasses the last 550 million years of earth history. “Ancient Earth” shows all of earth history. “Ice Age Earth” goes from 21,000 years ago to 8,000 years into the future – The last 8000 years of this timeline (future) being based on climate modeling. The final timeline, “Warming Earth”, displays changes in average annual temperature from 1912 to 2012.
Using both the “Paleo Earth” and “Ice Age Earth timelines answer the following questions…
Questions
- What is the Phanerozoic? To do this find this term in the timeline and click on it. When you answer the question identify how long it lasted, when it started and when it ended, what happened in terms of life, and what the name means.
- What are the three major divisions of the Phanerozoic? List and describe each of these.
- What is the Pleistocene?
- What is the Quaternary?
- What is the Anthropocene?
Activity B – Tracking Geographic and Climatic Change
Reset the viewer timeline to “Paleo Earth”. Using your finger or cursor (depending on whether you are using a tablet or a computer) click and drag on the timeline slider. This should move you back and forth through time, in which case you will see the geography of the planet change.
Using the slider on this and the other timelines answer the following questions…
Questions
- How did the geography of the earth change during the past 550 million years?
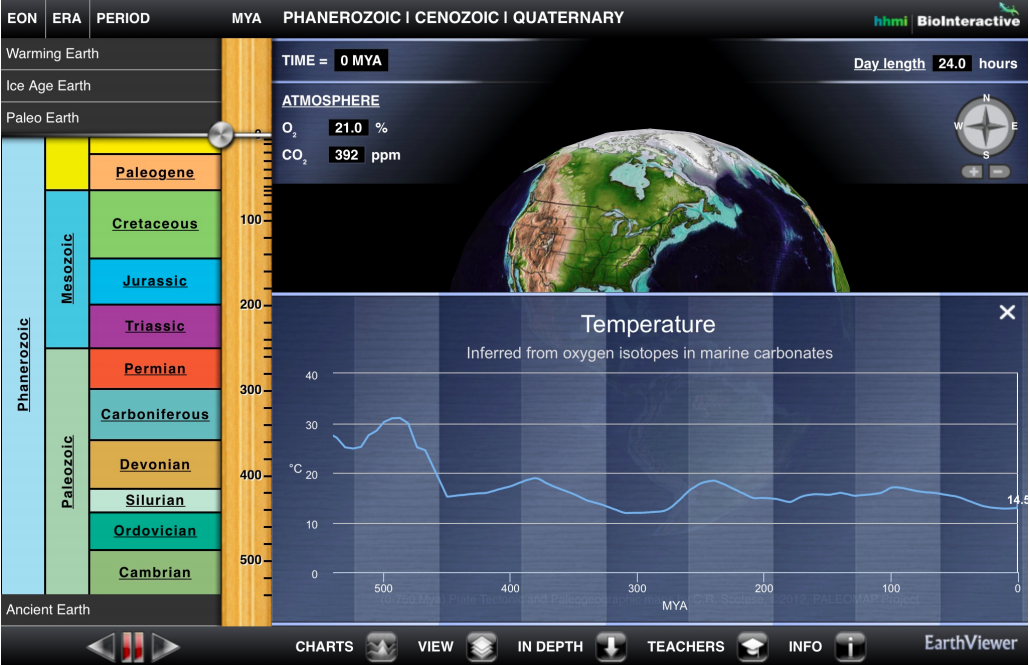
- What is the current mean surface air temperature of the earth? To find this turn on the temperature chart. The icon for this is on the bottom of the frame in the web version, and the top right corner of the tablet version.
- When were the high and low temperatures during the Phanerozoic? To answer this give the time and magnitude of the peaks and valleys in the chart.
- Where do you see the most abrupt change in temperature? Hint you may have to resort to the “Ice Age Earth” to find this.
- Compare these temperature highs and lows to the oxygen, carbon dioxide, day length, and solar luminosity graphs. Which of these seems to show the closest relationship to temperature? Note – The mobile app version allows you to display two graphs simultaneously, the web version does not, so you have to go to the icon at the bottom of the frame to change the parameter being shown.
Activity C: Synthesis
Questions
- Earth Viewer has four time–controllers (timescales). How are these related to each other?
- The geologic record is the evidence for past events found in fossils, rocks, soils, seafloor sediment, ice, and landscapes. Based on the relationship between the four timescales you noted in question 1, what can you say about the detail of the geologic record for recent events vs. the record for ancient events?
- Why is the detail different for recent events?
- Based on your results for Activity B, how is the climate change taking place during the past 200 years different from other periods of warming or cooling during the past 550 million years.