
16.2: Investigation
- Page ID
- 28626

Activity A – Sea Level rise impact on a Coastal City
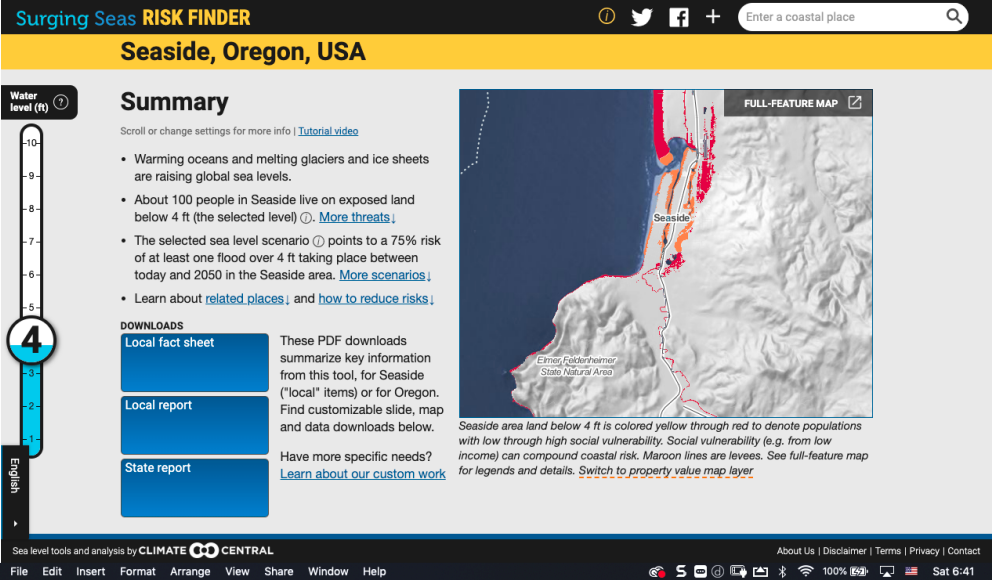
Launch the Risk Finder from your web browser <https://riskfinder.climatecentral.org/>. Once it appears, type Seaside Oregon into the search bar in the search bar in the center of the screen. What you will see should look like Figure 16.2.1.
Seaside and sea level rise - Questions
- How would you describe the landscape of Seaside? Pay particular attention to elevation, the presence and size of areas that are flat or mountainous, where beaches, streams, and bays are.
- Find the water level indicator on the left side of the frame. Set it for 3 ft. What does this mean? To help with this question click on the question mark in the label at the top of the scale.
- Thinking of water level as projected sea level rise, which areas are affected by this rise? What physical factors determine which areas are affected?
- For a sea level rise of 3 ft how many people now live in areas that would be chronically flooded by that rise?
- For a 3 ft rise what is the probability of at least one flood exceeding this value taking place during the next 30 years (2020 to 2050)?
- Answer questions 4 and 5 for water levels of 5 and 10 feet.
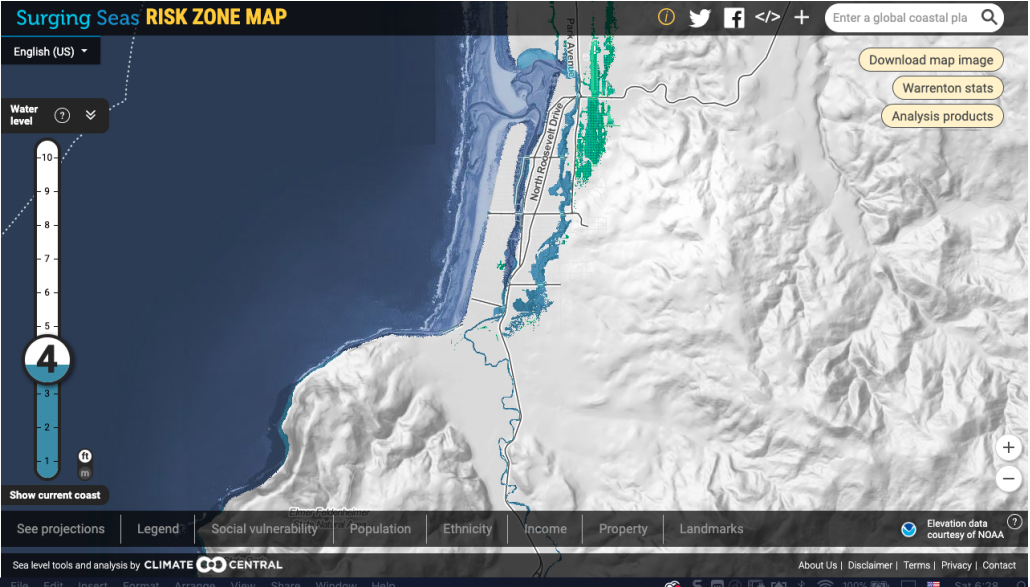
Click on the label “Full-Feature Map” in the upper right corner of the map near the top of the page. Doing this should open a map in a new tab in your browser that looks like Figure 16.2.2. Once you have accessed this map, set the water level indicator to 3 ft and then click on “Legend” in the display bar at the bottom of the map.
Questions
- Where are the areas that are below water level and where are the areas that are below water level but isolated? Which of these areas are not affected by rising and falling tides?
- What happens to these areas at 5 and 10 ft rises?
Reset the water level indicator to 4 and select “Social vulnerability” from the display indicator.
Questions
- Where do you find the highest and the lowest vulnerability in Seaside?
- What do you think determines vulnerability? Hint – look at the other options in the display bar.
Activity B – Comparison of two coastal cities
Return to summary page for Seaside and type “Miami, Florida, USA” into the search bar. When the page appears set the water level indicator should default to 3 ft, if it does not set it to that level.
Comparing Seaside, OR to Miami, Fl
- What is the landscape of Miami like? How does this compare to that of Seaside?
- What areas in Miami would be affected by a 3 ft rise in sea level?
- What areas would be affected by 5 and 10 ft rises in sea level?
- How does the proportion of Miami impacted by a 5 and 10 ft rise in sea level compare to the proportion of Seaside that would be impacted by same rises?
- For a 3 ft rise in sea level what is the probability of a flood over 3 ft taking place during the next 30 years? How does this compare to the same probability for Seaside?
- What makes for the differences you observed between Seaside and Miami?
For this next part select the full-feature map for Miami and reset the water level indicator to 3 ft.
Questions
- Select legend from the display options bar. Where are the areas that are below water level vs. the areas that are below water level but isolated?
- What do you estimate the ratio of below water level to below isolated areas to be? How does this compare to the same ratio for Seaside?
- What happens to these areas with 5 and 10 ft rises?
- Reset the water level indicator to 3 ft and select social vulnerability. Where are the most vulnerable and the least vulnerable populations?
- How does population density, income, ethnicity, and property values determine social vulnerability?
- How do these factors for Miami compare to that of Seaside?
- Which of the two cities would seem to be the most impacted by sea level rises of 5 and 10 ft and why?
Activity C – Sea level rise impact on an inland city
For this part of the activity, select Portland, Oregon. Portland is an inland city which would seem to be immune to the rising sea level. The goal of this activity is to see if this assumption is accurate. Once you have arrived at the summary page for Portland set the water level indicator to 3 ft.
Portland and sea level rise - Questions
- What is the landscape of Portland like?
- Referring to the map on the right where are the areas likely affected by a 3 ft rise in sea level?
- What additional areas would be impacted with 5 and 10 ft rise in sea level?
- Given a 3 ft rise in sea level what is the probability of at least one flood over 3 ft taking place in the next 30 years?
- For the next questions select the full-feature map and set the water level indicator for 3 ft.
- Which areas are below water level vs. which are below water level but isolated?
- What happens to these areas with a 5 and 10 ft sea level rise?
Activity D – Synthesis
Questions
- Rank Seaside, Miami, and Portland in terms of their vulnerability to rising sea level.
- What are the physical and social factors you used to make your ranking?
- Which of these factors were most significant for each of the cities?
- For each of the three cities propose at least two specific strategies that they could develop that would help them adapt to 9 ft rise in sea level deemed probable under the Business as Usual scenario outlined by the IPCC in one of their recent climate assessments.