1.8: Economics
- Page ID
- 14346
by Laurie Houston1 and Susan Capalbo2
1Senior Faculty Research Assistant, Applied Economics, Oregon State University.
2Professor, Applied Economics and Senior Vice Provost, Faculty Affairs, Oregon State University.
Economics and the climate change challenge: Understanding incentives and policies
As the earth warms, the impacts are expected to affect both ecosystems and humans. Thus, understanding the impacts of climate change requires a combined understanding of how ecosystems respond to the buildup of greenhouse gases and how humans are impacted and thus respond to the changes in these ecosystems. This chapter provides an economic perspective on the climate change challenge and an introduction to the role that market-based incentives and policy can play in helping us mitigate and adapt to the impacts of climate change.
To better understand the economic levers that can be used to address our climate change problem, we can think of this challenge as similar to other decisions and outcomes that we encounter in our every-day lives and how incentives are used to alter behavior. For example, our society has reduced the incidents of lung cancer by implementing a variety of policies aimed at changing consumer behavior such as employing education campaigns that communicate the link between smoking and lung cancer, imposing taxes on cigarettes and tobacco products, banning smoking in most public places, and prohibiting the purchase by minors. While none of these are perfect deterrents for everyone, the collective outcome has been to greatly reduce the adverse impacts of smoking behaviors.
These same principles can be applied to climate change, water pollution, and other environmental challenges. In all of these applications, the environment (atmosphere, water) is viewed as an asset that provides a variety of services that support life and sustain our existence. As with all long term assets, we seek to use them sustainably. And, as with all assets, there is a value associated with their services. The value will decline as the asset is rendered less productive. Polluting these environmental assets will also decrease the level of services they can provide now and in the future. CO2 is a form of pollution into the “atmosphere asset,” where high levels of CO2 emissions causes serious and irreversible adverse impacts. The challenges of reducing CO2 emissions is magnified since these emissions accumulate in the atmosphere over time and also disperse throughout the global atmosphere. If society wants to slow down the rate or amount of CO2 emissions, it needs to provide incentives that discourage such emitting behavior. Economic “tools” can be used to redirect behavior toward less CO2 generating activities, to evaluate the most cost effective policy options and incentives to sustain this behavior, and to assess the long term costs of continued delays in collective actions to reduce greenhouse gas emissions. In this chapter we focus our economic lens on policy options to address the adverse impacts of emitting too many greenhouse gases into the atmosphere. These options include designing government-mandated or voluntary-style programs and regulations.
In order to influence behaviors and thus outcomes, one must first understand the nature of the interactions between a substantially more variable climate, and the potential damages and irreversibilites. We must also have an understanding of why the problem is occurring. Once the what and why of the problem are defined, there are a variety of policies that can be used to influence production and consumption behaviors in order to reduce or mitigate the impacts of climate change.
Whatis the problem? As noted in earlier chapters, human induced emissions of CO2 and other greenhouse gases is markedly adding to the naturally occurring greenhouse gases in the atmosphere. These activities include such things as the burning of fossil fuels, manufacturing, and agricultural production. The accelerated accumulation of these greenhouse gases is causing our climate to change at rates that are unprecedented. These changes are resulting in damages to the environment and creating adverse health impacts which collectively are imposing costs on society. Damages from climate change for the USA were estimated for certain sectors of the economy in a recent study to be about 1.2% of gross domestic product per 1°C increase in global temperatures, with larger damages in southern states (see also this news article). In an effort to inform decision makers about significant potential damages in the U.S. and allow the government to set priorities and manage risks, the U.S. Government Accountability Office has recently released a report on potential economic effects of climate change. These damages/costs we will refer to as the social cost of carbon.
Whyis this problem occurring? These costs to society occur because there are adverse impacts associated with human activities that are not readily apparent and often indirectly associated with the activity. In the case of energy production from fossil fuels, adverse impacts are caused by the generation of CO2. When a producer ignores the unintended side impacts of this type of energy generation, there is an implicit cost imposed upon others. Without information on the full (private plus social) cost of carbon, as reflected in the extent of the adverse impacts, and without policies that address these costs, it is too convenient to simply ignore the impacts on our ecosystems. This Ted Talk by Pavan Sukhdev “Put a value on nature!” provides an excellent and quick overview of the problem.
Let’s use electricity production from coal power plants as an example of this type of “cost to society”. According to the Energy Information Administration, coal power plants in the United States emitted nearly two million metric tons of carbon dioxide in 2016. These CO2 emissions, which contribute to global warming, are the source of the negative externality associated with electricity generation from fossil fuels.
Assume you are an electricity producer and you produce electricity by burning coal. Below is a graph of the supply and demand curves for electricity (Figure 1). The downward sloping curve can be viewed as the demand (willingness to pay) for electricity; the downward sloping demand curve can also be viewed as a marginal benefit curve because each point on the curve represents the benefit of an additional unit of electricity. The upward sloping curve represents the supply of electricity which also reflects the marginal private cost of producing each unit of electricity from this coal power plant. As the owner of a firm that is producing electricity, you would produce electricity at the quantity where the marginal benefit of electricity production, as reflected in the price consumers are willing to pay, equals your marginal private cost of producing that amount of electricity. This is the point A on the graph. At this point, the quantity of electricity produced is Qp, which is the privately optimal amount of electricity. Note that at any quantity greater than Qp the marginal benefits of that level of electricity are less than the marginal private costs of producing that level of electricity.
Now let’s look at it from Society’s point of view. We need electricity; it is what heats and lights our homes and powers our appliances and electronic devices. However, with each unit of electricity produced from fossil fuels there is also a certain amount of carbon dioxide emitted which is imposing unwanted costs in the form of negative impacts from climate change. This means that the social cost of producing each unit of electricity generated from fossil fuels is actually higher than the private cost of production which basically ignores these adverse impacts associated with higher levels of carbon dioxide in the atmosphere. Thus, the true social cost of producing electricity from fossil fuels is more like the red curve on this graph, which reflects a higher cost of production for each level of electricity. Economists indicate this by calculating the cost as the sum of the private costs to generate and deliver the electricity to your home PLUS the social cost of carbon.
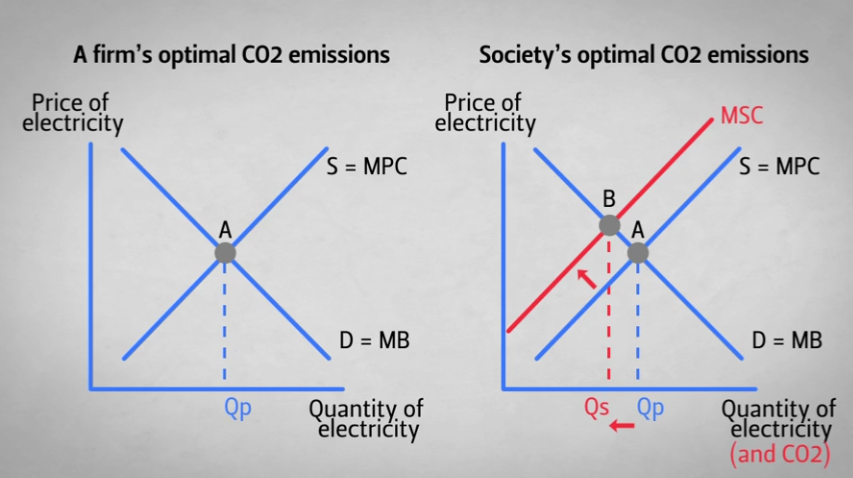
Figure 1. Optimal CO2 emissions graphic example. See also Climate Change Awareness Module 3: The Role of Economics. Forward to the “Why is this problem occurring” section of the module.
Thus, in the case for electricity generated from fossil fuels (coal, natural gas), the socially optimal amount of electricity production would be Qs, which is less than the privately optimal amount Qp. In the absence of awareness of these external costs and impacts, we will continue to overproduce and overconsume electricity generated from fossil fuels. Economists refer to this as a market failure, because the (private) production and consumption of electricity exceeds the level that would be produced and consumed if the costs of CO2 emissions were accounted for and incorporated into the total costs of production.
How can we correct this problem?
There are many options for reducing the adverse impacts to society from CO2 and other greenhouse gas emissions, such as, switching to sources of electricity that do not contribute to the CO2 problem, trying to generate fossil-based electricity by not releasing the CO2 into the atmosphere, or exploring ways to reduce the demand for products that produce greenhouse gas emissions. All of these options require that the signals to producers and consumers regarding the adverse impacts are made directly, through regulations and higher prices, or indirectly through research and development on cleaner technologies. Having the ability and information to assess the benefits and the costs of the corrective actions allows decision makers to assess risks and prioritize options.
Let’s see how this works using the example of the firm who is emitting CO2 in the process of generating electricity and unaware of his adverse impacts of their actions on the accumulation of greenhouse gases. We can correct this market failure by explicitly recognizing both the private production costs and the costs to society. Economists refer to these social costs as externality costs. Since the externality costs do not show up on the electricity generating firm’s expense spreadsheets they generally get ignored in the decision-making process. However, there are numerous ways to correct this cost omission. Here we present three common policies that can be used to internalize the costs of the CO2 emissions: command and control regulations, pricing carbon through a carbon tax or a cap and trade system, and subsidies.
Command and control regulations specify how a producer must manage his/her production process that is also resulting in generation of the CO2 pollution, establishes a monitoring procedure(s), and enforces a set of standards aimed at either the production process itself or the quantity of electricity. Let’s look at our graph again (Figure 2). Here we have an illustration of the quantity of electricity that is being produced (Qp) and the socially optimal amount when carbon emissions are considered (Qs). How can we achieve the reduction from Qp to Qs?
One way would be to impose an emission standard which dictates that the quantity of electricity produced shall not to exceed Qs. If a producer generates more than this amount, a fine is imposed. When the fine is set high enough the producer will choose to reduce production rather than incur the fine, thus achieving the socially optimal quantity of electricity (Qs). Note that the emission standard is indirectly reflected in the graph below since emissions are tied to electricity production. This also assumes that we have good information and can determine the exact damages from CO2 emissions, and we can accurately measure CO2 emissions associated with the production of electricity. It is a tall order, but with current technologies and monitoring process it is not impossible.
Determining the precise emissions standard, however, is difficult. If the emission standard is too restrictive and results in production levels to the left of Qs, the policy is overly costly. On the other hand, if the emission standard is too lax, the target for emissions reductions that are necessary will not be met.
In the United States, command and control policies are often used by the Environmental Protection Agency to ensure clean air and water. For example, under the Clean Water Act, there are many waterways that have Total Maximum Daily Loads standards that set a limit on the amount of pollutants that can occur in water ways. Likewise, the Clean Air Act created National Ambient Air Quality Standards (NAAQS) for many pollutants that are harmful to both public health and the environment such as Sulfur Dioxide, lead, nitrogen dioxide and even particulate matter, which can cause breathing problems. These command and control policies have been highly successful in improving the water and air quality in the United States. However, some argue that there are other more efficient ways to obtain the same outcome, and that command-and-control regulations do not provide incentives to improve beyond the standard set (Tietenberg 1985, Stewart 1996).
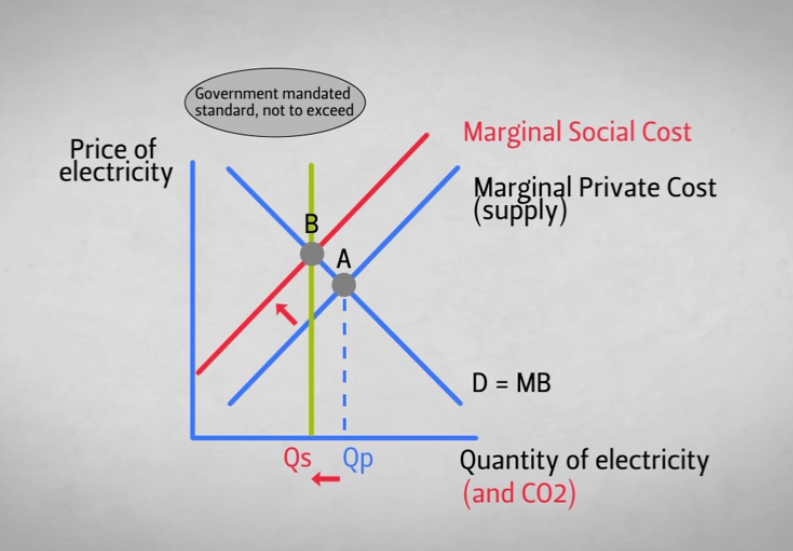
Figure 2. Command and control graphic example. See also Climate Change Awareness Module 3: The Role of Economics. Forward to the “How can we correct this problem” section of the module and click on the Command-and-Control regulation button for a more detailed explanation of command-and-control regulations.
Putting a price on carbon is the method many economists favor for reducing or controlling greenhouse gas emissions. Pricing carbon provides producers and consumers with a monetary incentive to reduce greenhouse gas emissions by placing a value on each unit of carbon dioxide or carbon dioxide equivalent that is emitted into the atmosphere. The carbon price can be viewed as the amount that must be paid for the right or permission to emit one unit of carbon dioxide into the atmosphere. This is a direct way to incorporate the costs to society of greenhouse gas emissions into the decision-making process of producers and consumers. Carbon pricing is usually either in the form of a tax or a combination of a cap on emissions with the ability to trade carbon dioxide emission allowances, referred to as a cap-and-trade system.
A carbon tax is an incentive that encourages companies and households to invest in cleaner technologies and adopt greener practices, by increasing the price of an item that contributes to the buildup of greenhouse gases into the atmosphere. If the tax on the greenhouse gas emissions is set high enough, the increased price for the product that is produced using a technology that generates greenhouse gases as a by-product of electricity, provides an incentive for producers to reduce emissions, by either reducing production, or investing in technologies that produce less carbon or that capture the carbon. Often a proportion of this increased cost is passed to consumers in the form of higher prices, which also incentivizes consumers to purchase less.
In Figure 3 below we illustrate how a tax can be used to incorporate the cost to society of electricity production, and reduce electricity production and the associated CO2 emissions from Qp to Qs. Recall from our earlier discussion, in a situation where there is no standard and no carbon tax, the quantity of electricity that firms produce will be Qp. When we add a carbon tax to the price of each unit of electricity, we shift the supply curve to the left. This is represented by the marginal social cost curve represented by the red line in this graph. At the new equilibrium where marginal social cost is equal to marginal benefits, the quantity supplied shifts from Qp to Qs just as in the Command and Control case. However, in this case a tax in the amount represented by the tan box is collected by the federal government. The government can then use this tax in a variety of ways such as giving the tax revenues back to the general population as a tax refund, investing in research on or construction of carbon reduction technologies, or using the money to reduce budget shortfalls.
Carbon taxes have been implemented in many countries, such as Finland, Denmark, Norway, Sweden, and British Columbia, among others. Success is often measured as reduced emissions, but other factors such as technology innovation and industrial efficiency gains have also been cited as factors of success. To learn more about carbon taxes and where they have been implemented refer to Carbontax.org. This website explains the basics of a carbon tax and provides examples of where carbon taxes have been implemented around the world.
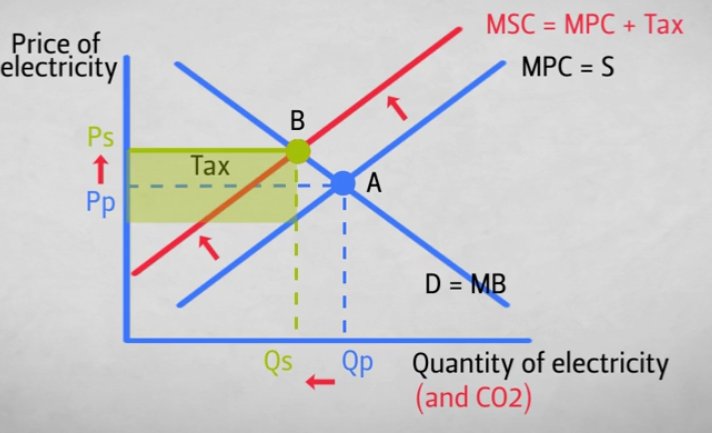
Figure 3. Carbon tax graphic example See also Climate Change Awareness Module 3: The Role of Economics. Forward to the “How can we correct this problem” section of the module and click on the Carbon Tax button for a more detailed explanation of carbon taxes.
A cap-and-trade system combines the command-and-control policy of setting a cap on emissions with a carbon pricing policy. With a Cap-and-Trade program, a limit or cap on emissions is set, and polluters receive or purchase emissions allowances. The total allowances are limited by the cap. Each pollution source (firm) can then design its own compliance strategy. They may choose to install pollution controls and implement efficiency measures; they also have the option to sell any excess allowances or purchase allowances if they find they cannot meet the emission standard by other means. This policy is most impactful when the firms within the industry are not identical and have different costs to reduce pollution. The key difference between this and the Command and Control policy is that the cost to each firm of compliance may be less than a taxing scheme because low-cost firms are allowed to trade allowances. Under a market based trading system, firms that can abate at a lower cost will choose to sell some of their allowances to firms that have higher costs of abatement.
The Environmental Protection Agency has successfully used cap-and-trade systems in the past to set up several clean air markets. Perhaps the most well-known is the Acid Rain program. This program has substantially reduced SO2 and NOx released into the atmosphere. These are compounds that can readily mix with water and oxygen in the atmosphere to form sulfuric and nitric acids, which then fall to the ground as acid rain. Acid rain is detrimental to plants, wildlife, fish, buildings, and humans. More recently cap-and-trade systems have been used to reduce carbon emissions in the Northeastern United States (Regional Greenhouse Gas Initiative) and California. For answers to some common questions about emissions trading, see these short videos about the Emissions Trading Scheme in New Zealand by Motu Research.
To better understand how a cap-and-trade program works and how it could be more efficient than command-and-control policies, let’s look at an example (Figure 4). Suppose we have two plants that are each currently emitting 100 tons of carbon dioxide for a total of 200 tons. The government wants to cap emissions at 100 tons. This requires a 100 ton reduction in emissions, so they establish a command-and-control policy requiring each plant to reduce emissions by 50 tons. Plant A can reduce emissions at a cost of $10 per ton, but plant B is less efficient and it costs them $20 per ton to reduce emissions. When each firm has to reduce emissions by 50 tons, the total cost of emission reductions is $1,500.
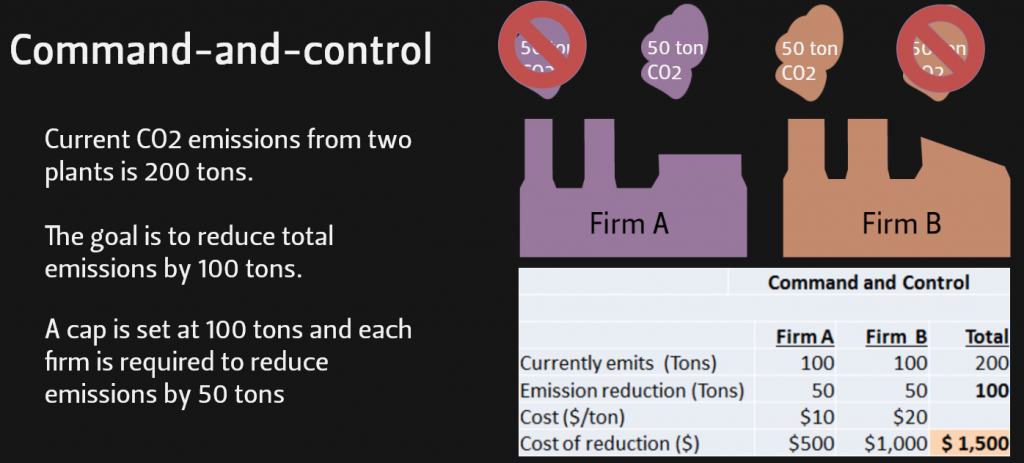
Figure 4. Command-and-control example See also Climate Change Awareness Module 3: The Role of Economics. Forward to the “Comparing command-and-control to cap-and-trade” section of the module for an illustrated comparison.
Now let’s look at how the costs would differ under a cap-and-trade policy (Figure 5). In this example each firm is given 50 allowances of 1 ton each. Since it is less expensive for Plant A to reduce emissions, they would benefit from reducing emissions and selling some or all of their allowances to Plant B.
Let’s assume that the price of allowances is set at $15. Just as in the previous example it costs Firm A $10/ton to reduce emissions and it costs Firm B $20/ton. Because it only costs plant A $10/ton to reduce their emissions, they will decide to reduce their emissions by 100 tons (bringing their emissions to 0). They can then sell all their allowances and receive $750. When this is subtracted from their cost of emissions reductions of $1000, their cost of emissions reductions after trading is only $250.
At $15/ton Firm B would choose not to reduce emissions at all , but to purchase 50 allowances from A for $750 because it will cost them $5/ton less than reducing their own emissions. Thus instead of paying $1000 to reduce their emissions by 50 tons, they pay $750 to purchase 50 allowances.
Even though Firm B does not reduce their emissions, the goal of 100 tons of emissions reductions is still met, because Firm A chose to reduce all of their emissions. In this case the goal of emission reductions is met with a total cost of only $1,000 a savings of $500 from the command and control option.
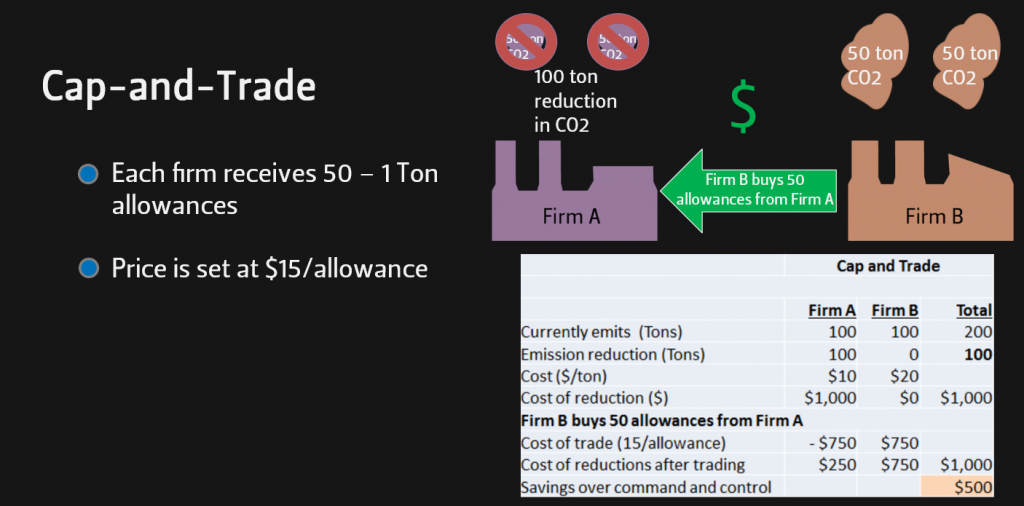
Figure 5. Cap-and-Trade example. See also Climate Change Awareness Module 3: The Role of Economics. Forward to the “Comparing command-and-control to cap-and-trade” section of the module for an illustrated comparison.
Plant A benefits financially from being more efficient and plant B has an incentive to find cheaper ways to reduce emissions in the future, so that they could benefit from selling their allowances or at least not have to purchase as many in the future.
Another common method that has been used to correct this problem is the use of subsidies. Subsidies are used to encourage desired behaviors. Subsidies represent the carrot approach as opposed to the stick approach of command and control policies. Subsidies come in various forms such as cash grants, low interest or interest-free loans, tax breaks, and rebate, offered to consumers and producers. For example in order to get producers and consumers to invest in energy efficient products and energy systems, Oregon has offered renewable energy development grants to organizations that plan to install renewable energy systems, as well as personal income tax credits to homeowners and renters for purchasing energy-efficient products and energy systems for their homes. Subsidies are often offered for only a short period of time to initiate changes in behavior with the aim that these changes will encourage and enhance emerging markets until they can work without government interference.
Discussion
There is no one climate policy that is the perfect solution. To make significant progress in combating climate change, a combination of several policies that influence both producer and consumer behaviors will be required. For example, as we have mentioned above, Oregon has offered subsidies in the form of tax rebates and grants. The Oregon legislature has also been looking into several carbon pricing bills which include cap and trade or cap and invest systems as well as a carbon tax and shift program. In 1996, Oregon also created a CO2 emission standard. This required new energy facilities to meet the CO2 standards or pay a carbon tax per metric ton of excess CO2. Facilities also have the option to provide cogeneration that offsets fossil fuels or invest in projects that offset CO2 emissions. Simultaneously the (Oregon) Climate Trust was established as a nonprofit organization and given the authority to purchase and retire CO2 offsets with the taxes collected from excess CO2 emissions.
Attempts to gain support for a national carbon tax or carbon cap-and-trade system have not yet been successful, but regional cap-and-trade systems such as the Regional Greenhouse Gas Initiative (RGGI) and the California Carbon Tax program have been showing signs of successfully controlling carbon emissions. As an added benefit, revenues from these programs have been used to offset rate increases and support investments in carbon saving technologies. For example the RGGI’s 2015 report, states that 64% of RGGI 2015 investments were used to support energy efficiency programs in the region, 16% were used to fund clean and renewable energy programs, and 4% have funded GHG abatement programs. These programs have also spurred local economic growth and job creation.
As knowledge of the impacts of climate change grows, consumer demand for alternative sources of energy is also growing and creating new markets and new jobs. For instance, several companies have emerged in recent years that build and or install windmill and solar panels. In addition to creating clean energy sources, these companies also create new employment opportunities and create demand for many raw materials that are needed to build these systems. The increase demand for these products and growth of alternative energy facilities has significantly contributed to the electricity capacity in the US in recent years. For example, about 60% of electricity generation capacity added to the U.S. grid in 2016 came from wind and solar (Cusick 2017). As these new energy markets become more stable, state and local governments will be eliminating many of the subsidy programs that have helped to establish these markets. The sun setting of many Oregon Department of Energy tax credits at the end of 2017 is a prime example.
Questions
- Can you identify some of the causes of climate change? Do you think global warming is having any impact on your daily life?
- To date there remains some uncertainty regarding the impacts that policies to slow down the rate of GHG emissions may have on economic development especially in lower income countries. Why is better information on these impacts critical to the design of policies and programs to address GHG emissions? How would you respond to those who suggest that we need to postpone taking any action to address GHG emissions until we “know all the facts”?
- How does an economist characterize the difference between private and social costs of production? In thinking about the air and water as environmental resources that humans value, how would you define the private and social costs associated with a manufacturing firm that is dumping waste products into the river, as was typical for textile firms in the 1900s in New England? Can you suggest a more recent example where the social costs of production exceed the private costs? What regulations have local and state governments imposed to address these situations?
- Are there examples where you are negatively impacted by others’ behavior? In these examples, what actions could you take to reduce the adverse impacts you are experiencing? Would these be more of a command-and-control (or ask-and–hope) type of request, or a request that compensates you for your “suffering”?
- Suppose you are a legislator voting on a series of options to address greenhouse gas emissions. What would be some of the things to consider when choosing one policy over another?
- How would you change or modify your driving and transportation choices if (1) the price of gasoline increased by 30 percent? (2) the price of gasoline doubled? (3) you were offered a $2000 rebate towards an electric car? (a mileage tax was imposed on your personal vehicle each year? (4) public transportation on a bus or train was free? Do you think incentives of this sort will work in the long-run? Why or why not?
References and links:
As Climate Changes, Southern States Will Suffer More Than Others https://www.nytimes.com/interactive/2017/06/29/climate/southern-states-worse-climate-effects.html
Carbon Tax Center Carbontax.org
Climate Change Awareness: Module 3. https://courses.ecampus.oregonstate.edu/oer/climatechange3/story_html5.html
Climate Change: Information on Potential Economic Effects Could Help Guide Federal Efforts to Reduce Fiscal Exposure. GAO-17-720: Published September 28, 2017. Publically Resealed: October 24, 2017, https://www.gao.gov/products/GAO-17-720
Cusick, D. Wind and Solar Growth Outpace Gas. Scientific American. E&E News. January 12, 2017. https://www.scientificamerican.com/article/wind-and-solar-growth-outpace-gas/
Environmental Protection Agency. The Social Cost of Carbon. https://19january2017snapshot.epa.gov/climatechange/social-cost-carbon_.html
Hsiang, S., R. Kopp, A. Jinar, J. Rising, M. Delgado, S. Mohan, J.D. Rasmussen, R. Muir-Wood, P. Wilson, M. Oppenheimer, K. Larsen, T. Houser. Estimating economic damage from climate change in the United States. Science. 2017. Vol 356, Issue 6345, pp. 1362-1369. http://science.sciencemag.org/content/356/6345/1362
Khan Academy Demand Curve as marginal benefit curve (video) www.khanacademy.org/economics-finance-domain/microeconomics/consumer-producer-surplus/consumer-producer-surplus-tut/v/demand-curve-as-marginal-benefit-curve
Liu, J.H. and J. Renfro. Carbon Tax and Shift: How to make it work for Oregon’s Economy. Northwest Economic Research Center Report. 2013. www.pdx.edu/nerc/carbontax2013.pdf
Motu Research. How does the Emissions Trading Scheme Help New Zeland Reduce Climate Change? All Questions. Published on Oct 3, 2017. https://www.youtube.com/watch?v=1GtMJEQPCHk. Individual questions can also be viewed at these links:
- What is emissions trading?
- How does emissions trading affect me?
- We’ve had an ETS for years why are emissions still going up?
- Can the ETS be fixed?
- What can we do about dodgy carbon credits?
- Is the ETS enough?
- Wouldn’t a carbon tax be better?
Oregon Department of Energy. Renewable Energy Development Grants http://www.oregon.gov/energy/At-Work/Pages/Renewable-Energy-Grants.aspx
Oregon Department of Energy. Residential Energy Tax Credit http://www.oregon.gov/energy/At-Home/Pages/All-Energy-Efficient-Devices.aspx
Oregon Environmental Council. 2017. Carbon pricing in Oregon: a brief history http://www.oeconline.org/wp-content/uploads/2017/09/Carbon-Pricing-History.pdf
Richard B.Stewart, The Future of Environmental Regulation: United States Environmental Regulation: AFailing Paradigm, 15 J.L.& Com. 585, 587(1996).
The Regional Greenhouse Gas Initiative (RGGI). The Investment of RGGI Proceeds in 2015. Published October 2017. rggi.org/docs/ProceedsReport/...eport_2015.pdf
Tietenberg, Thomas H. Emissions trading, an exercise in reforming pollution policy. Resources for the Future, 1985.
U.S. Energy Information Administration. How much of U.S. carbon dioxide emissions are associated with electricity generation? www.eia.gov/tools/faqs/faq.php?id=77&t=11


