
7.5: Tools Scientists Use to Study Climate Change
- Page ID
- 12271
Scientists must gather together all data that is available to them in order to make meaningful conclusions and predictions regarding climate change. When they bring these data together, the prediction they make is in the form of a scientific model. A model is a projection of what might happen in the future based on knowledge of current and past events. The models that are published to predict climate change must pass a rigorous scientific peer-review process, and often require the combination of findings of hundreds of experiments. These large-scale models are typically beyond the capacity of a standard desktop computer, and must be run by large super-computers housed at research universities or government laboratories. For more information on how scientists build and test models, follow the link below and click on the slideshow animation, paying special attention to the sections “Model Overview” and “Testing Models.” http://www.epa.gov/climatechange/science/future.html
.png?revision=1&size=bestfit&width=643&height=467)
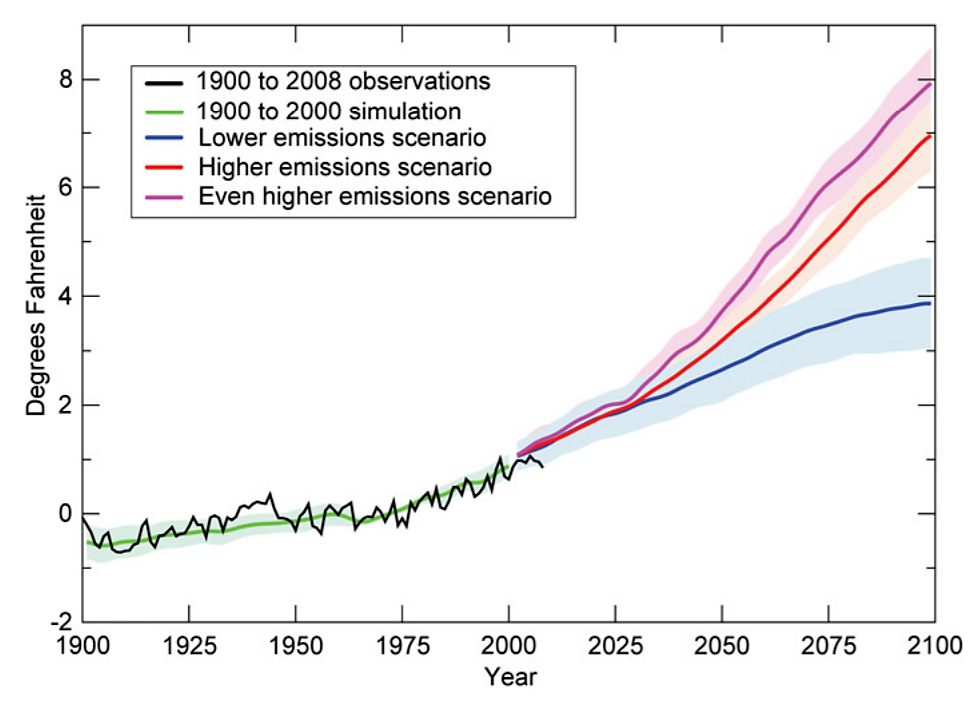
Figure \(\PageIndex{1}\) is one example of a scientific model of the impacts of climate change. Within this figure, we see the directly-measured observations of global average temperature (black line). We also see models of four different scenarios: 1900 to 2000 simulation using actual greenhouse emissions (green line), and 2000 to 2100 simulation using very high (purple line), high (red line), and low (blue line) greenhouse gas emissions scenarios.
Why did scientists make a model of the data from 1900 to 2000 in Figure \(\PageIndex{1}\) when they could just look up the data in published literature? This is an important component of model testing. In order to ensure accuracy of the model, you should not only be able to predict future events, but past events as well. Scientists use this as a way to “calibrate” their model. Since this model reliably predicts past events, chances are good that it will reliably predict future events as well.
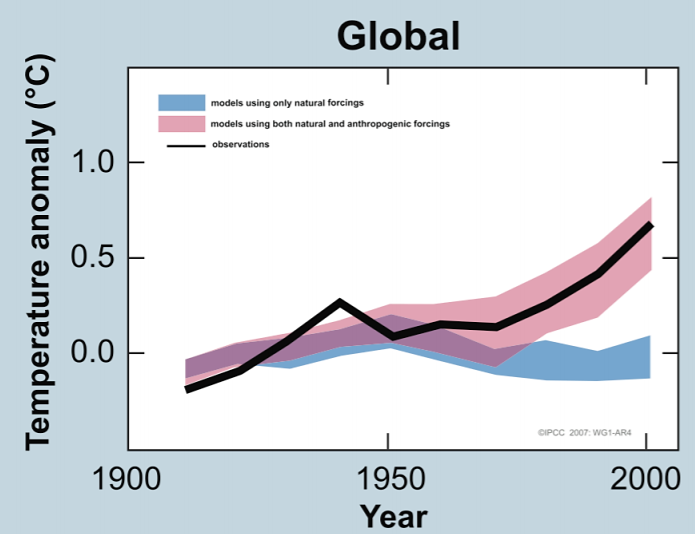
Another example of a climate model is shown in Figure \(\PageIndex{2}\) this time comparing climate projections with and without the influences of humans on greenhouse gas emissions. This large model is a combination of the work of many different models, in order to achieve the most accurate outcome.
.png?revision=1&size=bestfit&width=584&height=449)
In Figure \(\PageIndex{2}\), the decadal averages of observations are shown for the period 1906 to 2005 (black line). All temperatures are plotted relative to zero being defined as the corresponding average for the period from 1901 to 1950. The blue shaded band shows the 5% to 95% confidence interval for 19 simulations from 5 climate models using only the natural forcing effects due to solar activity and volcanoes. The red shaded band shows the 5% to 95% confidence interval for 58 different simulations from 14 climate models using both natural and anthropogenic forces. These different simulations and the different models are used by different scientific groups and represent different treatments of the Earth’s systems. It is thus quite encouraging that model calculations are in major agreement with the assumption that global temperature change from 1900 to 2000 is due to both natural and anthropogenic effects, with anthropogenic effects being the major causes in its recent dramatic increase. You will see more examples of climate models as you make your way into the final section of the climate change chapter: consequences of climate change.
Resources
NASA Global Climate Change: Vital Signs of the Planet http://climate.nasa.gov/
NOAA Paleoclimatology: Astronomical Theory of Climate Change www.ncdc.noaa.gov/paleo/milankovitch.html
Sass, Ronald. Q2: What are the Causes of Global Climate Change? OpenStax CNX. Sep 22, 2009 http://cnx.org/contents/5d263a29-7bd...c233619bca33@3
University of San Diego Virtual Museum: Climate Change earthguide.ucsd.edu/virtualmu...ge2/01_1.shtml
US EPA: Future Climate Change http://www.epa.gov/climatechange/science/future.html
US EPA: Overview of Greenhouse Gases http://epa.gov/climatechange/ghgemissions/gases.html
Terms list
Albedo
Chlorofluorocarbon
Confidence interval
Fluorinated gases
Global warming potential
Greenhouse effect
Hydrofluorocarbon
Ice age
Ice core
Landfill
Milankovitch cycles
Model
Parts per million
Perfluorocarbon
Solar radiation
Stable isotopes
Sulfur hexafluoride
Thermal equilibrium temperature
Water vapor