
3.4: Modern Climate Change
- Page ID
- 12030

Learning Objectives
After reading this module, students should be able to
- assess long-term global temperature records and place recent climate change into the context of historical temperature observations
- explain how changes in the Sun's energy output have impacted the last 1300 years of global temperature records
- analyze the human impact on the planetary albedo and relate these changes to recent climate change
- predict the response of the global average temperature when large volcanic eruptions occur
- explain the enhanced greenhouse effect
- discuss how recent observations of change measured within regional ecosystems are related to global climate change
Introduction
In previous modules, an examination of the geologic record of the earth’s climate in the Quaternary Period revealed the primary drivers of climate change. The most important conclusions to be drawn from the Modules 5.2 and 5.3 are the following:
- In the past, Earth has been significantly warmer (and mostly ice free) and significantly colder (especially during the so-called “Snowball Earth” eras) than it is today.
- Climate change occurs when there are changes in insolation, albedo, and composition of the atmosphere.
- Climate is the average of weather, and changes to the earth’s climate occur on long time scales.
Recent climate change, which has occurred during the modern instrument era, is the focus of this module. It is through the lens of long-term climate change (occurring on thousands to millions of years) that we will view earth’s current climate and recent climate change. The goal is to investigate how the principles listed above are shaping current climate events.
Mechanisms
Temperature Records
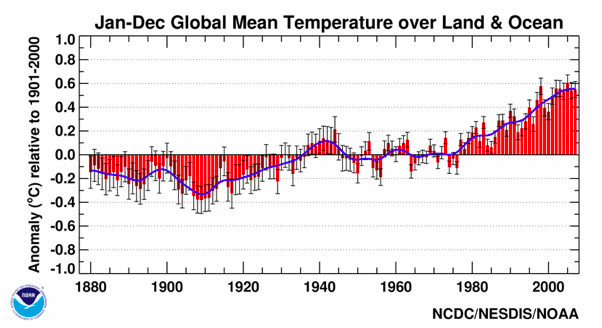
Figure \(\PageIndex{1}\) clearly shows that the current global average temperature reflects an interglacial warm period. If we focus in on the end of this record we can observe some of the fine scale changes in the global temperature records. Figure \(\PageIndex{1}\) combines proxy data (i.e., information from ice cores and tree rings) with the modern instrument record to create a graph showing the last 1300 years of Northern Hemisphere (hereafter, NH) temperatures. Each line on the top two panels represents a different temperature data set collected in the NH and the bottom panel color codes the percentage of overlap among these data sets.
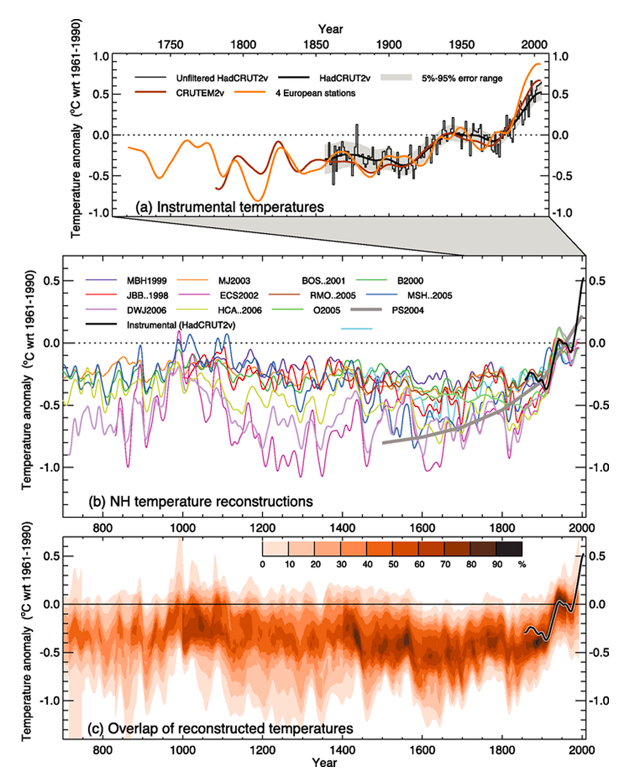
Major features in these data include the medieval warm period approximately 1,000 years ago and the little ice age approximately 400 years ago. Even with these events, the bottom panel shows that most of the variability in the NH temperature fits within a 0.5°C temperature range. Rarely has the temperature exceeded the 1961-1990 average, which is the dividing line on this graph. The only major fluctuation outside of this range is during the modern instrument era of the last 300 years, where confidence between the data sets is high. Beginning in the 1800s, the solid black line in each panel traces out approximately a 1°C increase in global temperatures. It is this increase that is the central focus in recent climate change science. Remember from the previous chapter that a 1°C change in the earth’s temperature is a large change; reduce the global average by 4°C to 6°C and much of the NH will be covered with ice as it was 20,000 years ago.
There has been much debate over recent climate change, especially in the news media and among political parties around the world. This debate is centered on the cause of the recent 1°C increase–is it a part of the natural variability in the climate system or have anthropogenic, which simply means human caused, influences played a major role? In a recent survey given to more than 3,000 college students at the University of Illinois at Urbana-Champaign, it was found the approximately two thirds of those surveyed agreed that recent climate change was due to reasons beyond natural variability in the climate system. (see Figure \(\PageIndex{2}\)) Approximately 20% reported that the climate change is due to natural changes and the remainder was undecided. Let’s investigate both sides of this argument!

Recall from the Module 5.3 that global climate will change as a response to changes in insolation, albedo and the composition of the atmosphere. It was shown that the amount of energy entering the earth-atmosphere system from the sun varies less than 0.1% during the 11-year solar cycle in sunspot activity. Outside of this cycle, the amount of energy from the sun has increased 0.12 watts per square meter (W/m2) since 1750. Is this enough excess energy to produce the 1°C increase in global temperatures that has been observed since the 1800s? As it turns out, the climate system needs nearly 8 times that amount of energy to warm by 1°C. This essentially eliminates fluctuations in solar output as the culprit for recent climate change.
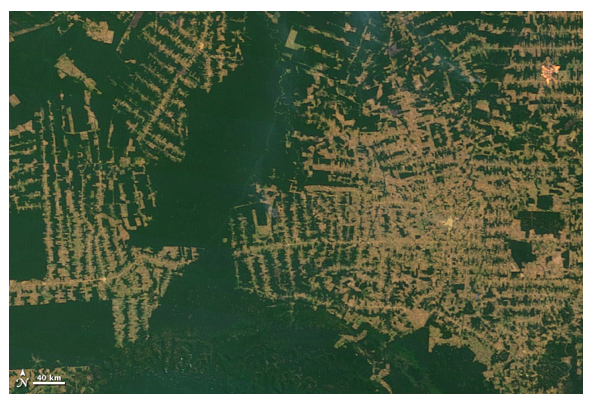
Has the earth’s albedo changed since the 1800s? As we know from the Module 5.2, increases in the Earth’s albedo lead to global cooling and decreases lead to warming. The net effect of human existence on Earth is to brighten the surface and increase the global albedo. This change is primarily accomplished through intensive agriculture where forest, marshland, and open prairie are cut down and crops like soybeans, corn, wheat, cotton, and rice are grown in their place. Add this to the current high rates of deforestation in South America and Africa and the evidence is clear that mankind has increased the Earth’s albedo, which should have led to global cooling. (see Figure \(\PageIndex{3}\))
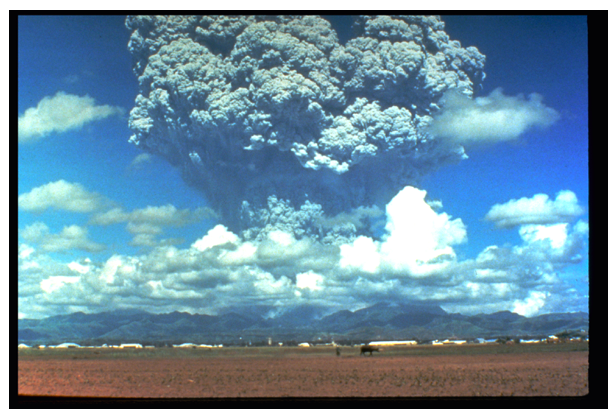
Outside of human influence, planetary albedo can also be changed by major volcanic eruptions. When volcanoes erupt, they spew enormous amounts of soot, ash, dust, sulfur, and other aerosols into the atmosphere. During major eruptions, like that of Mt. Pinatubo in 1991, some particles of this debris find their way into the stratosphere, where they reside for a few years. (see Figure \(\PageIndex{4}\)) The presence of these particles high in the earth’s atmosphere acts like a shield that prevents sunlight from penetrating through the lower atmosphere to warm the earth’s surface. Instead, the energy is either absorbed by the particles or reflected and scattered away. The net effect is that large volcanic eruptions can cool the planet for a few years by changing the earth’s albedo.
Observations of Solar Output and Volcanic Eruptions
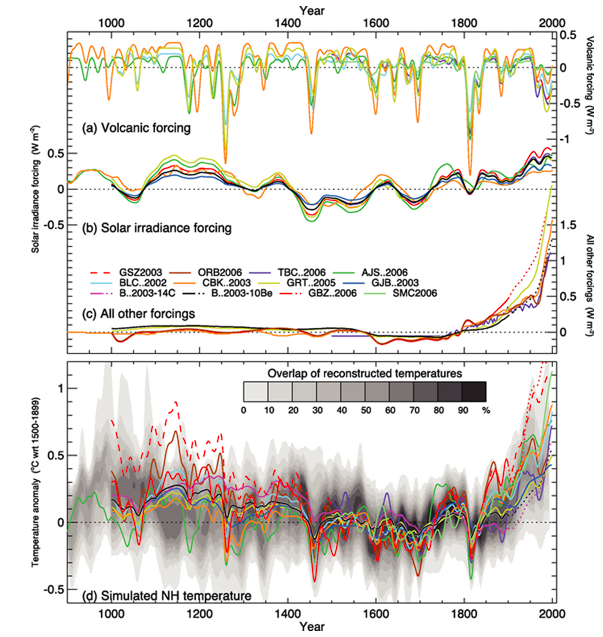
At first glance the Figure \(\PageIndex{5}\) looks quite complicated, but let’s break this graph down to understand how changes in the sun’s output and volcanic eruptions have contributed to recent climate change. In the top panel (a), changes in the amount of energy, measured in W/m2, are graphed against time to show how volcanic eruptions have impacted the amount of energy the earth receives from the sun. Notice that around the year 1815, when Mt. Tambora erupted, there is a large downward spike in the plot. Now, examine the bottom panel, which shows the NH temperatures, just as Figure \(\PageIndex{1}\) displayed, and see how the temperatures in the years following 1815 took a sharp downward turn. This is a direct consequence of the changes in albedo caused by large volcanic eruptions. Next, look at the time period between 1000 and 1300 A.D., the so-called Medieval Warm Period. In panel (b), changes in solar output are graphed against time; notice that during the Medieval Warm Period, the amount of insolation was high compared to the average. The opposite occurred during the Little Ice Age which peaked around 400 years ago.
Source: Climate Change 2007: The Physical Science Basis: Contribution of Working Group I to the Fourth Assessment Report of the Intergovernmental Panel on Climate Change, Cambridge University Press
Alterations to the Natural Greenhouse Effect
We have ruled out the first two mechanisms (i.e., changes in albedo and insolation) as reasons for the recent increase in global temperatures. But when we look at panel (c) in Figure \(\PageIndex{5}\), we notice that the “all other forcing” curves point to a rapid increase in the amount of energy retained by the earth-atmosphere system over the last 200 years. What is responsible for the increasing tail on this graph? Have humans altered the composition of the Earth’s atmosphere to make it more efficient at absorbing the infrared radiation that would have otherwise been lost to space? Is there proof of a human enhancement to the natural greenhouse effect? Can we explain the recent warming on an anthropogenic adjustment to the greenhouse gases like carbon dioxide (CO2)? Is an “enhanced greenhouse effect” to blame for the fact that the top ten warmest years since the modern era of instrument measurements have occurred since 1995, as seen in Figure \(\PageIndex{6}\).
Long before the term “global warming” became a common household phrase, nineteenth-century Irish physicist John Tyndall said, “Remove for a single summer-night the aqueous vapor from the air which overspreads this country, and you would assuredly destroy every plant capable of being destroyed by a freezing temperature.” This now famous quote reveals the importance of greenhouse gases, like water vapor, in maintaining a balance between the incident solar radiation and the emitted terrestrial radiation. Tyndall understood that without greenhouse gases, water vapor being the most abundant, the earth’s temperature would be markedly cooler. The global average surface temperature is approximately 15°C (59°F) but if the greenhouse gases were removed, the average global temperature would plummet to -18°C (0°F). Remember that these gases make up a small fraction of the composition of the atmosphere! Therefore, adjustments to their concentration will produce dramatic effects.
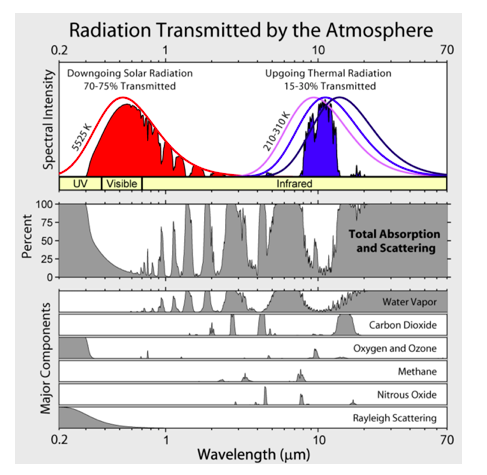
To understand why these gases are so efficient at keeping the planet warm, let’s examine Figure \(\PageIndex{7}\). The top panel of this figure shows the normalized intensity of the radiation emitted by both the sun and earth as a function of wavelength. The middle panel shows the total atmospheric absorption spectrum and the bottom panel shows the individual gas absorption spectrum (excluding Nitrogen and Argon). Notice from the top panel that the sun’s peak energy emission falls within the visible portion of the spectrum and suffers very little atmospheric absorption (middle panel). The peak emission wavelength for the earth is in the thermal infrared (IR), and it is effectively absorbed by water vapor (H20), carbon dioxide (CO2), methane (CH4) and nitrous oxide (N02). The primary purpose of this figure is to show that the gases in the earth’s atmosphere are transparent to the sun’s peak energy emission (visible light) but not the earth’s peak emission (thermal IR). It is through the absorption of the earth’s outgoing thermal infrared radiation that the global average temperature warms approximately 60°F over what it would be without greenhouse gases.
Are humans altering the natural greenhouse effect? Based upon our assessment so far, this is the final mechanism by which the global climate can be changed. Let’s look into the alteration of the chemistry and composition of the earth’s atmosphere. First are humans increasing the amount of water vapor, the most abundant but also weakest greenhouse gas in the atmosphere? As the air temperature increases, the amount of water vapor the atmosphere can hold also increases. However, a closer investigation of the water cycle is needed to understand what will happen to this increase in water vapor. In this cycle, the amount of evaporation must equal the amount of condensation and thus precipitation on a global scale. This equilibrium must be achieved or else water would end up entirely in its liquid form or in its vapor form. Also due to the speed at which the hydrological cycle operates, a large increase in water vapor would be quickly precipitated out of the atmosphere.
Other greenhouse gases progress through their respective cycles much more slowly than water. There are vast amounts of carbon and carbon dioxide in the earth-atmosphere system. Most carbon is locked up in rocks, where it may remain for millions of years. The carbon dioxide that is mobile, however, is mostly found in other places: the ocean, soils, vegetation, fossil fuels like coal, oil, and natural gas, and also in small concentrations in the atmosphere. These reservoirs of CO2 can exchange mass like oceans and clouds do in the water cycle, but with one extremely important difference–the exchange rate is much slower. That means the system can get out of balance and remain out of balance for a long time, hundreds or thousands of years. There are two primary mechanisms for sequestering carbon dioxide that is released into the atmosphere: it can be captured by the respiration of plants, or dissolved in the ocean.
However, the rate at which plants and oceans can take CO2 out of the atmosphere is fixed. Therefore, if a surplus of CO2 is added to the atmosphere, it will stay there for a long time. This has major implications, given the fact that CO2 is a powerful greenhouse gas. The question then to ask becomes, “is this exchange rate out of balance?”
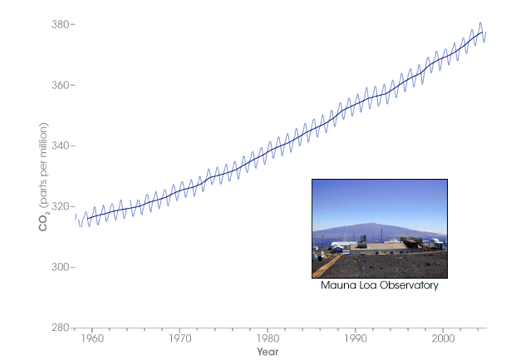
The current average concentration of CO2 in the atmosphere is about 390 parts per million (PPM), which means there are 390 parts of CO2 per million parts of air. That does not seem like very much, but if that small amount of carbon dioxide were removed from the air, the global average temperature would plummet. Has this concentration been changing? To answer the question, we will turn to the findings of Richard Keeling, whose life’s work was the observation of CO2 concentrations at the Mauna Loa Observatory in Hawaii. Beginning in the early 1950s, observations of CO2, a well mixed gas in our atmosphere, have shown a remarkable climb in concentration. (see Figure \(\PageIndex{8}\)) The “Keeling Curve,” as it is sometimes called, clearly shows that since the 1950s CO2 concentrations have increased steadily from 315 ppm to 390 ppm. The zigzag nature of this graph is due to life cycle of plants in the NH. The NH has much more land area that the SH, so when spring and summer arrive in the NH, the abundance of new plant life reduces the CO2 concentrations in the atmosphere. When the plants die or become dormant in the fall and winter, CO2 concentrations spike again.
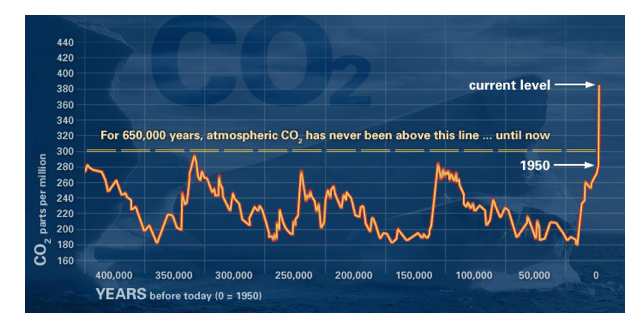
What is troublesome about this figure is that the carbon cycle is out of its normal rhythm and a surplus of CO2, a known greenhouse gas, is building in the earth’s atmosphere. Where is this surplus coming from? To answer this question, let’s look at two historical records of CO2 concentrations taken from ice core deposits. The top panel in Figure \(\PageIndex{9}\) shows the past 10,000 years of atmospheric CO2 concentrations. Before 1750, the amount of CO2 in the atmosphere was relatively steady at 280 ppm. Since 1750 there has been a dramatic increase in CO2concentrations.
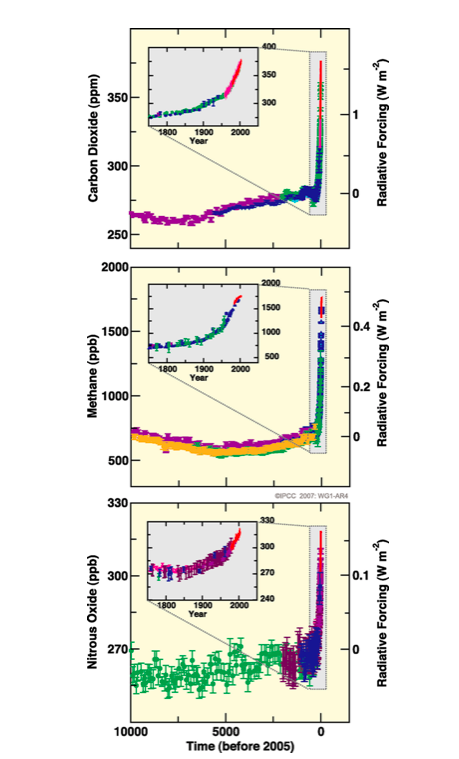
If we look even further back in time, over the last half million years, we see a similar story. (see Figure \(\PageIndex{10}\)) The current concentration of CO2 in the earth’s atmosphere is higher than at any time in the past half million years. Where is this abundance of CO2 coming from? Which reservoirs are being depleted of their CO2 while the atmosphere takes on more? The answer lies in the burning of fossil fuels and in the deforestation of significant chunks of the earth’s forest biomes. Notice the spike in CO2 concentrations beginning around 1750. This time period marks the beginning of the industrial revolution, when fossil fuels overtook wood as the primary energy source on our planet. Over the subsequent two and a half centuries, oil, coal, and natural gas have been extracted from their underground reservoirs and burned to generate electricity and power modern forms of transportation. The exhaust from this process is currently adding 30 billions of tons, or gigatons (Gt), of carbon dioxide to the atmosphere each year. Combine this addition of CO2, a known greenhouse gas, to the subtraction of one of the sinks of CO2 through deforestation and the imbalance grows even further.
What is the end result? By examining the earth’s climate, both current and past and by investigating the three ways in which climate can change, we have arrived at the conclusion that the current warming is being caused by an imbalance in the carbon cycle that has been induced by human activity, namely the burning of fossil fuels. The record warmth over the last 1,300 years is very likely to have been caused by human decisions that have lead to a change in the chemistry of the atmosphere, and which has altered the natural climate variability toward warmer global temperatures. We are essentially changing the climate faster and in a different direction than natural processes have intended.
Observed Effects of Climate Change
Cherry Blossoms
In Japan each spring millions of people celebrate the blossoming of the cherry trees to mark the arrival of warmer weather. These celebrations have a long and storied history, and records of the cherry blossom festivals date back more than a thousand years. In fact, the record of the timing of the cherry blossoms in Japan is the oldest for any flowering plant! Two scientists and historians. Richard Primack and Hiroyoshi Higuchi recently analyzed this record and found that beginning in the early 1800s the mean air temperature in March has slowly risen, similar to the increase shown in Figure \(\PageIndex{11}\). During this same time period, the flowering date has slowly crept earlier in the season, and the trees are now flowering several days before they traditionally flowered. Although urbanization of Japan has lead to an increase in temperature, recent climate change is blamed for the earlier flowering of the Japanese cherry blossom tree. Primack and Higuchi show how Kyoto has warmed an average of 3.4°C over the last 170 years. Climate change has contributed 18% to this total warming in Japan and Primack and Higuchi demonstrate the correlation of this warming with the industrial revolution.
Birds, Mosquitoes, and Fire Ants
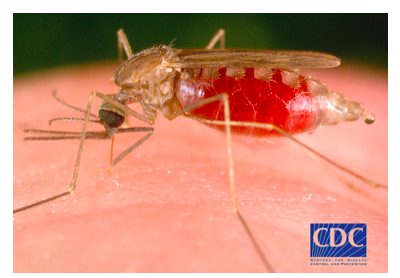
A recent article in the journal Nature discussed the response of plants and animals to current climate change. Phenologists, scientists who study how the periodic life cycle events of animals and plants are affected by variations in climate over the course of seasons and years, are finding that many species of birds are breeding and singing earlier in the year. Migrant birds are arriving earlier, butterflies are appearing earlier and some amphibians are spawning weeks ahead of their historical schedule. In addition, mountain tree lines, which are controlled by air temperature, have been advancing to higher altitudes in Europe, and Arctic shrubs are now found in regions that were once too cold for their existence in Alaska. While ecological changes such as these may not be threatening from a human perspective, others are. For example, malaria-carrying mosquitoes in Africa are now being found at altitudes that were once too cold for them, and outbreaks of malaria are showing up in towns and villages once thought to be out of their reach. In parts of California and Australia, fire ants are migrating to regions that historically have been too cold to support them.

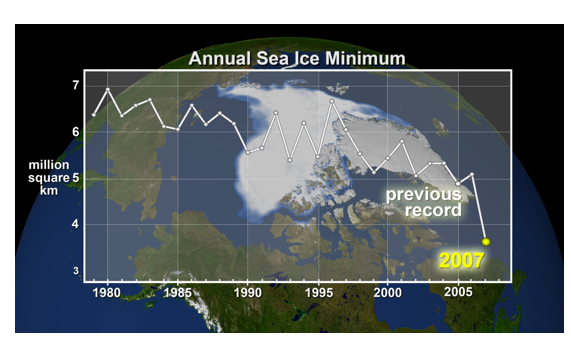
Impacts of Change in the Arctic and the Antarctic
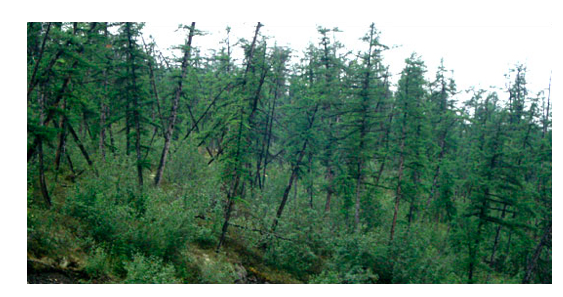
The Arctic and Antarctic are the regions experiencing the most rapid changes due to the recent warming of the earth’s atmosphere. These two regions on Earth are a part of the cryosphere, which is defined as the part of the Earth that is occupied by sea ice, lake ice, ice caps and permafrost. (For a comprehensive overview of the current state of the cryosphere and an excellent archive of data, please check out “The Cryosphere Today”) As explained in the Module 5.3, these regions are most vulnerable due to the powerful ice-albedo effect. One amazing depiction of polar warming can be found in the drunken forests of Siberia. Larch and spruce trees there are often seen tilted over on their sides and growing at strange angles. Why? Because the once continually frozen soil, or permafrost, in which they are rooted has been melting in recent years. As the soil thaws it becomes more malleable and the trees begin to slant as the soil beneath them sinks. Farther north, Arctic sea ice has been decreasing both in extent and concentration. In 2007, the smallest extent of sea ice was measured since the 1970s, and the Northwest Passage opened for commerce and exploration. As the sea ice extent and concentration decreases, so does the habitat of polar bears. The sea ice is a vital part of their hunting grounds, and recent decreases of this ice have greatly reduced their access to certain prey. In addition to sea ice reductions, surface melt of the ice sheet on Greenland has increased in recent years, especially along its edges. This melt has lead to large pools and streams forming on top of this mile-thick sheet of ice. On the other side of the world, the Larsen B ice shelf in Antarctica recently collapsed, sending a large section of ice into the sea. This section of the Antarctic ice cap was roughly as large as the state of Rhode Island and it had been stably attached to the ice shelf for the past 12,000 years. Scientists are closely watching the Antarctic ice as nearly two-thirds of the world’s fresh water resides there. Finally, alpine glacier retreat has been observed on every continent. With few exceptions, these glaciers have been retracting heavily since the 1960s, and over that time period NASA reports a global loss of 8,000 cubic kilometers of ice, which represents a what percentage reduction?
The Oceans’ Response
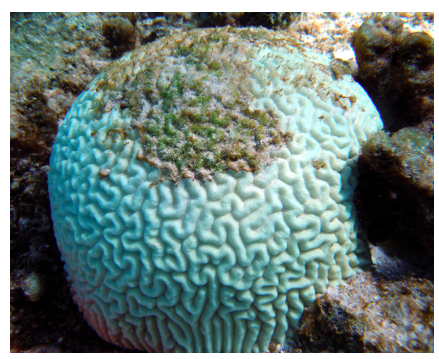
Further dramatic changes brought on by recent warming have been observed by scientists concerned with the world’s oceans. Observations of the world’s coral reefs have revealed an alarming rate of coral bleaching (which is not caused by chlorine). As the oceans attempt to uptake the abundance of CO2 and absorb nearly 80% of the heat added to the earth-atmosphere system from the enhanced greenhouse effect, the waters will inevitably warm. As these waters have warmed over the past 40 years, the delicate ecological balance within some of the world’s coral reefs has been upset leading to coral bleaching. Under warmer waters the rate at which the algae, which is an important part of the coral ecosystem, undergoes photosynthesis is too much for the coral to manage. As a result, the coral rids itself of the algae, which leads to an exposure of the white skeleton of the coral. Another consequence of warming oceans is an increase in sea level. Since 1880, sea level has risen 20 cm (8 inches). The rise in sea level is associated both with an increase in glacial melt water and in the thermal expansion of the seawater. An interesting consequence of this rise in sea level has been the disappearance of the long-disputed New Moore Island between Bangladesh and India. Both countries laid claim to the shallow, uninhabited island due to the speculation that oil reserves may lie beneath it, but in 2010, the sea swallowed it. Scientists at the School of Oceanographic Studies at Jadavpur University, Kolkatta, India suggest global warming played an important part.
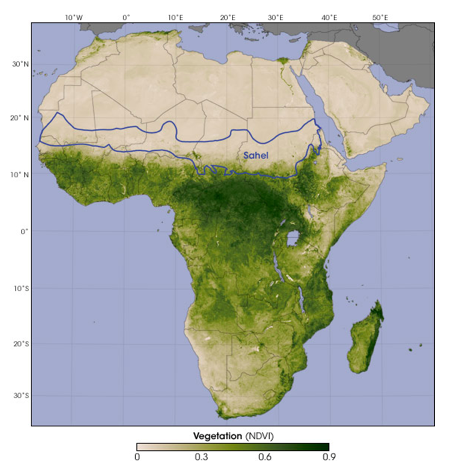
Finally, as the planet has adjusted to warmer temperatures the proliferation of drought conditions in some regions has dramatically affected human populations. The Sahel, for example, is a border region between the Sahara Desert in the north of Africa and the tropical rainforests that occupy the central part of the continent. (see Figure \(\PageIndex{17}\)) This region is experiencing desertification as the Sahara steadily expands southward. Since the 1970s, the amount of precipitation in this region has been steadily below normal. The combination of over irrigation and recent climate change has made the region uninhabitable and forced millions to relocate.
Review Questions
- In Figure \(\PageIndex{1}\) the dividing line on the graph is the 1961-1990 average temperature. Explain the relevance of this line to the data presented in this figure.
- Explain how deforestation can lead to both a warming effect and cooling effect for global temperatures.
- In Figure \(\PageIndex{7}\), which gas is contributing the most to the absorption of ultra-violet light? If this gas were removed from the atmosphere, how might global temperatures respond?
- If the surface of the Greenland Ice Sheet continues to melt, how will this impact the albedo of this region and what impact will this have on the air temperature there?
- When sea ice melts, what happens to global sea level?
References
Walther, G. R., Post, E., Convey, P., Menzel, A., Parmesan, C., Beebee, T. J .C., et al. (2002, March 28). Ecological responses to recent climate change. Nature, 416, 389-395. doi: 10.1038/416389a
Glossary
- anthropogenic
- Caused or produced by humans.
- hydrological cycle
- The continuous movement of water on, above and below the surface of the earth. This cycle is dominated by the global equilibrium in evaporation and condensation.
- little ice age
- A cool period in the NH, primarily in Europe from the sixteenth to the nineteenth century.
- medieval warm period
- A warm period in the NH during the tenth and eleventh centuries.
- northwest passage
- A sea route for commerce through the Arctic Ocean north of Canada.
- permafrost
- Soil that has a temperature that has remained below freezing (0°C or 32°F) for at least two years.
- radiative forcing
- Change{a in net irradiance (an energy flux) measured at some boundary. For this text the boundary is typically at the surface of the earth or the top of atmosphere. A positive change indicates warming and a negative change indicates cooling.
- watts per square meter (W/m2)
- Energy (Joules) per second moving through a surface (square meter). A flux of energy through a surface area.
- well-mixed gas
- A gas that can be found at the same concentration throughout the lower atmosphere regardless of location.