
15.3: Example of Laboratory Report
- Page ID
- 43995
This page is a draft and is under active development.
This is an example of the laboratory report format. It is not meant to represent a real lab (not sufficient for the lab requirement in this course) but meant to highlight the format. It is purposely made very simple to not obfuscate the purpose of this example.
Linearity of a resistor
Anakin Skywalker
Ahsoka Tano
askywalker@jeditemple.edu
atano@jeditemple.edu
1:00 pm - 3:00 pm 10/21/1980
Laboratory Location: Jedi Temple, Coruscant, Room 210E
Abstract
This experiment seeks to determine if a 5 ohm resistor is linear to within 5% in the voltage range 0.160 to 2.50 volts. A simple serial circuit was devised and tests showed that the resistor was linear to well within 5%.
Introduction
Common resistors, like ACME off-the-shelf resistors, are usually carbon-composite resistors. An ideal resistor has the mathematical relationship V = IR, called Ohm's Law, where V is the instantaneous voltage across the resistor, I is the current, and R is a proportionality constant that is called resistance. Ohm's law holds in most circumstances however is not valid at extreme temperature ranges, voltage ranges, and high frequencies.
A non-ideal resistor will have a linear range which follows Ohm's Law closely and a non-linear range associated with it. For most applications it is desirable to operate the resistor in the linear range. Testing the linearity of circuits whether they are resistors or other circuit items is commonplace in industry.
Several tests performed by a number of groups seem to indicate that resistors are linear with respect to voltage. However resistors are known to go non-linear in certain voltage ranges. Our group has an application that requires a 5 ohm resistor to be linear between the voltage ranges of 0.160 to 2.50 volts. We believe that an off the shelf resistor found an ACME should be linear to better than 5%. To test this we will measure the current through a resistor with a known applied voltage within the above voltage range.
Materials
Hewlett Packard 6253A DC Power Supply
Fluke T5-600 ammeter
Fluke 189 Multimeter
Connector Board
plug leads
ACME resistor [1 Watt 5 ohm 10% tolerance (silver band)]
Procedure
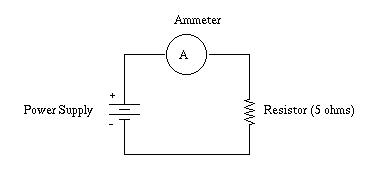
- Using the connector board connect the resistor to the power supply (see diagram).
- Connect the ammeter in series.
- Change the voltage to the following 5 voltages: 0.160, 0.300,0.630,1.30, and 2.50 volts (in a cyclic order)
- Repeat this sequences 5 times recording the current each time.
Results
The results are tabulated in the table (table 1) in the appendix with current readings repeated a number of times to give us a reasonable error bar. The laboratory's temperature was 25 degrees C and had a steady relative humidity of 45% during the experiment.
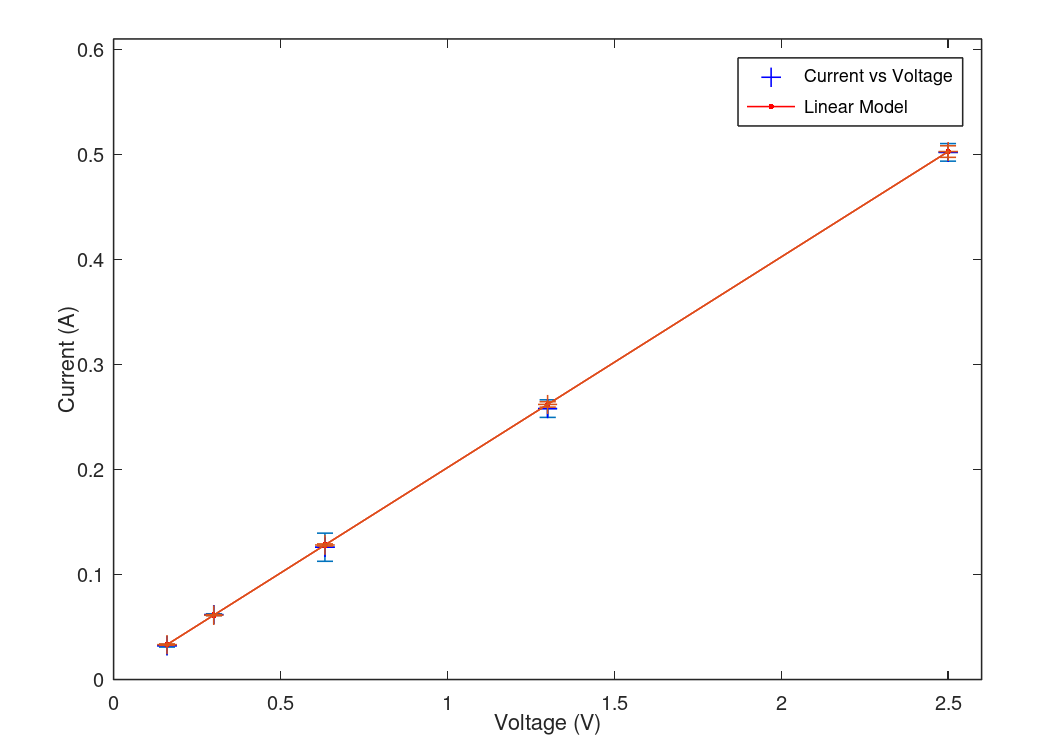
A linear fit (see figure 1) gives us the following relationship between current and voltage:
I = (0.201 +/- 0.002)V + (0.00112 +/- 0.001)
 |
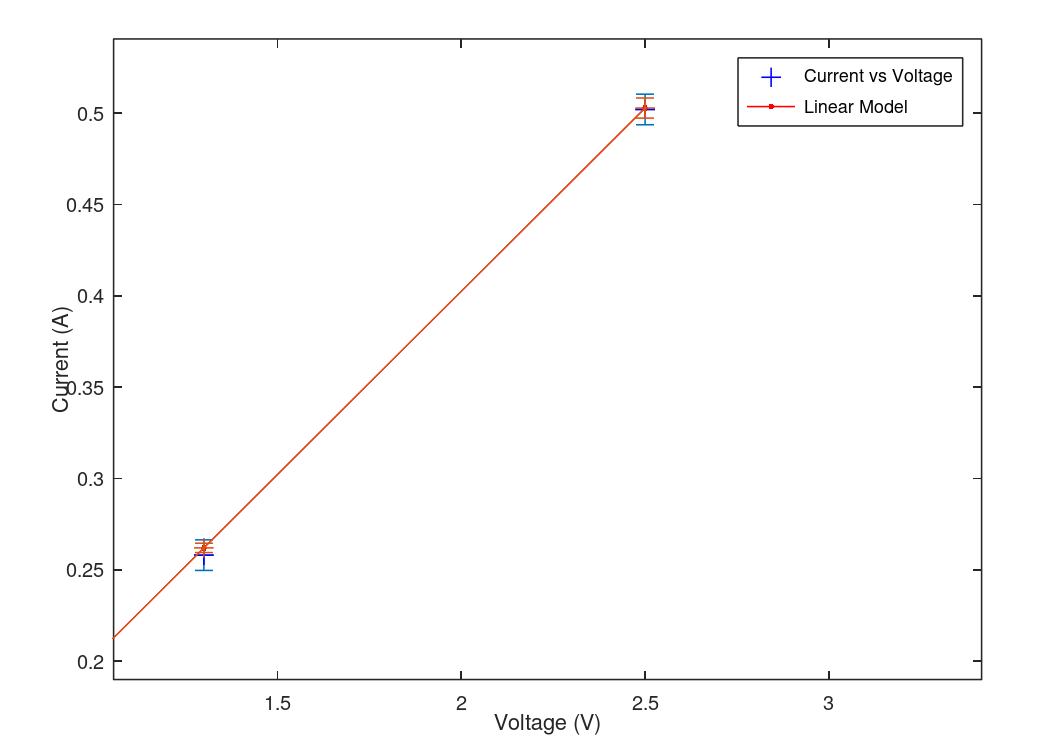 |
| Fit of current versus voltage based off this simple lab example. A linear fit is clearly evident with no significant deviation. | Close up of error bars to show that the model error bars (red) are different from the data error bars (blue). These differences are insignificant giving us visual confidence in our data (statistical confidence was confirmed as well). |
Discussion
The relationship derived in the results is fairly close to the theoretical relationship of I = V/R with R in the range of 5 ohms. We anticipated an intercept of zero in this experiment, however, the linear fit suggests otherwise. This could be an unknown effect of the resistor or power supply however we believe that we did not take enough data to provide a perfect linear fit. It is our opinion that increasing the number of data points will produce a zero intercept. Further experiments should have more voltage points and more current readings.
While this experiment showed that the resistance is linear within this voltage range, it was very limited in scope. A better experiment would have tested multiple resistors at many voltage levels.
Conclusion
Within the voltage range of 0.160 to 2.50 volts we have determined that resistance is linear. The fit closely matches the theoretical equation I = V/R.
Reference
Electronic Components and Measurements, Bruce D. Wedlock and James K. Roberge, Prentice-Hall, Inc. Englewood Cliffs, NJ (1969).
Through a vision of the future, we have found a replacement for the above book that is now out of print:
Practical Electronics for Inventors, 4th edition, Paul Scherz and Simon Monk, McGraw-Hill (2016).
Appendix
Table 1: Current versus voltage to determine if the resistor provide is linear within a range of 0.160 to 2.50 volts. (We don't have a lot of data so we feel it is alright to place the data into the lab report. We understand that if we had 100s of data points we should just show the graph.)
|
Voltage (V) |
Imeasured (A) |
<I> |
σI |
|---|---|---|---|
|
0.160 |
0.0310 |
0.0322 |
0.00130 |
|
0.160 |
0.0330 |
||
|
0.160 |
0.0310 |
||
|
0.160 |
0.0340 |
||
|
0.160 |
0.0320 |
||
|
0.300 |
0.0610 |
0.0618 |
0.000837 |
|
0.300 |
0.0620 |
||
|
0.300 |
0.0630 |
||
|
0.300 |
0.0610 |
||
|
0.300 |
0.0620 |
||
|
0.630 |
0.140 |
0.126 |
0.0134 |
|
0.630 |
0.120 |
||
|
0.630 |
0.110 |
||
|
0.630 |
0.120 |
||
|
0.630 |
0.140 |
||
|
1.30 |
0.250 |
0.258 |
0.00837 |
|
1.30 |
0.270 |
||
|
1.30 |
0.260 |
||
|
1.30 |
0.260 |
||
|
1.30 |
0.250 |
||
|
2.50 |
0.500 |
0.502 |
0.00837 |
|
2.50 |
0.490 |
||
|
2.50 |
0.510 |
||
|
2.50 |
0.510 |
||
|
2.50 |
0.500 |