
6.1: Introduction and Background
- Page ID
- 93660
ERD stands for Entity Relationship Diagram. An ER diagram illustrates the logic within a database and how individual components relate to one another (Visual Paradigm). Similar to a story board for film, an ER diagram lays out the wireframe of internal database structures to aid in understanding, improving efficiency, and debugging logical errors. The key pieces of an ER diagram are the entities, attributes, and the relationships between them. For example, within the complex systems of Amazon, they would have an entity for customer listing attributes such as name, address, payment, and email. Once an order is placed and ready for shipment, the shipping database would access the customer database to retrieve information to complete the order and ship out the package. An ER diagram would show how the shipping department can access many customers within the database, and the information it would require to complete shipment.
In the 1960s and 1970s, there was a rise in data modeling needs and published works on different models. Peter Chen is attributed with inventing and promoting the entity-relationship model stemming from a paper he published in 1976, “The Entity-Relationship Model – Toward a Unified View of Data” (Kempe, 2013). As databases and businesses grew more complex, a unified modeling system became more important so that structures could be modeled across industries consistently. After the original ERD was developed by Peter Chen, many of his colleagues adapted and made small alterations to improve and simplify the overall model. The key components are still present; the look has been simplified to accommodate more complex systems. Below we see examples of both the original and newer ERD models.

- This is an example of an older ERD version depicting e-commerce Company. We can tell because there are action diamonds between entities, and attributes are each listed separately in individual ovals.
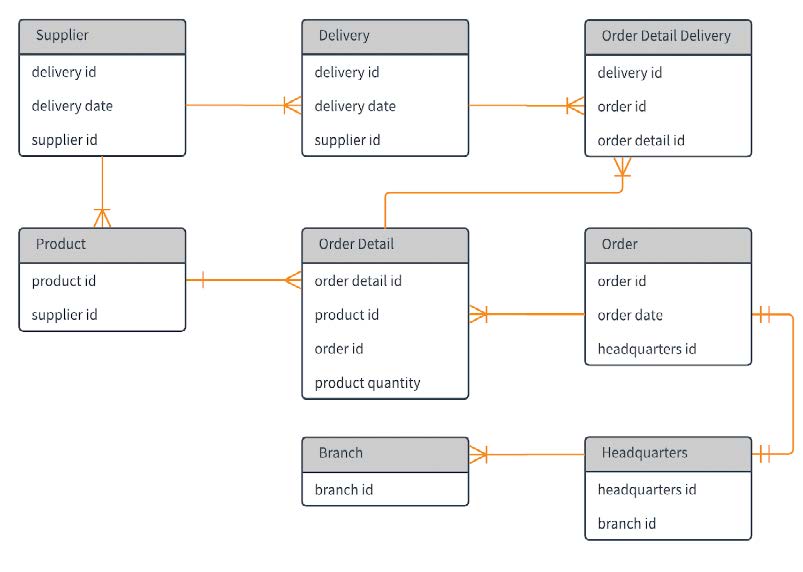
- In this newer ERD e-commerce example, we see attributes listed within each entity, and no actions are present. If depicted in the older model, we would see 21 attribute ovals and a minimum of 8 actions. This would create visual clutter, making the ERD harder to examine, detracting from its usefulness.