
9.2.4: Project Initiation
- Page ID
- 75251

The project initiation phase is the first phase within the project management life cycle, as it involves starting up a new project. Within the initiation phase, the business problem or opportunity is identified, a solution is defined, a project is formed, and a project team is appointed to build and deliver the solution to the customer. A business case is created to define the problem or opportunity in detail and identify a preferred solution for implementation. The business case includes:
- A detailed description of the problem or opportunity with headings such as Introduction, Business Objectives, Problem/Opportunity Statement, Assumptions, and Constraints
- A list of the alternative solutions available
- An analysis of the business benefits, costs, risks, and issues
- A description of the preferred solution
- Main project requirements
- A summarized plan for implementation that includes a schedule and financial analysis
The project sponsor then approves the business case, and the required funding is allocated to proceed with a feasibility study. It is up to the project sponsor to determine if the project is worth undertaking and whether the project will be profitable to the organization. The completion and approval of the feasibility study triggers the beginning of the planning phase. The feasibility study may also show that the project is not worth pursuing and the project is terminated; thus the next phase never begins.
All projects are created for a reason. Someone identifies a need or an opportunity and devises a project to address that need. How well the project ultimately addresses that need defines the project’s success or failure.
The success of your project depends on the clarity and accuracy of your business case and whether people believe they can achieve it. Whenever you consider past experience, your business case is more realistic; and whenever you involve other people in the business case’s development, you encourage their commitment to achieving it.
Often the pressure to get results encourages people to go right into identifying possible solutions without fully understanding the need or what the project is trying to accomplish. This strategy can create a lot of immediate activity, but it also creates significant chances for waste and mistakes if the wrong need is addressed. One of the best ways to gain approval for a project is to clearly identify the project’s objectives and describe the need or opportunity for which the project will provide a solution. For most of us, being misunderstood is a common occurrence, something that happens on a daily basis. At the restaurant, the waiter brings us our dinner and we note that the baked potato is filled with sour cream, even though we expressly requested “no sour cream.” Projects are filled with misunderstandings between customers and project staff. What the customer ordered (or more accurately what they think they ordered) is often not what they get. The cliché is “I know that’s what I said, but it’s not what I meant.” Figure 7.1 demonstrates the importance of establishing clear objectives.
The need for establishing clear project objectives cannot be overstated. An objective or goal lacks clarity if, when shown to five people, it is interpreted in multiple ways. Ideally, if an objective is clear, you can show it to five people who, after reviewing it, hold a single view about its meaning. The best way to make an objective clear is to state it in such a way that it can be verified. Building in ways to measure achievement can do this. It is important to provide quantifiable definitions to qualitative terms.
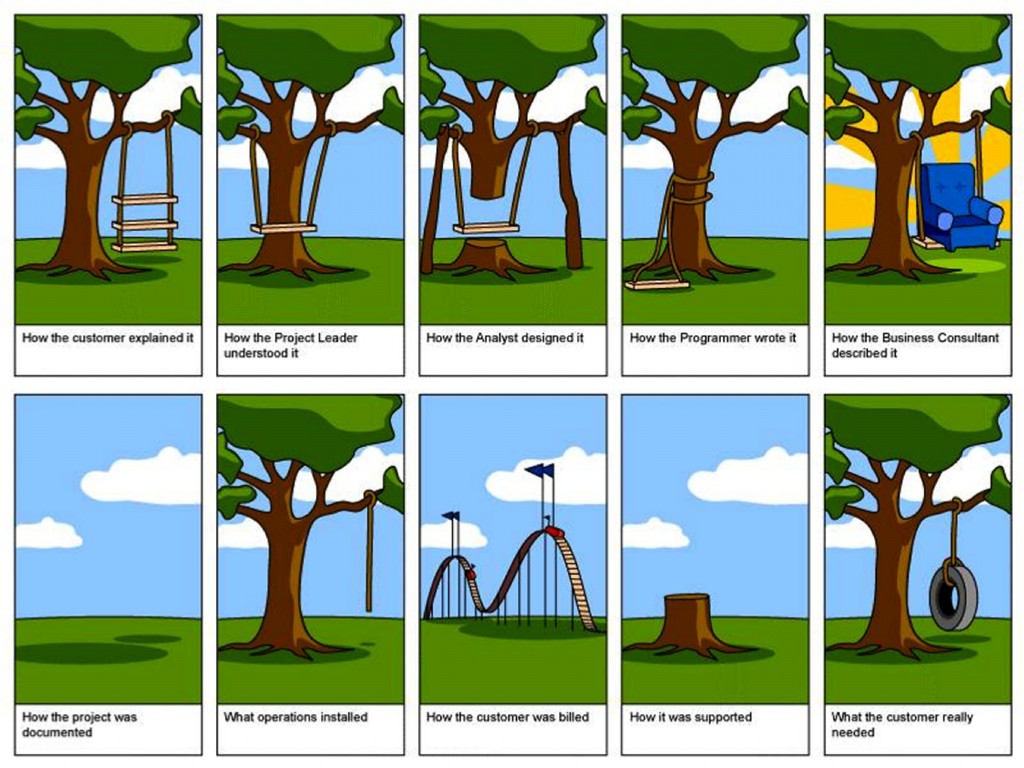 Figure 7.1 Project Management.
For example, an objective of the team principle (project manager) of a Formula 1 racing team may be that their star driver, “finish the lap as fast as possible.” That objective is filled with ambiguity.
How fast is “fast as possible?” Does that mean the fastest lap time (the time to complete one lap) or does it mean the fastest speed as the car crosses the start/finish line (that is at the finish of the lap)?
By when should the driver be able to achieve the objective? It is no use having the fastest lap after the race has finished, and equally the fastest lap does not count for qualifying and therefore starting position, if it is performed during a practice session.
The ambiguity of this objective can be seen from the following example. Ferrari’s Michael Schumacher achieved the race lap record at the Circuit de Monaco of 1 min 14.439 sec in 2004 (Figure 7.2). However, he achieved this on lap 23 of the race, but crashed on lap 44 of a 77-lap race. So while he achieved a fastest lap and therefore met the specific project goal of “finish the lap as fast as possible,” it did not result in winning the race, clearly a different project goal. In contrast, the fastest qualifying time at the same event was by Renault’s Jarno Trulli (1 min 13.985 sec), which gained him pole position for the race, which he went on to win (Figure 7.2). In his case, he achieved the specific project goal of “finish the lap as fast as possible,” but also the larger goal of winning the race.
The objective can be strengthened considerably if it is stated as follows: “To be able to finish the 3.340 km lap at the Circuit de Monaco at the Monaco Grand Prix in 1 min 14.902 sec or less, during qualifying on May 23, 2009.” This was the project objective achieved by Brawn GP’s Jenson Button (Figure 7.2).
 Figure 7.2: Despite achieving the project goal of the “finish the lap as fast as possible,” Ferrari’s Michael Schumacher crashed 21 laps later and did not finish the race (top); Renault’s Jarno Trulli celebrating his win at the 2004 Monaco Grand Prix (middle); Jenson Button took his Brawn GP car to pole position at the Monaco Grand Prix with a lap time of 1 min 14.902 sec. He also went on to win the race, even though he did not achieve that lap time during the race (bottom).
There is still some ambiguity in this objective; for example, it assumes the star driver will be driving the team’s race car and not a rental car from Hertz. However, it clarifies the team principal’s intent quite nicely. It should be noted that a clear goal is not enough. It must also be achievable. The team principal’s goal becomes unachievable, for example, if he changes it to require his star driver to finish the 3.340 km lap in 30 sec or less.
To ensure the project’s objectives are achievable and realistic, they must be determined jointly by managers and those who perform the work. Realism is introduced because the people who will do the work have a good sense of what it takes to accomplish a particular task. In addition, this process assures some level of commitment on all sides: management expresses its commitment to support the work effort and workers demonstrate their willingness to do the work.
Imagine an office manager has contracted a painter to paint his office. His goal or objective is to have the office painted a pleasing blue colour. Consider the conversation that occurs in Figure 7.3 after the job was finished.
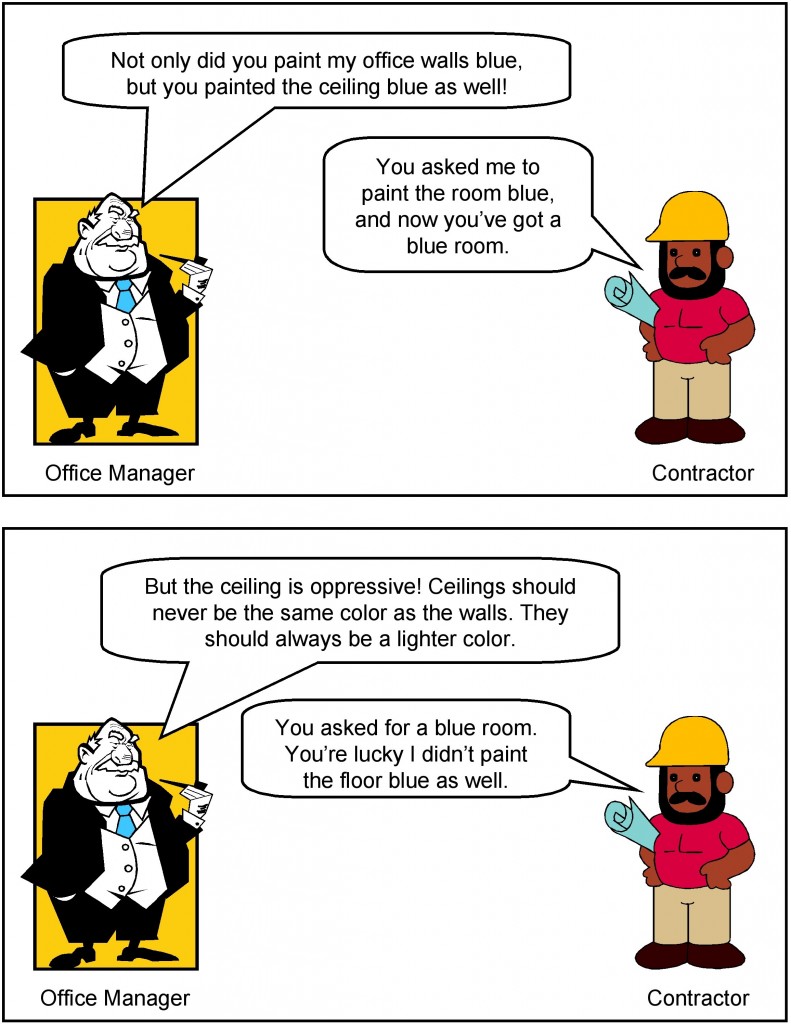 Figure 7.3: The consequence of not making your objective clear. [Image Description]
This conversation captures in a nutshell the essence of a major source of misunderstandings on projects: the importance of setting clear objectives. The office manager’s description of how he wanted the room painted meant one thing to him and another to the painter. As a consequence, the room was not painted to the office manager’s satisfaction. Had his objective been more clearly defined, he probably would have had what he wanted.
Comparing Options Using a Weighted Decision Matrix
Sometimes we have multiple options to choose from when determining requirements and deciding which project to work on. To select the best option, we can use tools such as a weighted decision matrix.
A basic decision matrix consists of establishing a set of criteria for options that are scored and summed to gain a total score that can then be ranked. Importantly, it is not weighted to allow a quick selection process.
A weighted decision matrix operates in the same way as the basic decision matrix but introduces the concept of weighting the criteria in order of importance. The resultant scores better reflect the importance to the decision maker of the criteria involved. The more important a criterion, the higher the weighting it should be given. Each of the potential options is scored and then multiplied by the weighting given to each of the criteria to produce a result.
The advantage of the weighted decision matrix is that subjective opinions about one alternative versus another can be made more objective. Another advantage of this method is that sensitivity studies can be performed. An example of this might be to see how much your opinion would have to change in order for a lower-ranked alternative to outrank a competing alternative.
A weighted decision matrix therefore allows decision makers to structure and solve their problem by:
- Specifying and prioritizing their needs with a list a criteria; then
- Evaluating, rating, and comparing the different solutions; and
- Selecting the best matching solution.
A weighted decision matrix is a decision tool used by decision makers.
A decision matrix is basically an array presenting on one axis a list of alternatives, also called options or solutions, that are evaluated regarding, on the other axis, a list of criteria, which are weighted depending on their respective importance in the final decision to be taken.
Weighted Decision Matrix Sample
The example in Figure 7.4 shows a weighted decision matrix that compared three options for a web development project (SJS Enterprises). This method is especially useful when choosing purchase alternatives and comparing them against specific desirable system requirements.
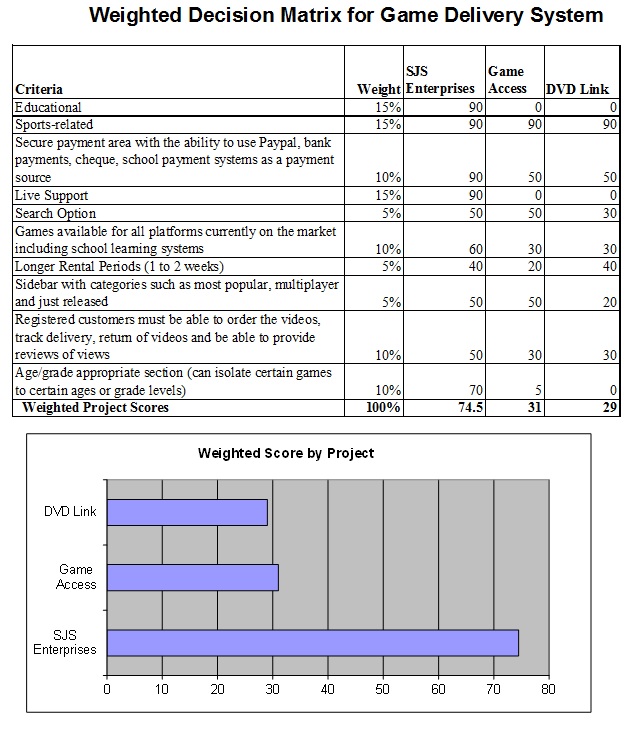 Figure 7.4: Weighted Decision Matrix for Game Delivery Project. [Image description]
Financial Considerations
In many new project endeavors, we need to find out if our project is financially feasible. We do that by using net present value (NPV), rate of return (ROI), and payback analysis.
NPV
A dollar earned today is worth more than a dollar earned one or more years from now. The NPV of a time series of cash flows, both incoming and outgoing, is defined as the sum of the present values (PVs) of the individual cash flows of the same entity.
In the case when all future cash flows are incoming and the only outflow of cash is the purchase price, the NPV is simply the PV of future cash flows minus the purchase price (which is its own PV). NPV is a standard method for using the time value of money to appraise long-term projects. Used for capital budgeting and widely used throughout economics, finance, and accounting, it measures the excess or shortfall of cash flows, in present value terms, once financing charges are met.
NPV can be described as the “difference amount” between the sums of discounted cash inflows and cash outflows. It compares the present value of money today to the present value of money in the future, taking inflation and returns into account.
The NPV of a sequence of cash flows takes as input the cash flows and a discount rate or discount curve and outputs a price.
Each cash inflow/outflow is discounted back to its present value (PV). Then they are summed. Therefore NPV is the sum of all terms.
 where
where
- t is the time of the cash flow
- i is the discount rate (the rate of return that could be earned on an investment in the financial markets with similar risk; the opportunity cost of capital)
- Rt is the net cash flow (i.e., cash inflow − cash outflow, at time t).
NPV is an indicator of how much value an investment or project adds to the firm. With a particular project, if NPV is a positive value, the project is in the status of positive cash inflow in the time t. If NPV is a negative value, the project is in the status of discounted cash outflow in the time t. Sometimes risky projects with a positive NPV could be accepted. This does not necessarily mean that they should be undertaken since NPV at the cost of capital may not account for opportunity cost (i.e., comparison with other available investments). In financial theory, if there is a choice between two mutually exclusive alternatives, the one yielding the higher NPV should be selected.
| If… | It means… | Then… |
|---|---|---|
| NPV > 0 | The investment would add value to the firm. | The project may be accepted. |
| NPV < 0 | The investment would subtract value from the firm. | The project should be rejected. |
| NPV = 0 | The investment would neither gain nor lose value for the firm. | We should be indifferent in the decision whether to accept or reject the project. This project adds no monetary value. Decision should be based on other criteria (e.g., strategic positioning or other factors not explicitly included in the calculation). |
| Periods (years) | 6% | 8% | 10% | 12% | 14% |
|---|---|---|---|---|---|
| 1 | 0.943 | 0.926 | 0.909 | 0.893 | 0.877 |
| 2 | 0.890 | 0.857 | 0.826 | 0.797 | 0.769 |
| 3 | 0.840 | 0.794 | 0.751 | 0.712 | 0.675 |
| 4 | 0.792 | 0.735 | 0.683 | 0.636 | 0.592 |
| 5 | 0.747 | 0.681 | 0.621 | 0.567 | 0.519 |
| 6 | 0.705 | 0.630 | 0.564 | 0.507 | 0.456 |
| 7 | 0.665 | 0.583 | 0.513 | 0.452 | 0.400 |
| 8 | 0.627 | 0.540 | 0.467 | 0.404 | 0.351 |
| 9 | 0.592 | 0.500 | 0.424 | 0.361 | 0.308 |
| 10 | 0.558 | 0.463 | 0.386 | 0.322 | 0.270 |
NPV Example
The following example is calculating the NPV of a project at a discount rate of 12%. The project takes five years to complete with given benefits and costs for each year. In Year 0, there is no benefit to the organization, just an initial cost of $75,000 with no discount rate. In Year 1, the discount rate is 89%. This means that at 12% assumed interest, the time value of money says that the $1 today is worth $0.89 in one year, $0.80 in two years, etc. By calculating the NPV for the benefits and the costs, you subtract the NPV of all costs from the NPV of all benefits. The final result is a positive value of $105,175.
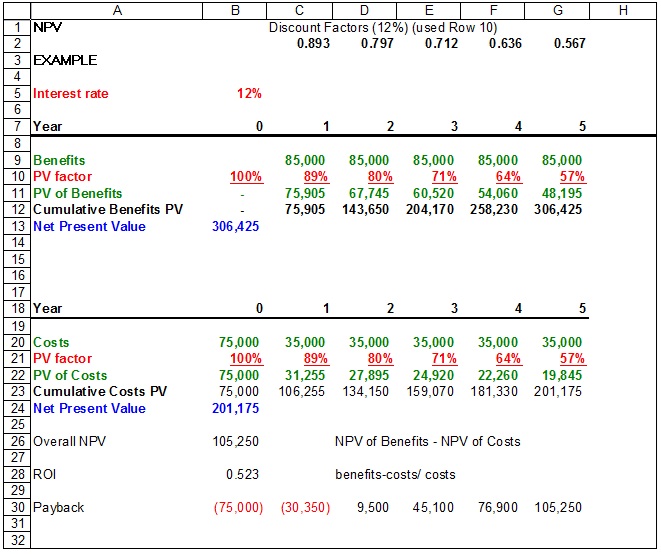 Table 7.3: Table of NPV of costs and benefits.
ROI
Return on investment (ROI) is a performance measure used to evaluate the efficiency of an investment or to compare the efficiency of a number of different investments. It is one way of considering profits in relation to capital invested.
This is calculated by subtracting the project’s costs from the benefits and then dividing by the costs. For example, if you invest $100 and your investment is worth $110 next year, the ROI is (110 − 100) ÷ 100 = 0.1 or a 10% return.
In our example: (306,425 − 201,175) ÷ 201,175 = 0.52, or a 52% return. That’s considered a nice return on investment.
Payback Analysis
Payback analysis is important in determining the amount of time it will take for a project to recoup its investments. This is the point at which the benefits start to outweigh the costs. The best way to see that is by charting the cumulative benefits and costs. As you can see in the example in Figure 7.5, the cumulative benefits outweigh the cumulative costs in the second year.
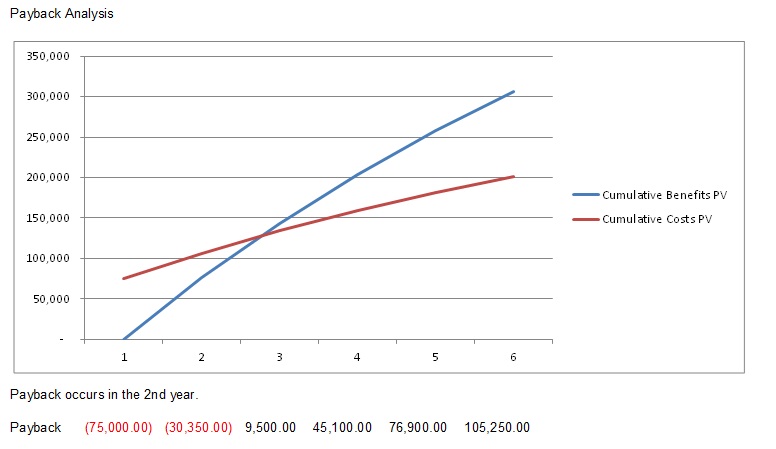 Figure 7.5: Payback Analysis Chart
Project Charter
A project charter, project definition, or project statement is a statement of the scope, objectives, and participants in a project. It provides a preliminary delineation of roles and responsibilities, outlines the project objectives, identifies the main stakeholders, and defines the authority of the project manager. It serves as a reference of authority for the future of the project.
The purpose of a project charter is to:
- Provide an understanding of the project, the reason it is being conducted, and its justification
- Establish early on in the project the general scope
- Establish the project manager and his or her authority level. A note of who will review and approve the project charter must be included.
Example of a Project Charter
Sample Project Charter
Identification Section
List the project name, the date of the current version of the project charter, the sponsor’s name and authority, and the project manager’s name.
Example:
Project Name: Rice University Computer Store Creation
Project Sponsor: Jane Ungam, Facilities Manager
Date: Jan 12, 2010
Revision: 1
Project Manager: Fred Rubens
Overview of the Project
Provide a simple but precise statement of the project.
Example: Rice University is planning to create a store to sell computer supplies.
Objective
State the objectives of the project clearly and ensure they contain a measure of how to assess whether they have been achieved. The statement should be realistic and should follow the SMART protocol:
- Specific (get into the details)
- Measurable (use quantitative language so that you know when you are finished)
- Acceptable (to stakeholders)
- Realistic (given project constraints)
- Time based (deadlines, not durations)
Example: The objective of this project is to implement a campus store that is ready to sell computer supplies such as memory sticks, mouse pads, and cables, when class starts in August 2010, with enough inventory to last through the first two weeks of classes.
Scope
Specify the scope of the project by identifying the domain or range of requirements.
Example: The scope of Rice’s school supplies store project includes the activities listed below:
- Determine what supplies will be sold in the store.
- Establish competitive prices for the computer supplies.
- Source and secure supply vendors.
- Establish marketing, procurement, operations, and any other necessary departments, schools, centres, and institutes.
It is equally important to include in the scope what is not included in the project.
Example: The scope of the project does not include:
- Development of any other school store departments
- Store design or construction
Major Milestones
List all major milestones needed to ensure successful project completion.
Example:
- All vendors selected
- Contracts or orders completed with all vendors
- Supplies delivered to the store
- Pricing determined
Major Deliverables
List and describe the major deliverables that will result from the project.
Example:
- Supplies procured
- Operations, procurement, marketing, and other teams established
- Store supplies stocked and displayed
- Store staffing completed, including work schedules
- Store operations policies, including hours of operation, established
Assumptions
Outline the assumptions made in creating the project. An assumption is a fact you are unsure of but can either confirm at a later time or are simply stating so that the project can proceed as if the statement were true.
Example:
- Only computer supplies will be sold in the store.
- Customers will be the Rice University student body and faculty.
- Rice University students will manage the project and be responsible for ongoing operations.
- A store sponsor from the university faculty or staff will be assigned to mentor students and provide oversight.
- Store hours of operation will be approved by the Rice University students or store sponsor.
- Supplier deliveries will be arranged or the store sponsor will pick them up with students.
- Students will be empowered to contact vendors for order placement and inquiries via telephone.
Constraints
Define any and all constraints on the project or those working on the project. This is an important part of the project charter. A constraint is anything that limits the range of solutions or approaches.
Example:
- Student availability to meet for project planning is limited to school hours.
- Software is not available for project planning and control.
Business Need or Opportunity (Benefits)
Provide a concise statement of the business need or opportunity that led to the creation of the project. Why was it created? What are the benefits? How does the project contribute to organizational objectives?
Example: The goal of this project is to provide income for the Rice Student Centre while supplying necessary items to students and faculty at competitive prices. The school store will be a convenience to students since necessary supplies will be available on campus. This will help students learn to manage their personal supplies.
Preliminary Cost for the Project
Provide a statement indicating how the cost of the project will be defined and controlled.
Example: The procurement team will assemble a proposal based on expected costs for review by the Dean of Undergraduate Studies.
Project Risks
A risk is anything uncertain that may occur that will reduce or decrease the chances of project success.
Example:
- There is a state election coming and the new government may change the taxation rules for private university retail outlets.
- The cloud is changing student demand for media such as flash drives in somewhat unpredictable ways. If this happens faster than we forecast, we may be building a store that students don’t need.
- Deliveries of store shelves, etc. will be delayed if a major hurricane occurs.
Project Charter Acceptance
Provide the names, titles, and signature lines of the individuals who will sign off on the project charter.
Project Stakeholders
Provide the key stakeholders and team members by function, name, and role.
| Function | Name | Role |
|---|---|---|
| Project Manager | Monica Styles | Leads the project |
| Sponsor | Adrienne Watt | Project sponsor |
| etc. |
Image Descriptions
Figure 7.3 image description: A conversation between an office manager and a contractor.
Office manager: Not only did you paint my office walls blue, but you painted the ceiling blue as well.
Contractor: You asked me to paint the room blue, and now you’ve got a blue room.
Office manager: But the ceiling is oppressive! Ceilings should never be the same colour as the walls. They should always be a lighter colour.
Contractor: You asked for a blue room. You’re lucky I didn’t paint the floor blue as well.
| Criteria | Weight | SJS Enterprises | Game Access | DVD Link |
|---|---|---|---|---|
| Educational | 15% | 90 | 0 | 0 |
| Sports-related | 15% | 90 | 90 | 90 |
| Secure payment area with the ability to use Payplay, bank payments, cheques, and school payment systems as a payment source. | 10% | 90 | 50 | 50 |
| Live Support | 15% | 90 | 0 | 0 |
| Search Option | 5% | 50 | 50 | 30 |
| Games available for all platforms currently on the market including school learning systems. | 10% | 60 | 30 | 30 |
| Longer rental periods (1 to 2 weeks) | 5% | 40 | 20 | 40 |
| Sidebar with categories, such as most popular, multiplayer, and just released. | 5% | 50 | 50 | 20 |
| Registered customers must be able to order the videos, track delivery, return videos, and be able to provide reviews of views. | 10% | 50 | 30 | 30 |
| Age/grade appropriate section (can isolate certain games to certain ages or grade levels) | 10% | 70 | 5 | 0 |
| Weighted project scores: | 100% | 75.4 | 31 | 29 |
Text Attributions
This chapter of Project Management is a derivative of the following works:
- Project Management by Merrie Barron and Andrew Barron. © CC BY (Attribution).
- Decision Matrix Method, Project Charter, and Net Present Value by Wikipedia. © CC BY-SA (Attribution-ShareAlike).
Media Attributions
- Project Management by Andreas Cappell © CC BY-NC-SA (Attribution NonCommercial ShareAlike)
- Figure 7.2 by Cord Rodefeld (top), ph-stop (middle), Evoflash (bottom) © CC BY-SA (Attribution ShareAlike)
- Unclear Objective Comic by Barron & Barron Project Management for Scientists and Engineers © CC BY (Attribution)
- Weighted Decision Matrix for Game Delivery by Adrienne Watt © CC BY (Attribution)
- NPV Example by Adrienne Watt © CC BY (Attribution)
- Payback Analysis Chart by Adrienne Watt © CC BY (Attribution)