
16.4: Summary


- Last updated
- Mar 5, 2021
- Save as PDF

( \newcommand{\kernel}{\mathrm{null}\,}\)
This chapter discusses the modeling and analysis of a package transfer hub. Specifically techniques for modeling conveyor systems have been presented. The choice between alternative resources for performing an operation has been illustrated. Ergonomic considerations have been included in the model. The number of workers to serve a loading operation was determined.
| Worker Serves Three Lanes | Worker Serves Two Lanes Plus a Shared Lane | ||||
| Replicate | Average Package Waiting Time | Average Worker Utilization | Average Package Waiting Time Non-Shared Lanes | Average Package Waiting Time Shared Lanes | Average Worker Utilization |
| 1 | 10.7 | 0.843 | 5.3 | 5.0 | 0.664 |
| 2 | 9.8 | 0.832 | 4.9 | 4.2 | 0.650 |
| 3 | 10.3 | 0.839 | 5.1 | 3.8 | 0.661 |
| 4 | 10.8 | 0.845 | 5.2 | 4.5 | 0.669 |
| 5 | 10.4 | 0.845 | 5.3 | 4.4 | 0.661 |
| 6 | 10.4 | 0.842 | 5.3 | 4.4 | 0.660 |
| 7 | 10.4 | 0.837 | 5.1 | 4.1 | 0.659 |
| 8 | 10.1 | 0.839 | 5.2 | 4.3 | 0.659 |
| 9 | 10.3 | 0.844 | 5.2 | 4.1 | 0.669 |
| 10 | 10.6 | 0.855 | 5.2 | 4.2 | 0.671 |
| 11 | 10.2 | 0.841 | 5.2 | 4.2 | 0.663 |
| 12 | 9.9 | 0.835 | 5.2 | 4.2 | 0.658 |
| 13 | 10.4 | 0.844 | 5.4 | 4.5 | 0.666 |
| 14 | 11.3 | 0.870 | 5.7 | 4.8 | 0.683 |
| 15 | 10.8 | 0.853 | 5.5 | 4.3 | 0.670 |
| 16 | 10.3 | 0.843 | 5.5 | 4.7 | 0.662 |
| 17 | 10.7 | 0.852 | 5.2 | 4.1 | 0.670 |
| 18 | 11.4 | 0.858 | 5.7 | 4.7 | 0.670 |
| 19 | 10.7 | 0.849 | 5.2 | 4.2 | 0.667 |
| 20 | 10.3 | 0.836 | 5.2 | 4.2 | 0.657 |
| Average | 10.5 | 0.845 | 5.3 | 4.3 | 0.664 |
| Std. Dev. | 0.398 | 0.00903 | 0.193 | 0.284 | 0.00702 |
| 99% CI Lower Bound | 10.2 | 0.839 | 5.1 | 4.2 | 0.660 |
| 99% CI Upper Bound | 10.7 | 0.851 | 5.4 | 4.5 | 0.669 |
Problems
- Explain how sampling from the continuous uniform distribution with minimum 1 and maximum 21 gives equal probability to the integers 1 through 20 and no probability to the integer 21 when samples from truncated to integer values.
- Why is the time between the arrival of a package to the secondary sorter and completion of loading on a truck not a good performance measure? Supply an improved definition for this performance measure.
- Develop a model for a lane served by either of two workers.
- Perform a formal statistical analysis using paired confidence intervals and the data in Table 16-3 to confirm that package waiting time is less in the workers share lanes case than in the case where a worker serves 3 lanes.
- Compare average package waiting time with each worker serving 3 lanes (2nd column) with the average waiting time for lanes served by only one worker, the non-shared lanes (4th column).
- Compare average package waiting time in the shared lines (5th column) and the non-shared lanes (4th column).
- Explain why the average waiting time for packages for a shared lane served by two workers (5th column) is less than for lanes served by one worker (4th column) as seen in Table 16-3.
- Perform a formal statistical analysis using paired confidence intervals and the data in Tables 16-2 and 16-3 to compare the average package waiting time between the worker serves two lanes scenario (2nd column) and the shared lanes scenario (5th column).
- Explain why average package waiting time increases in a non-linear fashion as the utilization of the workers increases.
- Go to a manufacturing lab, transfer hub, or a local manufacturing plant to observe a conveyor system in operation. List the number of different conveyor types found.
- Embellish the model to make package loading time a function of how many packages are on a truck. Assume 8 seconds is the mean time to load the package in the center of the truck and each truck holds 200 packages. The mean loading time varies linearly from 12 seconds for a completely empty truck to 4 seconds for the last package on a truck. After the 200th package is loaded on a truck, the fully loaded truck swaps positions with an empty truck in 3 minutes. No package loading can occur during this time. Determine the number of workers needed under these conditions.
- Suppose that packages are not uniformly distributed across final destinations but the distribution by destination is shown in the following table. Use simulation to assign the package destinations to lanes as well as workers to lanes. The destinations may be assigned to lanes in any way that is helpful.
Package Destination Percent of Packages Package Destination Percent of Packages 1 0.48% 11 5.24% 2 0.95% 12 5.71% 3 1.43% 13 6.19% 4 1.90% 14 6.67% 5 2.38% 15 7.14% 6 2.86% 16 7.62% 7 3.33% 17 8.10% 8 3.81% 18 8.57% 9 4.29% 19 9.05% 10 4.76% 20 9.52%
Case Study
Some packages that pass through a primary sorter cannot be routed to a secondary sorter for a variety of reasons and must be manually processed. Suppose such packages are routed to a circular conveyor as shown in Figure 16-4. Packages proceed around the conveyor to a workstation. There is no package waiting area or buffer at a workstation. If a package arrives to a station that is processing another package, it stays on the conveyor to the next station. If the package is not processed by the last station, it recirculates to the first station.
Figure 16-4: circular Conveyor System
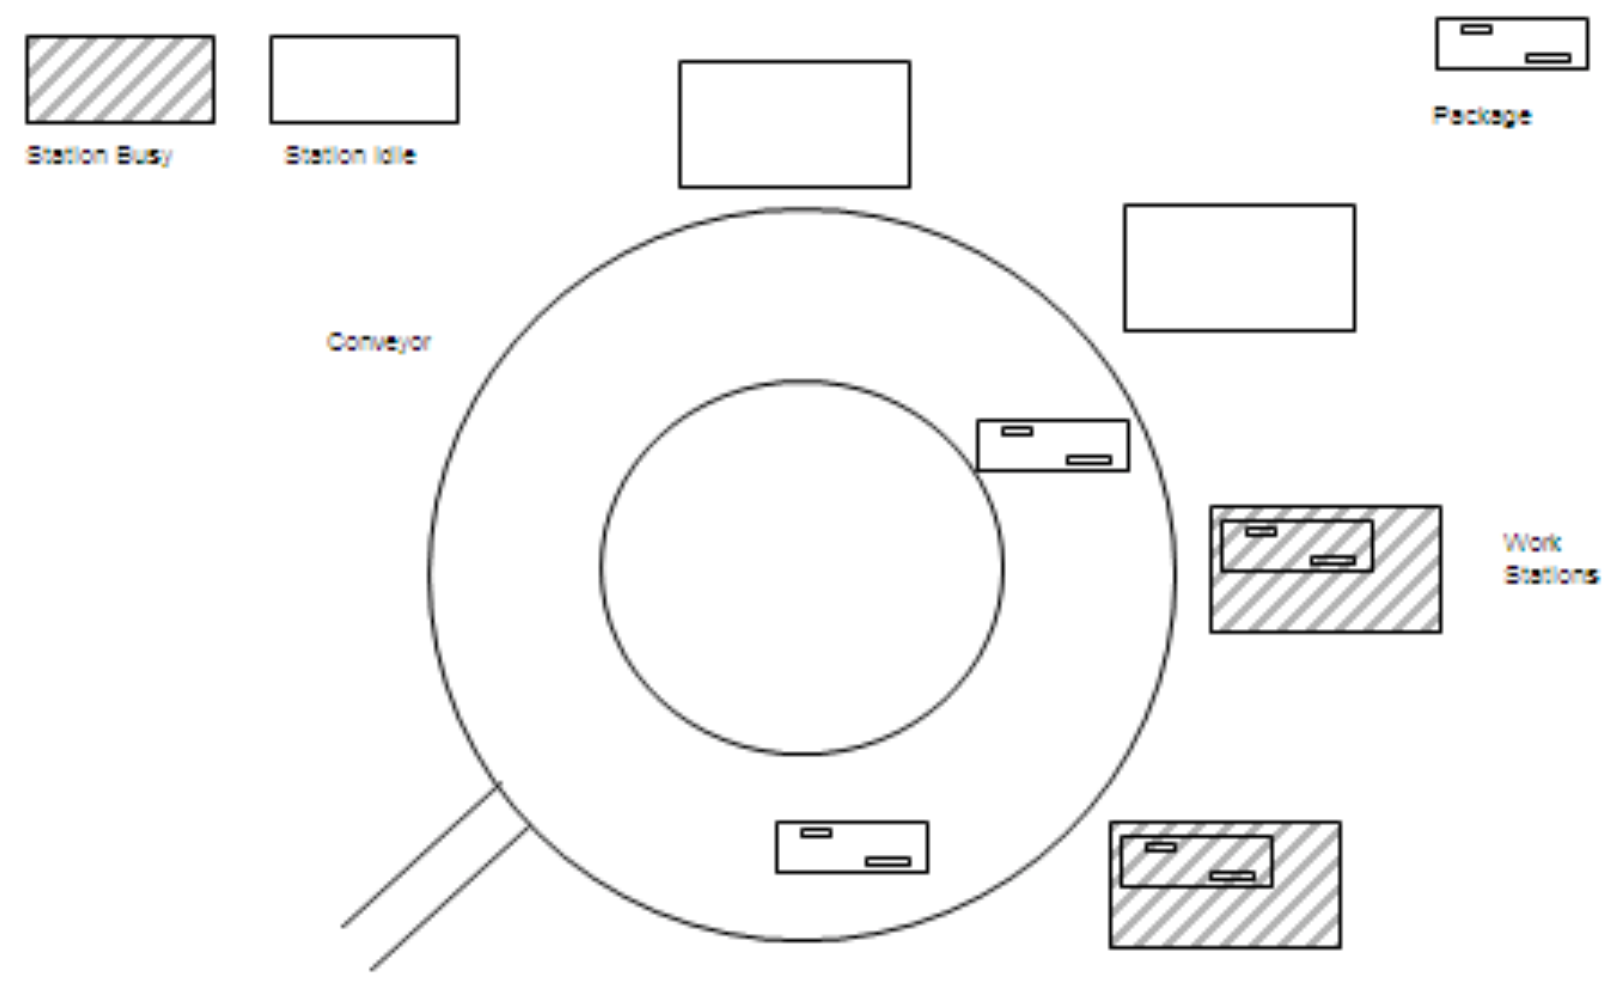
The purpose of the simulation study is to specify the parameters of the manual system to minimize package lead time. There may be either 1, 2, 3, or 4 workstatons employed. In addition, waiting areas for up to three packages may be placed in any fashion among the workstations. Cost considerations make more buffer spaces and fewer workstations the preferred design. Determine the number of workstations, the number of buffer spaces, and the location of the buffer spaces.
Relevant information is as follows:
Time between package arrivals: Exponentially distributed with mean 1.6 minutes.
Package processing time: Exponentially distributed with mean 4.0 minutes.
| Conveyor Segment | Conveyor Distance (Feet) |
| Arrival Point to First Work Station Exit | 18 |
| Station Exit Segment | 2 |
| Inter-Station Segment (to Exit Segment) | 13 |
| Last Station to Arrival Point (4 stations case) | 45 |
Assume that conveyor speed is 0.25 feet / second and that packages are 2 feet in length. The time period of interest is 40 hours.
Case Problem Issues
- Count the number of possible alternatives. Is it reasonable to simulate all of these?
- Which alternatives should be simulated to make sure the best or at least a good alternative is identified?
- What performance measures in addition to package lead time are of interest?
- What operating rules could be added to the system to guard against excessive lead times for individual packages?
- What is the minimum number of workstations required by the system?
- Discuss how verification and validation evidence can be obtained.
- What is the purpose of having buffer space in front of workstation?
- How is the arrival of a package to a workstation modeled if:
- There is no buffer space at the workstation.
- There is at least one buffer space at the workstation.
- What is your initial guess as to the best placement for the buffer spaces? Does the simulation study confirm your guess?
- Tell how to compute the lead time for a package as a function of the number times it travels completely around the conveyor within the simulation.
- What is the radius of the conveyor: radius = circumference / 2 π?