4.5: Sensitivity and Robustness
- Page ID
- 24406

Sensitivity and Robustness
The robustness refers to the ability of a control system to withstand parameter variations in the plant transfer function, and still maintain the stability and performance goals.
Robustness is characterized in terms of the sensitivity of the closed-loop transfer function \(T(s)\) to variation in one or more of the plant parameters.
System Sensitivity Function
The system sensitivity function is defined as the ratio of percentage change in the closed-loop transfer function to percentage change in the plant transfer function, i.e., assuming unity feedback (\(H(s)=1\)),
\[S_{G}^{T} =\frac{\partial T/T}{\partial G/G} =\frac{\partial T}{\partial G} \frac{G}{T} =\frac{1}{1+KG(s)} \nonumber \]
Hence, increasing loop gain in a feedback control system by choosing a larger controller gain, \(K\), reduces its sensitivity to parameter variations.
It may be noted that the system sensitivity function, denoted as \(S(s)\), is the same as the transfer function from the error, \(e(s)\), to output, \(y(s)\). The sensitivity function is, thus, a function of frequency. Further, \(S(s)+T(s)=1\), where \(T(s)\) denotes the closed-loop transfer function.
Parameter Sensitivity
The sensitivity of the closed-loop transfer function, \(T(s)\), to percentage change in a plant parameter, \(\alpha\), is given as:
\[S_{\alpha }^{T} =S_{G}^{T} S_{\alpha }^{G} \nonumber \]
Let \(KG(s)=\frac{K}{s(s+a)} ,\; \, \, H(s)=1\); then, we have: \(T(s)=\frac{K}{s(s+a)+K}\).
For unity-gain feedback, the system sensitivity function is computed as: \(S_{G}^{T} =\frac{s(s+a)}{s(s+a)+K}\).
Further, \( S_{a}^{G} =-\frac{a}{s+a} \); hence \( S_{a}^{T} =-\frac{as}{s(s+a)+K} \).
Thus, increasing the loop gain (by choosing a large \(K\)) reduces the sensitivity of \(T(s)\) to variations in \(a\). However, increasing \(K\) reduces damping in the system and gives rise to output oscillations.
The model of a small DC motor is approximated as: \(G(s)=\frac{k_{t} }{(Js+b)(Ls+R)+k_{t} k_{b} } =\frac{500}{s^{2} +110s+1025}\).
For unity-gain feedback, the system sensitivity function is computed as:
\[S_{G}^{T} =\frac{1}{1+KG(s)}=\frac{s^2+110s+1025}{s^2+110s+500K+1025} \nonumber \]
For \(K=10\), we have \(S_{G}^{T}=\frac{s^2+110s+1025}{s^2+110s+6025}\).
Suppose we want to compute the sensitivity of \(T\left(s\right)\) to motor torque constant, \(k_t\); then
\[S^G_{k_t}=\frac{s^2+110s+1000}{s^2+110s+1000+500k_t} \nonumber \]
For \(k_t=0.05\), we obtain \(S^G_{k_t}=\frac{s^2+110s+1000}{s^2+110s+1025}\), and hence
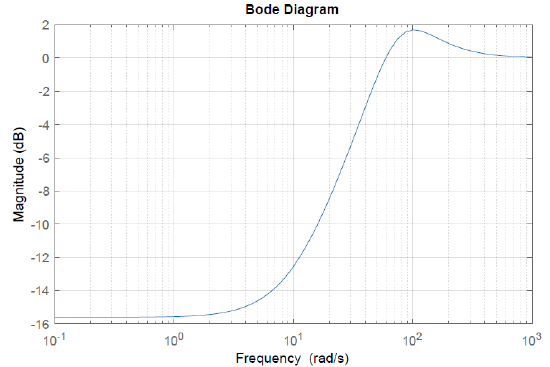
\[S^T_{k_t}=S^G_{k_t}\,S_G^T=\frac{s^2+110s+1000}{s^2+110s+6025} \nonumber \]
A Bode magnitude plot of the sensitivity function is shown in Fig. 4.5.1.