
9.1.3.2: Flowcharts
- Page ID
- 75284
\( \newcommand{\vecs}[1]{\overset { \scriptstyle \rightharpoonup} {\mathbf{#1}} } \)
\( \newcommand{\vecd}[1]{\overset{-\!-\!\rightharpoonup}{\vphantom{a}\smash {#1}}} \)
\( \newcommand{\dsum}{\displaystyle\sum\limits} \)
\( \newcommand{\dint}{\displaystyle\int\limits} \)
\( \newcommand{\dlim}{\displaystyle\lim\limits} \)
\( \newcommand{\id}{\mathrm{id}}\) \( \newcommand{\Span}{\mathrm{span}}\)
( \newcommand{\kernel}{\mathrm{null}\,}\) \( \newcommand{\range}{\mathrm{range}\,}\)
\( \newcommand{\RealPart}{\mathrm{Re}}\) \( \newcommand{\ImaginaryPart}{\mathrm{Im}}\)
\( \newcommand{\Argument}{\mathrm{Arg}}\) \( \newcommand{\norm}[1]{\| #1 \|}\)
\( \newcommand{\inner}[2]{\langle #1, #2 \rangle}\)
\( \newcommand{\Span}{\mathrm{span}}\)
\( \newcommand{\id}{\mathrm{id}}\)
\( \newcommand{\Span}{\mathrm{span}}\)
\( \newcommand{\kernel}{\mathrm{null}\,}\)
\( \newcommand{\range}{\mathrm{range}\,}\)
\( \newcommand{\RealPart}{\mathrm{Re}}\)
\( \newcommand{\ImaginaryPart}{\mathrm{Im}}\)
\( \newcommand{\Argument}{\mathrm{Arg}}\)
\( \newcommand{\norm}[1]{\| #1 \|}\)
\( \newcommand{\inner}[2]{\langle #1, #2 \rangle}\)
\( \newcommand{\Span}{\mathrm{span}}\) \( \newcommand{\AA}{\unicode[.8,0]{x212B}}\)
\( \newcommand{\vectorA}[1]{\vec{#1}} % arrow\)
\( \newcommand{\vectorAt}[1]{\vec{\text{#1}}} % arrow\)
\( \newcommand{\vectorB}[1]{\overset { \scriptstyle \rightharpoonup} {\mathbf{#1}} } \)
\( \newcommand{\vectorC}[1]{\textbf{#1}} \)
\( \newcommand{\vectorD}[1]{\overrightarrow{#1}} \)
\( \newcommand{\vectorDt}[1]{\overrightarrow{\text{#1}}} \)
\( \newcommand{\vectE}[1]{\overset{-\!-\!\rightharpoonup}{\vphantom{a}\smash{\mathbf {#1}}}} \)
\( \newcommand{\vecs}[1]{\overset { \scriptstyle \rightharpoonup} {\mathbf{#1}} } \)
\(\newcommand{\longvect}{\overrightarrow}\)
\( \newcommand{\vecd}[1]{\overset{-\!-\!\rightharpoonup}{\vphantom{a}\smash {#1}}} \)
\(\newcommand{\avec}{\mathbf a}\) \(\newcommand{\bvec}{\mathbf b}\) \(\newcommand{\cvec}{\mathbf c}\) \(\newcommand{\dvec}{\mathbf d}\) \(\newcommand{\dtil}{\widetilde{\mathbf d}}\) \(\newcommand{\evec}{\mathbf e}\) \(\newcommand{\fvec}{\mathbf f}\) \(\newcommand{\nvec}{\mathbf n}\) \(\newcommand{\pvec}{\mathbf p}\) \(\newcommand{\qvec}{\mathbf q}\) \(\newcommand{\svec}{\mathbf s}\) \(\newcommand{\tvec}{\mathbf t}\) \(\newcommand{\uvec}{\mathbf u}\) \(\newcommand{\vvec}{\mathbf v}\) \(\newcommand{\wvec}{\mathbf w}\) \(\newcommand{\xvec}{\mathbf x}\) \(\newcommand{\yvec}{\mathbf y}\) \(\newcommand{\zvec}{\mathbf z}\) \(\newcommand{\rvec}{\mathbf r}\) \(\newcommand{\mvec}{\mathbf m}\) \(\newcommand{\zerovec}{\mathbf 0}\) \(\newcommand{\onevec}{\mathbf 1}\) \(\newcommand{\real}{\mathbb R}\) \(\newcommand{\twovec}[2]{\left[\begin{array}{r}#1 \\ #2 \end{array}\right]}\) \(\newcommand{\ctwovec}[2]{\left[\begin{array}{c}#1 \\ #2 \end{array}\right]}\) \(\newcommand{\threevec}[3]{\left[\begin{array}{r}#1 \\ #2 \\ #3 \end{array}\right]}\) \(\newcommand{\cthreevec}[3]{\left[\begin{array}{c}#1 \\ #2 \\ #3 \end{array}\right]}\) \(\newcommand{\fourvec}[4]{\left[\begin{array}{r}#1 \\ #2 \\ #3 \\ #4 \end{array}\right]}\) \(\newcommand{\cfourvec}[4]{\left[\begin{array}{c}#1 \\ #2 \\ #3 \\ #4 \end{array}\right]}\) \(\newcommand{\fivevec}[5]{\left[\begin{array}{r}#1 \\ #2 \\ #3 \\ #4 \\ #5 \\ \end{array}\right]}\) \(\newcommand{\cfivevec}[5]{\left[\begin{array}{c}#1 \\ #2 \\ #3 \\ #4 \\ #5 \\ \end{array}\right]}\) \(\newcommand{\mattwo}[4]{\left[\begin{array}{rr}#1 \amp #2 \\ #3 \amp #4 \\ \end{array}\right]}\) \(\newcommand{\laspan}[1]{\text{Span}\{#1\}}\) \(\newcommand{\bcal}{\cal B}\) \(\newcommand{\ccal}{\cal C}\) \(\newcommand{\scal}{\cal S}\) \(\newcommand{\wcal}{\cal W}\) \(\newcommand{\ecal}{\cal E}\) \(\newcommand{\coords}[2]{\left\{#1\right\}_{#2}}\) \(\newcommand{\gray}[1]{\color{gray}{#1}}\) \(\newcommand{\lgray}[1]{\color{lightgray}{#1}}\) \(\newcommand{\rank}{\operatorname{rank}}\) \(\newcommand{\row}{\text{Row}}\) \(\newcommand{\col}{\text{Col}}\) \(\renewcommand{\row}{\text{Row}}\) \(\newcommand{\nul}{\text{Nul}}\) \(\newcommand{\var}{\text{Var}}\) \(\newcommand{\corr}{\text{corr}}\) \(\newcommand{\len}[1]{\left|#1\right|}\) \(\newcommand{\bbar}{\overline{\bvec}}\) \(\newcommand{\bhat}{\widehat{\bvec}}\) \(\newcommand{\bperp}{\bvec^\perp}\) \(\newcommand{\xhat}{\widehat{\xvec}}\) \(\newcommand{\vhat}{\widehat{\vvec}}\) \(\newcommand{\uhat}{\widehat{\uvec}}\) \(\newcommand{\what}{\widehat{\wvec}}\) \(\newcommand{\Sighat}{\widehat{\Sigma}}\) \(\newcommand{\lt}{<}\) \(\newcommand{\gt}{>}\) \(\newcommand{\amp}{&}\) \(\definecolor{fillinmathshade}{gray}{0.9}\)Overview
A flowchart is a type of diagram that represents an algorithm, workflow or process. The flowchart shows the steps as boxes of various kinds, and their order by connecting the boxes with arrows. This diagrammatic representation illustrates a solution model to a given problem. Flowcharts are used in analyzing, designing, documenting or managing a process or program in various fields.[1]
Discussion
Common flowcharting symbols and examples follow. When first reading this section, focus on the simple symbols and examples. Return to this section in later chapters to review the advanced symbols and examples.
Simple Flowcharting Symbols
Terminal
The rounded rectangles, or terminal points, indicate the flowchart’s starting and ending points.

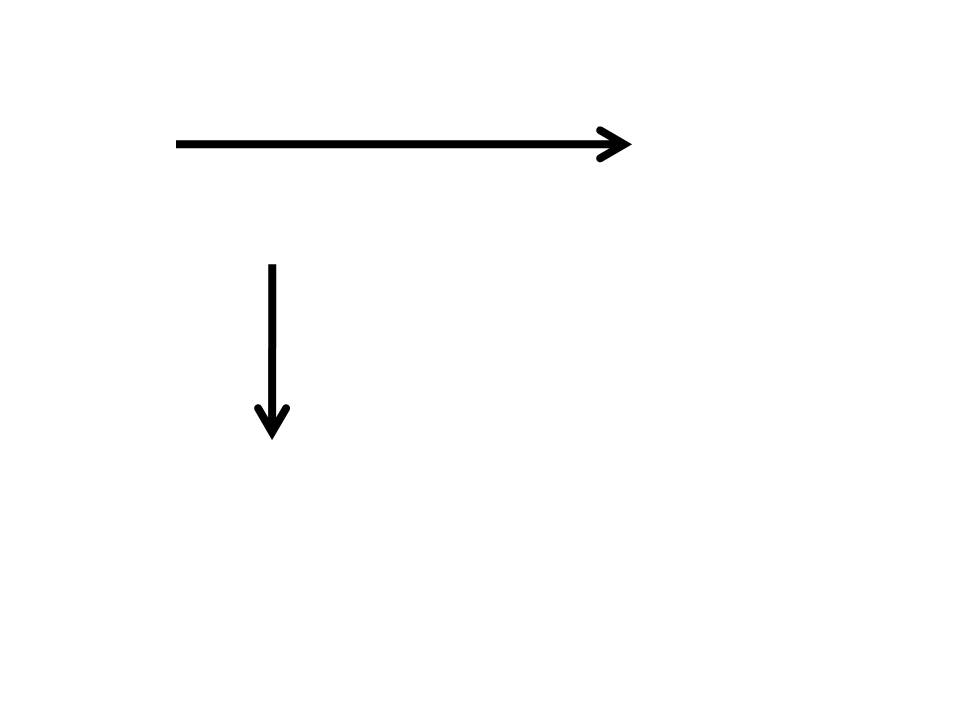
Flow Lines
Note: The default flow is left to right and top to bottom (the same way you read English). To save time arrowheads are often only drawn when the flow lines go contrary the normal.
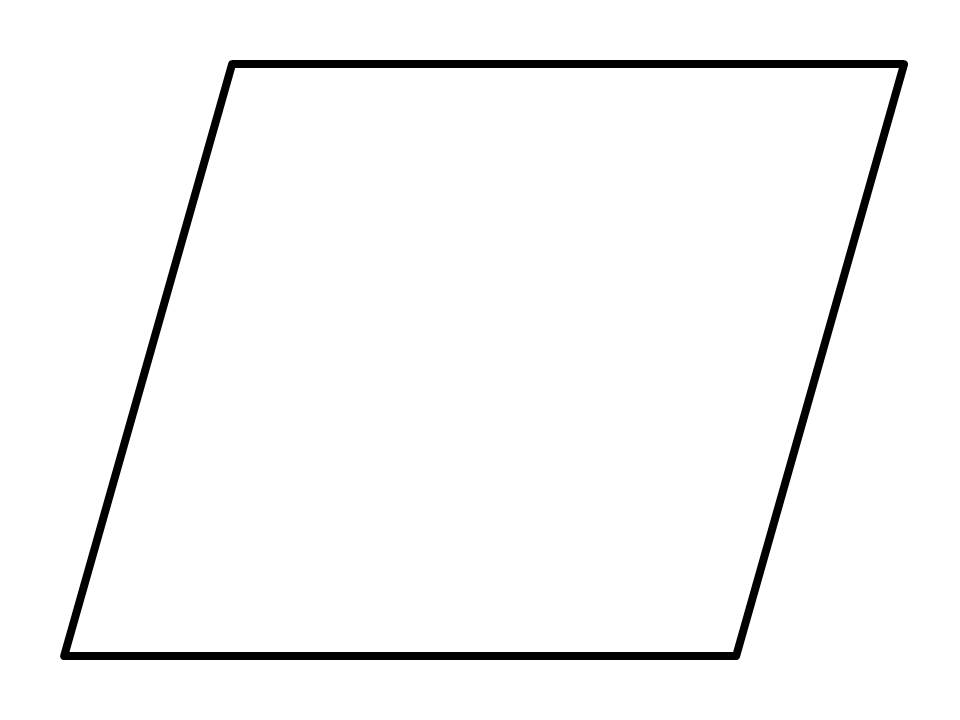
Input/Output
The parallelograms designate input or output operations.
Process
The rectangle depicts a process such as a mathematical computation, or a variable assignment.

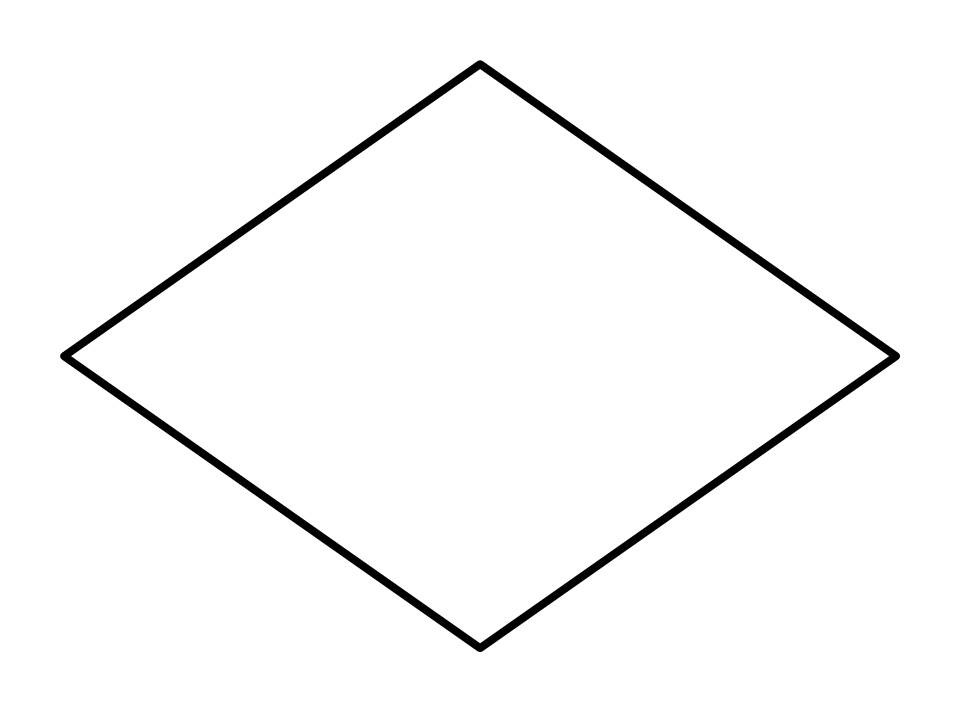
Decision
The diamond is used to represent the true/false statement being tested in a decision symbol.
Advanced Flowcharting Symbols
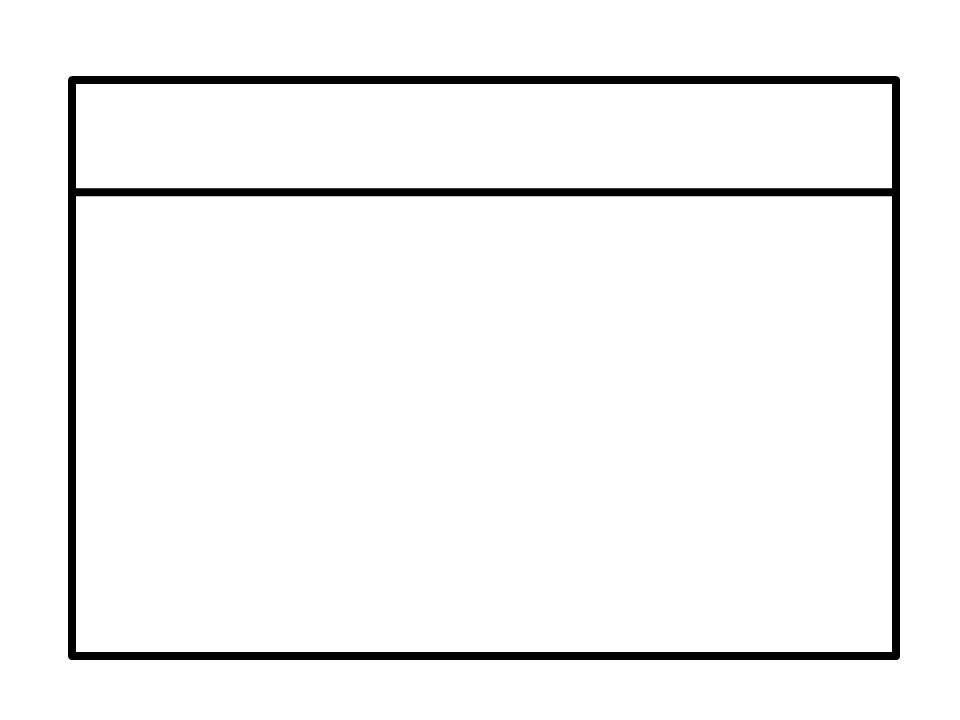
Module Call
A program module is represented in a flowchart by rectangle with some lines to distinguish it from process symbol. Often programmers will make a distinction between program control and specific task modules as shown below.
Local module: usually a program control function.
Library module: usually a specific task function.

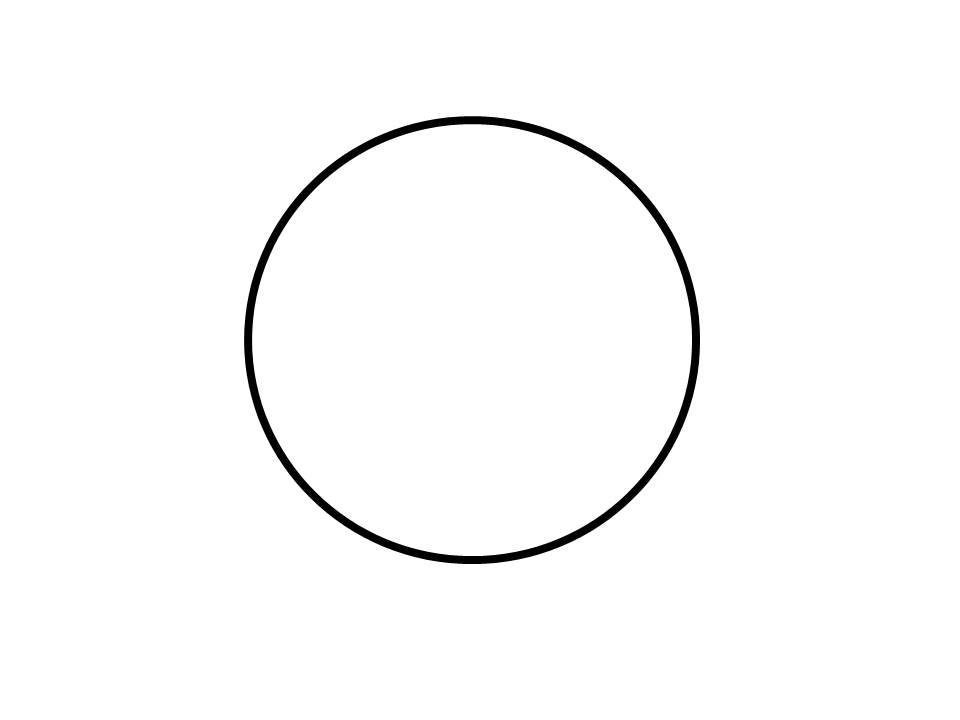
Connectors
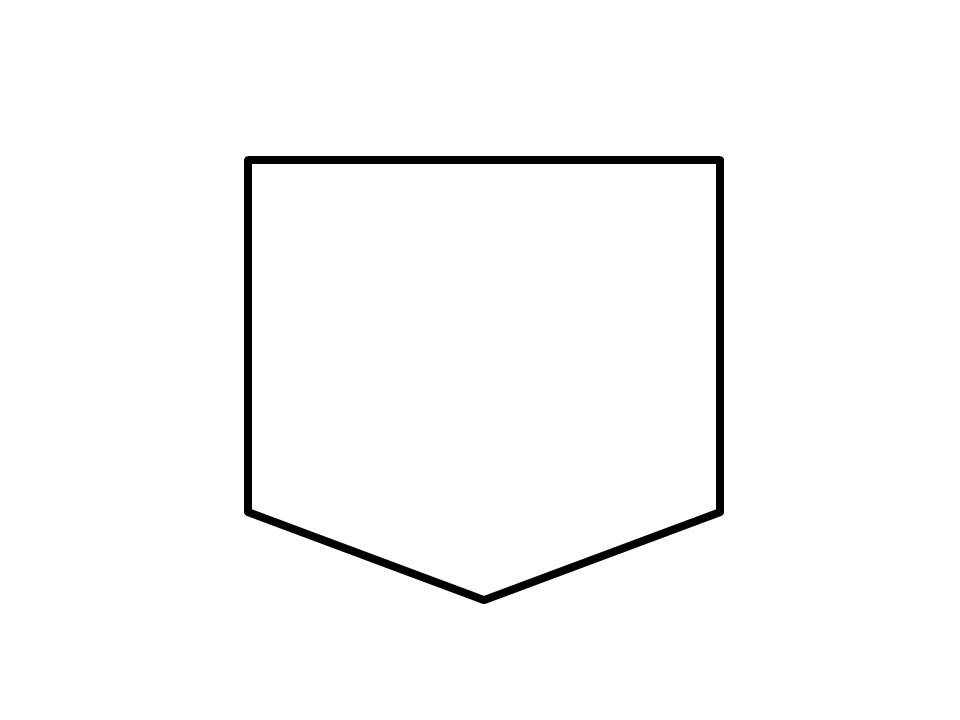
Sometimes a flowchart is broken into two or more smaller flowcharts. This is usually done when a flowchart does not fit on a single page, or must be divided into sections. A connector symbol, which is a small circle with a letter or number inside it, allows you to connect two flowcharts on the same page. A connector symbol that looks like a pocket on a shirt, allows you to connect to a flowchart on a different page.
On-Page Connector
Off-Page Connector
Simple Examples
We will demonstrate various flowcharting items by showing the flowchart for some pseudocode.
Functions
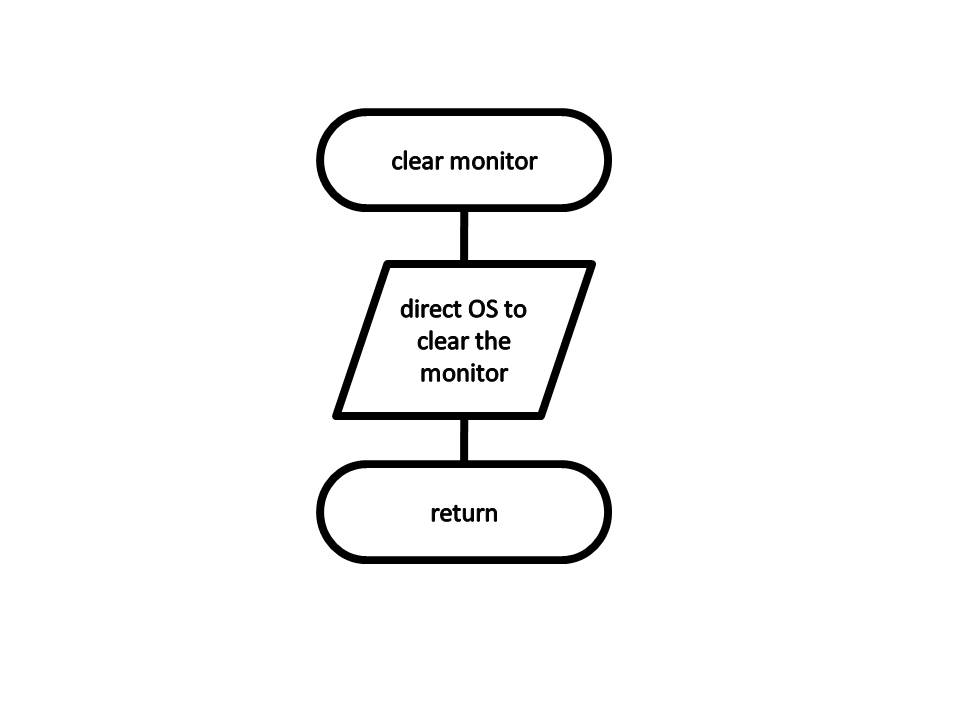
pseudocode: Function with no parameter passing
Function clear monitor
    Pass In: nothing
    Direct the operating system to clear the monitor
    Pass Out: nothing
End function
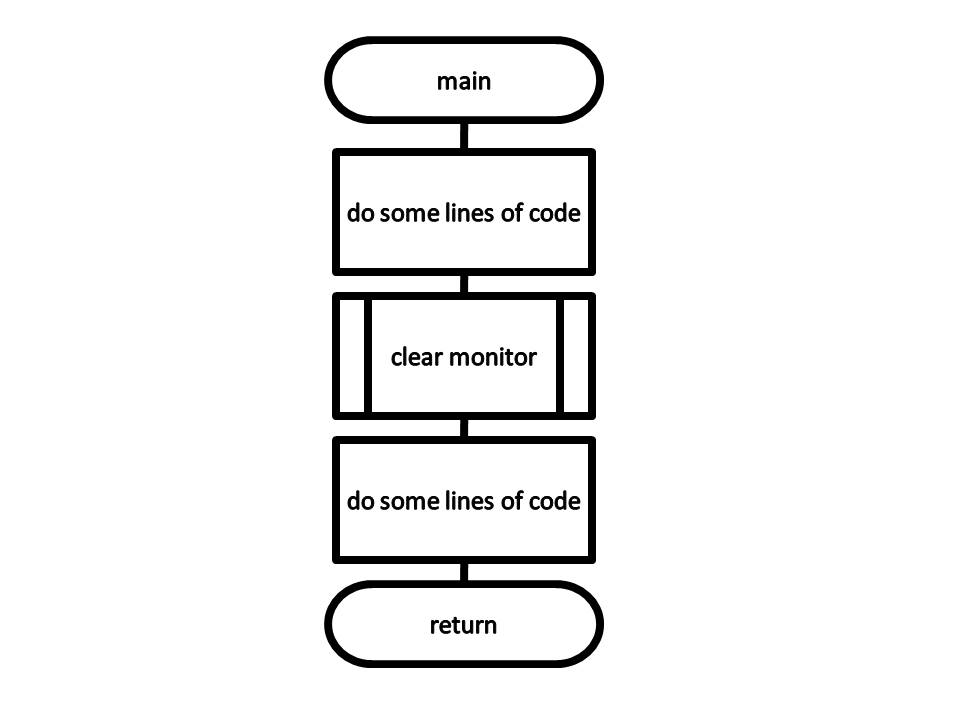
pseudocode: Function main calling the clear monitor function
Function main
    Pass In: nothing
    Doing some lines of code
    Call: clear monitor
    Doing some lines of code
    Pass Out: value zero to the operating system
End function
Sequence Control Structures
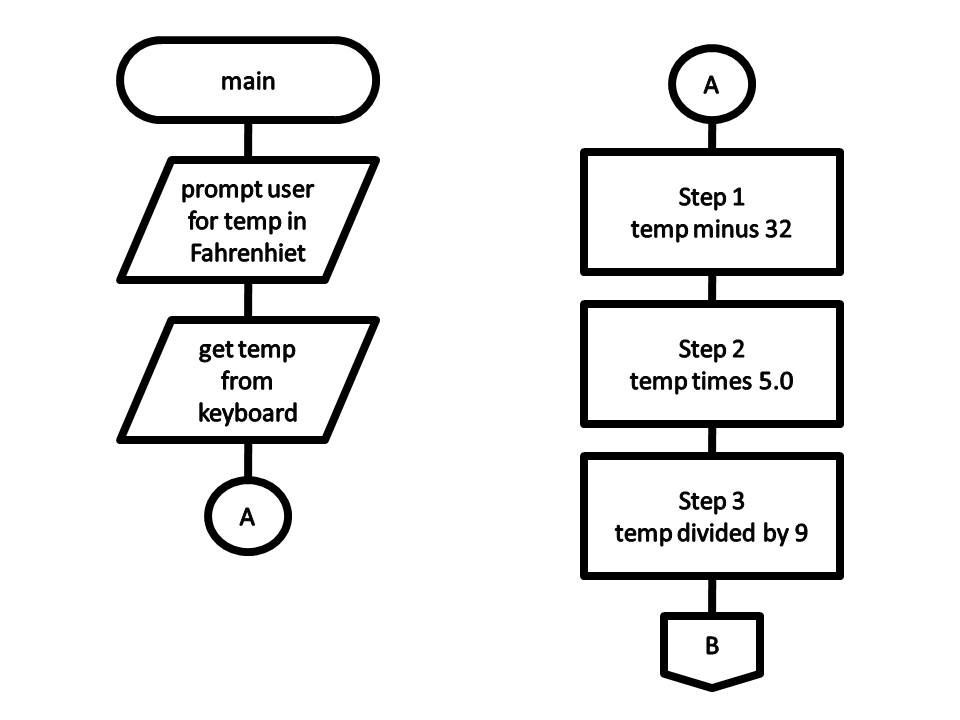
The next item is pseudocode for a simple temperature conversion program. This demonstrates the use of both the on-page and off-page connectors. It also illustrates the sequence control structure where nothing unusual happens. Just do one instruction after another in the sequence listed.
pseudocode: Sequence control structure
Filename: Solution_Lab_04_Pseudocode.txt
Purpose: Convert Temperature from Fahrenheit to Celsius
Author: Ken Busbee; © 2008 Kenneth Leroy Busbee
Date: Dec 24, 2008
Pseudocode = IPO Outline
input
display a message asking user for the temperature in Fahrenheit
get the temperature from the keyboard
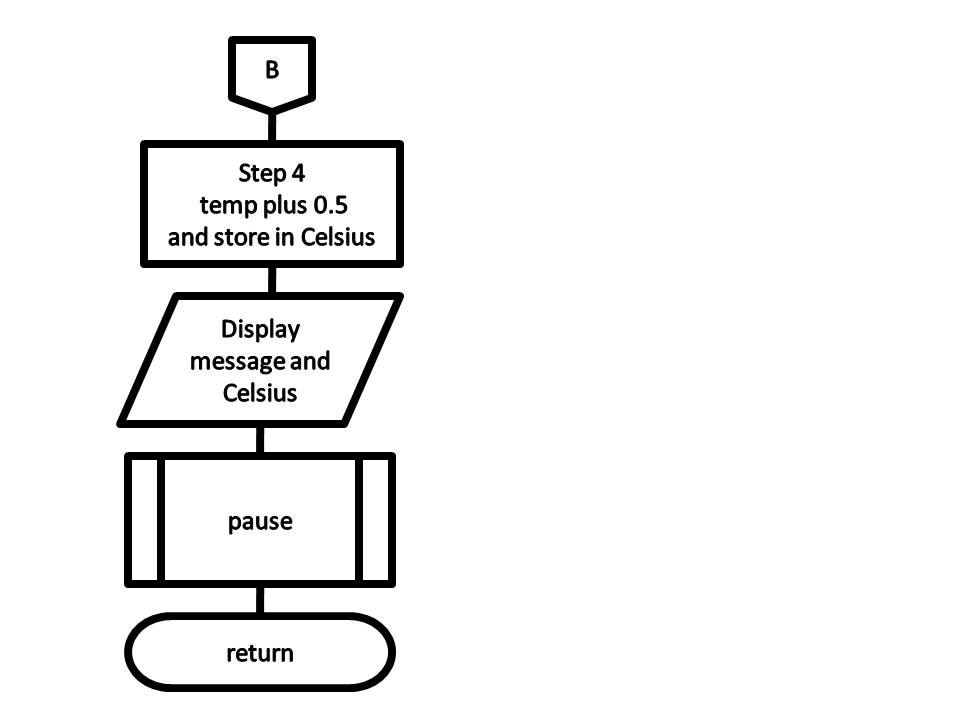
processing
calculate the Celsius by subtracting 32 from the Fahrenheit
temperature then multiply the result by 5 then
divide the result by 9. Round up or down to the whole number.
HINT: Use 32.0 when subtracting to ensure floating-point accuracy.
output
display the celsius with an appropriate message
pause so the user can see the answer
Advanced Examples
Selection Control Structures
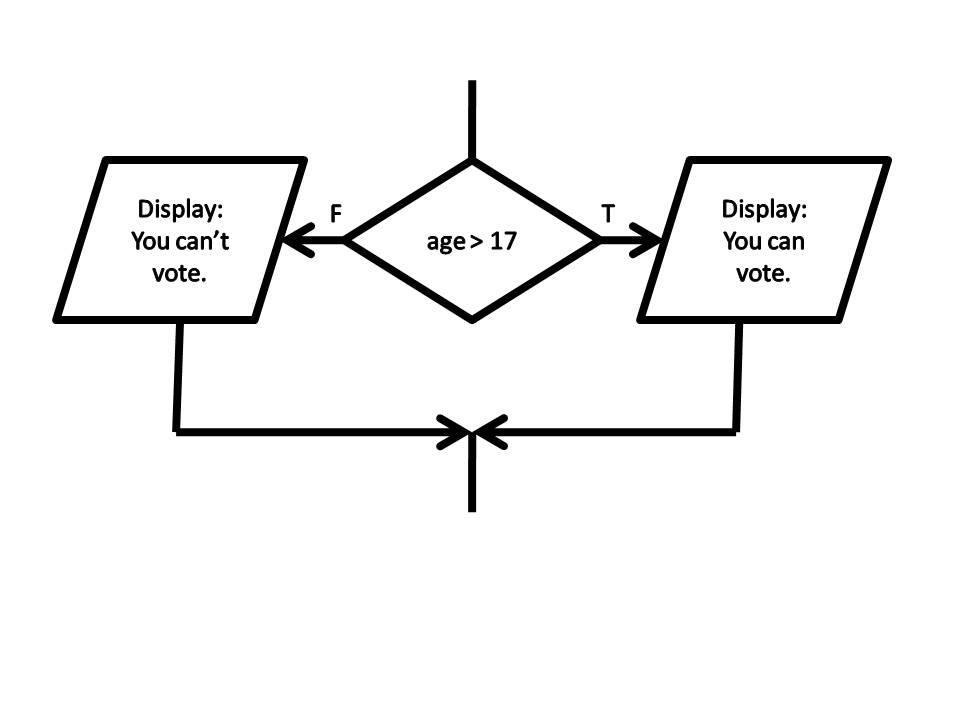
pseudocode: If then Else
If age > 17
    Display a message indicating you can vote.
Else
    Display a message indicating you can't vote.
Endif
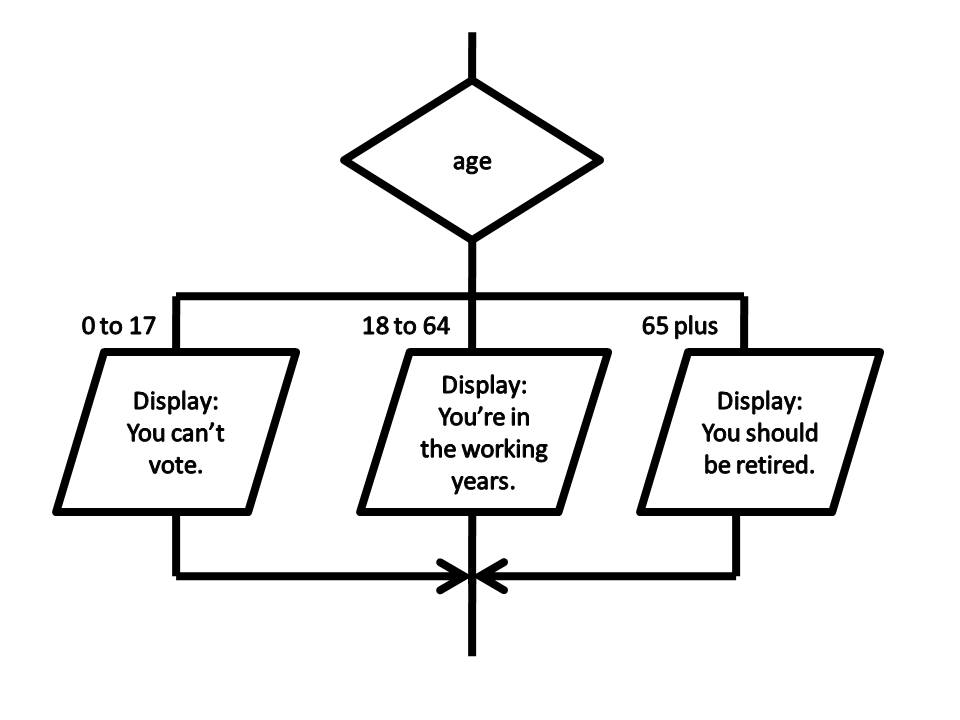
pseudocode: Case
Case of age
    0 to 17   Display "You can't vote."
    18 to 64  Display "You are in your working years."
    65 +      Display "You should be retired."
End case
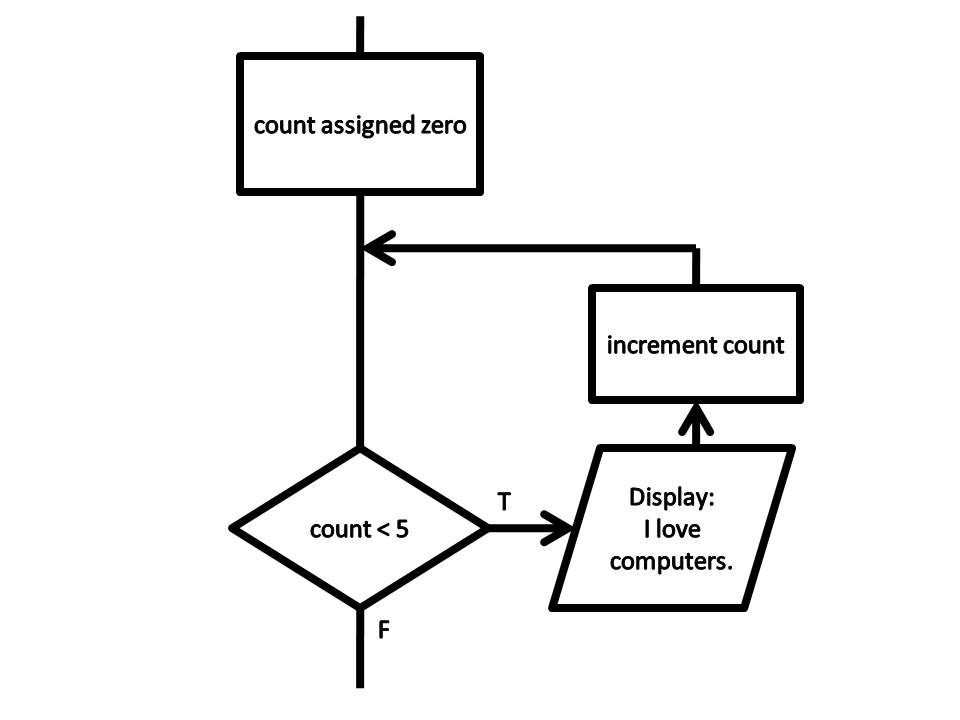
Iteration (Repetition) Control Structures
pseudocode: While
count assigned zero
While count < 5
    Display "I love computers!"
    Increment count
End while
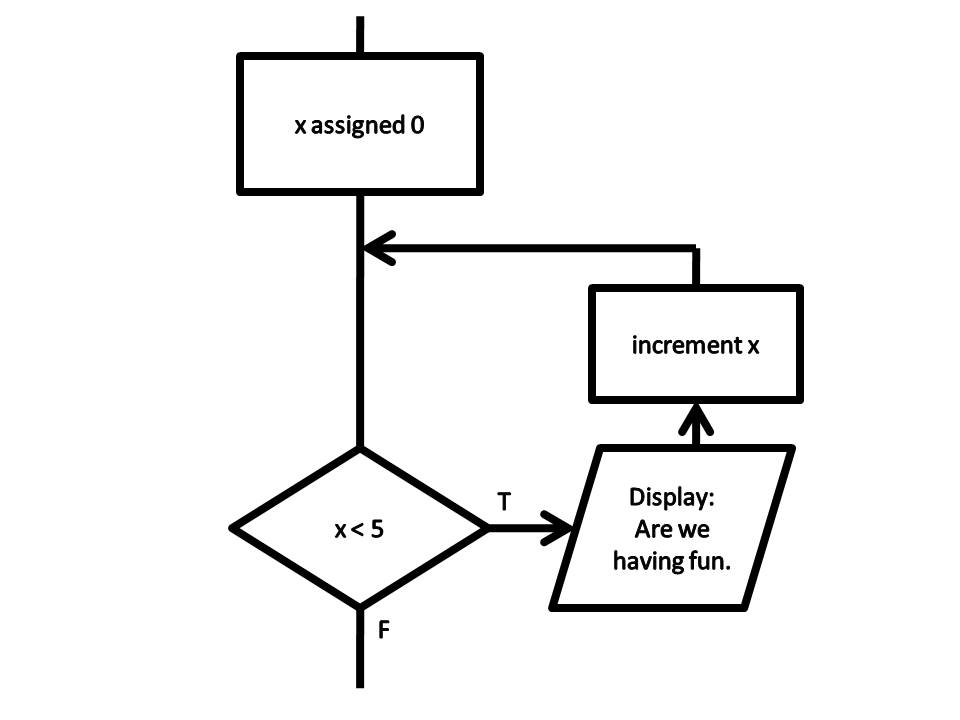
pseudocode: For
For x starts at 0, x < 5, increment x
    Display "Are we having fun?"
End for
The for loop does not have a standard flowcharting method and you will find it done in different ways. The for loop as a counting loop can be flowcharted similar to the while loop as a counting loop.
pseudocode: Do While
count assigned five
Do
    Display "Blast off is soon!"
    Decrement count
While count > zero

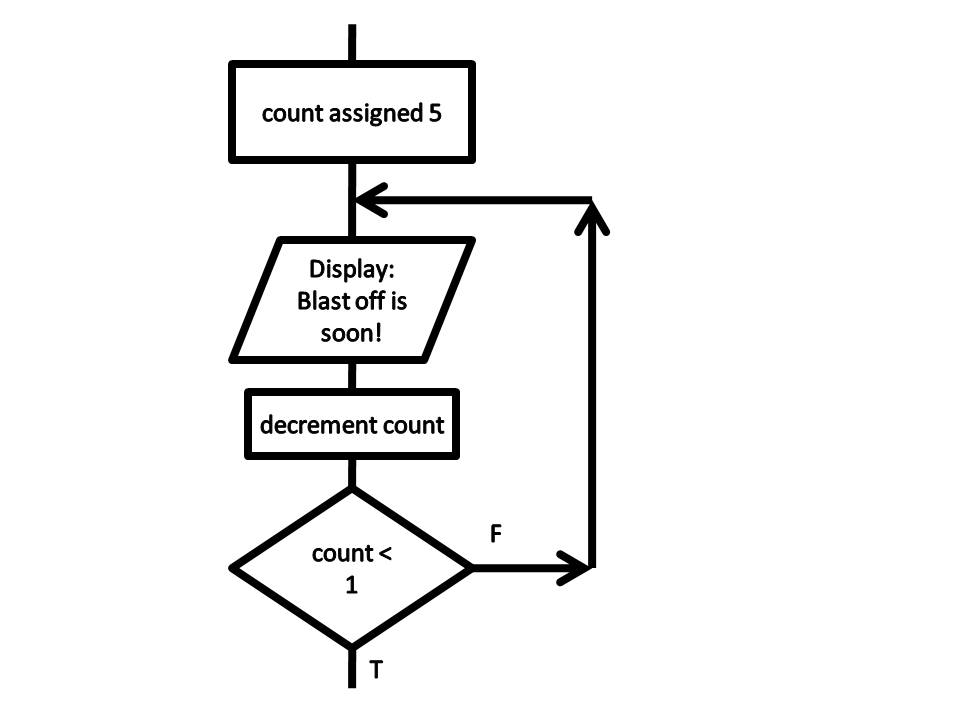
pseudocode: Repeat Until
count assigned five
Repeat
    Display "Blast off is soon!"
    Decrement count
Until count < one
Key Terms
- decision symbol
- A diamond used in flowcharting for asking a question and making a decision.
- flow lines
- Lines (sometimes with arrows) that connect the various flowcharting symbols.
- flowcharting
- A programming design tool that uses graphical elements to visually depict the flow of logic within a function.
- input/output symbol
- A parallelogram used in flowcharting for input/output interactions.
- process symbol
- A rectangle used in flowcharting for normal processes such as assignment.