
3.3.7: The Diode Equation
- Page ID
- 89954

The reason for calling the proportionality constant \(I_{\text{sat}}\) will become obvious when we consider reverse bias. Let us now make \(V_{a}\) negative instead of positive. This situation is also non-equilibrium, and the Fermi level i not constant. The applied electric field now adds in the same direction to the built-in field. This means the barrier will increase instead of decrease, and so we have what is shown in Figure \(\PageIndex{1}\). Note that we have marked the barrier height as \(q \left(V_{\text{bi}}-V_{a}\right)\) as before. It is just that now \(V_{a}\) is negative, and so the barrier is bigger.
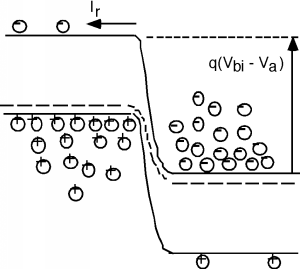
Remember, the electrons fall off exponentially as we move up in energy, so it does not take much of a shift of the bands before there are essentially no electrons on the n-side with enough energy to get over the barrier. Well, that isn't quite true, there are electons with enough energy, but very very few. This is reflected in the diode equation where, if we let \(V_{a}\) be a negative number, \(e^{\frac{q V_{a}}{kT}}\) very quickly goes to zero and we are left with \[I = -I_{\text{sat}} \nonumber \]
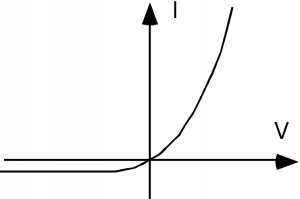
Thus, while in the forward bias direction, the current increases exponentially with voltage, in the reverse direction it simply saturates at \(-I_{\text{sat}}\). A plot of \(I\) as a function of voltage or an I-V characteristic curve might look something like Figure \(\PageIndex{2}\). But this plot has an inconsistent current scale, for negative voltages the current may be uA or less, and mA or more for positive voltages.
In fact, for real diodes (ones made from silicon), \(I_{\text{sat}}\) is such a small value (on the order of \(10^{-10}\) amps) that you can not even see it on most common measuring devices (oscilloscopes, digital voltmeters, etc.) If you measure the I-V Characteristic for most diodes in electronics lab, you would really see would be something like Figure \(\PageIndex{3}\) on a linear-scale plot.
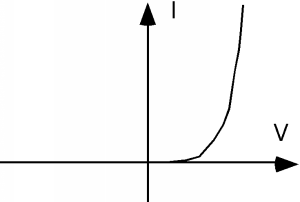
We see what looks like zero current in the reverse direction, and in fact, what appears to be no current until we get a certain amount of voltage across the diode, after which it very quickly "turns on" with a very rapidly increasing forward current. For silicon, this "turn on" voltage is about 0.6 to 0.7 volts.
Digital volt meters (DVMs) use this characteristic for their "diode check" function. What they do is, when the "red" or positive lead is connected to the p-side (anode, or the arrow in the diagram) and the "black" or negative lead is connected to the n-side (cathode, or the bar in the diagram) of a diode, the meter attempts to pass (usually) 1 mA of current through the diode. If the 1 mA of current is allowed to flow, the meter then indicates the amount of forward voltage developed across the diode. If it reads something like 0.673 volts, then you can be pretty sure the diode is OK. Reverse the leads, and the diode is reverse biased, and the meter should read "OL" (overload) or something like that to indicate that no current is flowing.
The diode equation is usually approximated by two somewhat simpler equations, depending upon whether the diode is forward or reverse biased: \[I \simeq \begin{cases} 0 \text{ if } V_{a}<0 \\[4pt] I_{\text{sat}} e^{\frac{qV_{a}}{kT}} \text{ if } V_{a}>0 \end{cases} \nonumber \]
For reverse bias, as we said, the current is essentially nil. In the forward bias case, the exponential term quickly gets much larger than unity, and so we can forget the \(-1\) term in the diode equation. Remember, we said that \(kT\) at room temperature had a value of about \(1/40\) of an eV, so \(\frac{q}{kT} \simeq 40 \mathrm{~V}^{-1}\); this means we can also say for forward bias that \[I = I_{\text{sat}} e^{40 V_{a}} \nonumber \]
From this equation it is easy to see that only a small positive value for \(V_{a}\) is needed in order to make the exponential much greater than unity.
Now let's connect this "ideal diode equation" to the real world. One thing you might ask yourself is, "How could I check to see if an actual diode follows Equation \(1.8.3\)?" As we said, \(I_{\text{sat}}\) is a very small current, and so trying to do the reverse test is probably not going to be successful. What is usually done is to measure the diode current (and forward voltage) over several orders of magnitude of current.
While the current can vary by many orders of magnitude, the voltage is more or less limited to values between \(0\) and \(0.6\) to \(0.7\) volts, not by any fundamental process, but rather simply by the fact that we often use uA and mA levels of current in electronics. Much less current can be overwhelmed by noise, and more forward current will burn up most diodes.
If we take the natural log of both sides of the second piece of Equation \(\PageIndex{2}\), we find: \[\ln (I) = \ln \left(I_{\text{sat}}\right) + \frac{q V_{a}}{kT} \nonumber \]
Thus, a plot of \(\ln (I)\) as a function of \(V_{a}\) should yield a straight line with a slope of \(\frac{q}{kT}\), or 40.
Well, I went into the lab, grabbed a real diode and made some measurements. Figure \(\PageIndex{4}\) is a plot of the natural log of the current as a function of voltage from \(0.05\) to \(0.70\) volts. Included with this plot is a linear curve fit to the data, which is plotted as a dotted line. The linear fit goes through the data points quite nicely, so the current is surely an exponential function of the applied voltage! From the expression for the best fit, which is printed above the graph, we see that \(\ln \left(I_{\text{sat}}\right) = -19.68\). That means that \(I_{\text{sat}} = e^{-19.68} = 2.89 \times 10^{-9} \text{ amps}\), which is indeed a very small current.
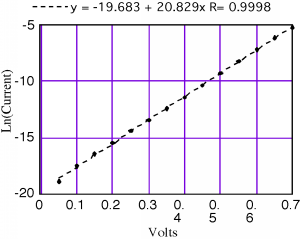
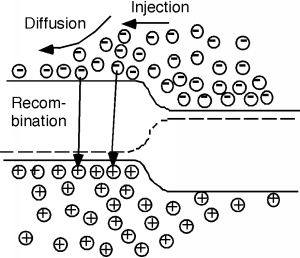
Look at the slope, however. It's supposed to be \(40\), and yet it turns out to be slightly more than \(20\)! This comes about because of some complex details of exactly what happens to the electrons and holes when they cross the junction. In what is called the diffusion dominated situation, electrons and holes are injected across the junction, after which they diffuse away from the junction, and also recombine, until eventually they are all gone. This is shown schematically in Figure \(\PageIndex{5}\).
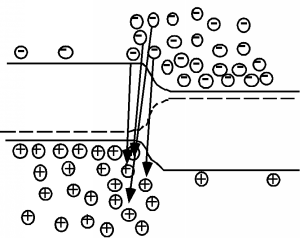
The other regime is called recombination dominated and here, the majority of the current is made up of the electrons and holes recombining directly with each other at the junction. This is shown in Figure \(\PageIndex{6}\). For recombination dominated diode behavior, it turns out that the current is given by \[I = I_{\text{sat}} e^{\frac{q V_{a}}{2kT}} \nonumber \]
In general, a particular diode might have a combination of these two effects going on, and so people often use a more general form for the diode equation: \[I = I_{\text{sat}} e^{\frac{qV_{a}}{nkT}} \nonumber \]
where \(n\) is called the ideality factor and is a number somewhere between \(1\) and \(2\). For the diode which gave the data for our example, \(n=1.92\) and so most of the current is dominated by recombination of electrons and holes in the depletion region.