
5.1.3: Evapotranspiration and Crop Water Use
- Page ID
- 48192

\( \newcommand{\vecs}[1]{\overset { \scriptstyle \rightharpoonup} {\mathbf{#1}} } \)
\( \newcommand{\vecd}[1]{\overset{-\!-\!\rightharpoonup}{\vphantom{a}\smash {#1}}} \)
\( \newcommand{\dsum}{\displaystyle\sum\limits} \)
\( \newcommand{\dint}{\displaystyle\int\limits} \)
\( \newcommand{\dlim}{\displaystyle\lim\limits} \)
\( \newcommand{\id}{\mathrm{id}}\) \( \newcommand{\Span}{\mathrm{span}}\)
( \newcommand{\kernel}{\mathrm{null}\,}\) \( \newcommand{\range}{\mathrm{range}\,}\)
\( \newcommand{\RealPart}{\mathrm{Re}}\) \( \newcommand{\ImaginaryPart}{\mathrm{Im}}\)
\( \newcommand{\Argument}{\mathrm{Arg}}\) \( \newcommand{\norm}[1]{\| #1 \|}\)
\( \newcommand{\inner}[2]{\langle #1, #2 \rangle}\)
\( \newcommand{\Span}{\mathrm{span}}\)
\( \newcommand{\id}{\mathrm{id}}\)
\( \newcommand{\Span}{\mathrm{span}}\)
\( \newcommand{\kernel}{\mathrm{null}\,}\)
\( \newcommand{\range}{\mathrm{range}\,}\)
\( \newcommand{\RealPart}{\mathrm{Re}}\)
\( \newcommand{\ImaginaryPart}{\mathrm{Im}}\)
\( \newcommand{\Argument}{\mathrm{Arg}}\)
\( \newcommand{\norm}[1]{\| #1 \|}\)
\( \newcommand{\inner}[2]{\langle #1, #2 \rangle}\)
\( \newcommand{\Span}{\mathrm{span}}\) \( \newcommand{\AA}{\unicode[.8,0]{x212B}}\)
\( \newcommand{\vectorA}[1]{\vec{#1}} % arrow\)
\( \newcommand{\vectorAt}[1]{\vec{\text{#1}}} % arrow\)
\( \newcommand{\vectorB}[1]{\overset { \scriptstyle \rightharpoonup} {\mathbf{#1}} } \)
\( \newcommand{\vectorC}[1]{\textbf{#1}} \)
\( \newcommand{\vectorD}[1]{\overrightarrow{#1}} \)
\( \newcommand{\vectorDt}[1]{\overrightarrow{\text{#1}}} \)
\( \newcommand{\vectE}[1]{\overset{-\!-\!\rightharpoonup}{\vphantom{a}\smash{\mathbf {#1}}}} \)
\( \newcommand{\vecs}[1]{\overset { \scriptstyle \rightharpoonup} {\mathbf{#1}} } \)
\(\newcommand{\longvect}{\overrightarrow}\)
\( \newcommand{\vecd}[1]{\overset{-\!-\!\rightharpoonup}{\vphantom{a}\smash {#1}}} \)
\(\newcommand{\avec}{\mathbf a}\) \(\newcommand{\bvec}{\mathbf b}\) \(\newcommand{\cvec}{\mathbf c}\) \(\newcommand{\dvec}{\mathbf d}\) \(\newcommand{\dtil}{\widetilde{\mathbf d}}\) \(\newcommand{\evec}{\mathbf e}\) \(\newcommand{\fvec}{\mathbf f}\) \(\newcommand{\nvec}{\mathbf n}\) \(\newcommand{\pvec}{\mathbf p}\) \(\newcommand{\qvec}{\mathbf q}\) \(\newcommand{\svec}{\mathbf s}\) \(\newcommand{\tvec}{\mathbf t}\) \(\newcommand{\uvec}{\mathbf u}\) \(\newcommand{\vvec}{\mathbf v}\) \(\newcommand{\wvec}{\mathbf w}\) \(\newcommand{\xvec}{\mathbf x}\) \(\newcommand{\yvec}{\mathbf y}\) \(\newcommand{\zvec}{\mathbf z}\) \(\newcommand{\rvec}{\mathbf r}\) \(\newcommand{\mvec}{\mathbf m}\) \(\newcommand{\zerovec}{\mathbf 0}\) \(\newcommand{\onevec}{\mathbf 1}\) \(\newcommand{\real}{\mathbb R}\) \(\newcommand{\twovec}[2]{\left[\begin{array}{r}#1 \\ #2 \end{array}\right]}\) \(\newcommand{\ctwovec}[2]{\left[\begin{array}{c}#1 \\ #2 \end{array}\right]}\) \(\newcommand{\threevec}[3]{\left[\begin{array}{r}#1 \\ #2 \\ #3 \end{array}\right]}\) \(\newcommand{\cthreevec}[3]{\left[\begin{array}{c}#1 \\ #2 \\ #3 \end{array}\right]}\) \(\newcommand{\fourvec}[4]{\left[\begin{array}{r}#1 \\ #2 \\ #3 \\ #4 \end{array}\right]}\) \(\newcommand{\cfourvec}[4]{\left[\begin{array}{c}#1 \\ #2 \\ #3 \\ #4 \end{array}\right]}\) \(\newcommand{\fivevec}[5]{\left[\begin{array}{r}#1 \\ #2 \\ #3 \\ #4 \\ #5 \\ \end{array}\right]}\) \(\newcommand{\cfivevec}[5]{\left[\begin{array}{c}#1 \\ #2 \\ #3 \\ #4 \\ #5 \\ \end{array}\right]}\) \(\newcommand{\mattwo}[4]{\left[\begin{array}{rr}#1 \amp #2 \\ #3 \amp #4 \\ \end{array}\right]}\) \(\newcommand{\laspan}[1]{\text{Span}\{#1\}}\) \(\newcommand{\bcal}{\cal B}\) \(\newcommand{\ccal}{\cal C}\) \(\newcommand{\scal}{\cal S}\) \(\newcommand{\wcal}{\cal W}\) \(\newcommand{\ecal}{\cal E}\) \(\newcommand{\coords}[2]{\left\{#1\right\}_{#2}}\) \(\newcommand{\gray}[1]{\color{gray}{#1}}\) \(\newcommand{\lgray}[1]{\color{lightgray}{#1}}\) \(\newcommand{\rank}{\operatorname{rank}}\) \(\newcommand{\row}{\text{Row}}\) \(\newcommand{\col}{\text{Col}}\) \(\renewcommand{\row}{\text{Row}}\) \(\newcommand{\nul}{\text{Nul}}\) \(\newcommand{\var}{\text{Var}}\) \(\newcommand{\corr}{\text{corr}}\) \(\newcommand{\len}[1]{\left|#1\right|}\) \(\newcommand{\bbar}{\overline{\bvec}}\) \(\newcommand{\bhat}{\widehat{\bvec}}\) \(\newcommand{\bperp}{\bvec^\perp}\) \(\newcommand{\xhat}{\widehat{\xvec}}\) \(\newcommand{\vhat}{\widehat{\vvec}}\) \(\newcommand{\uhat}{\widehat{\uvec}}\) \(\newcommand{\what}{\widehat{\wvec}}\) \(\newcommand{\Sighat}{\widehat{\Sigma}}\) \(\newcommand{\lt}{<}\) \(\newcommand{\gt}{>}\) \(\newcommand{\amp}{&}\) \(\definecolor{fillinmathshade}{gray}{0.9}\)How much water does a crop need?
The amount of water that a crop uses includes the water that is transpired by the plant and the water that is stored in the tissue of the plant from the process of photosynthesis. The water stored in the plant's tissue is a tiny fraction (<5%) of the total amount of water used by the plant. So, the water use of a crop is considered to be equal to the water transpired or evaporated by the plant.
Since a majority of the water used by the crop is the water that is transpired by the plant, we measure the water use of a plant or crop as the rate of evapotranspiration or ET, which is the process by which liquid water moves from the soil or plants to vapor form in the atmosphere. ET is comprised of two evaporative processes, as illustrated in figure 4.1.3 below: evaporation of water from soil and transpiration of water from plants' leaves. ET is an important part of the hydrologic cycle as it is the pathway by which water moves from the earth's surface into the atmosphere.
Remember, evaporation rates are affected by solar radiation, temperature, relative humidity, and the wind. ET, which includes evaporation from soils and transpiration from plants, is also evaporative, so the ET rate is also affected by solar radiation, temperature, relative humidity, and the wind. This tells us that the crop water use will also be affected by solar radiation, temperature, relative humidity, and the wind! More water evaporates from plants and soils in conditions of higher air temperature, low humidity, strong solar energy and strong wind speeds.
The transpiration portion of ET gets a little more complicated because the structure, age, and health of the plant, as well as other plant factors, can also affect the rate of transpiration. For example, desert plants are adapted to transpire at slower rates than plants adapted for more humid environments. Some desert plants keep their stomata closed during the day to reduce transpiration during the heat of a dry desert day. Plant adaptations to conserve moisture include wilting to reduce transpiration. Also, small leaves, silvery reflective leaves, and hairy leaves all reduce transpiration by reducing evaporation.
In summary, the amount of water that a crop needs is measured by the ET rate of a crop. The ET rate includes water that is transpired or evaporated through the plant. And, the ET rate varies depending on climatic conditions, the plant characteristics, and the soil conditions.
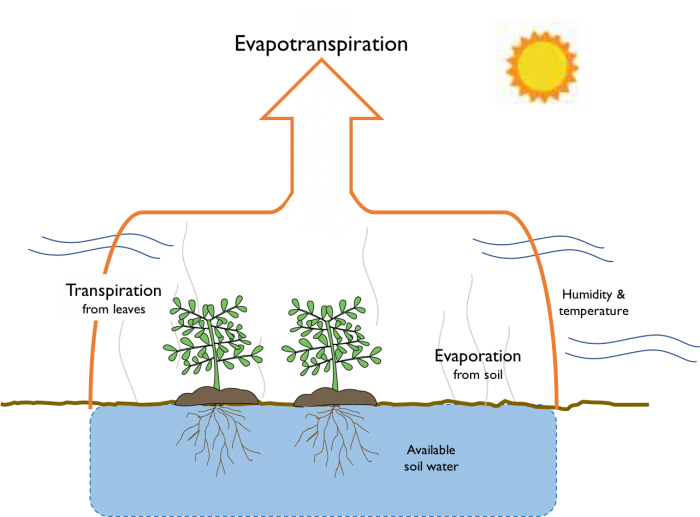
Figure 4.1.3.: Evapotranspiration includes evaporation from soil and transpiration from leaves. Credit: Figure drawn by Gigi Richard, adapted from Bates, R.L. & J.A.Jackson, Glossary of Geology, Second Edition, American Geology Institute, 1980
- Click for a text description of the evapotranspiration image.
-
Diagram of Evapotranspiration. At the bottom is soil and below that, available soil water. In the soil are two plants with roots extending into the soil water. There are lines coming up from the soil representing evaporation from the soil. Lines from the plants represent transpiration from leaves. There is a line drawn around all of this, with the sun outside and humidity and temperature flowing in. An arrow from transpiration and evaporation leads to evapotranspiration.
Crop water use varies
If the ET rate of a crop determines the water use of that crop, we could expect water use of a single crop to vary in similar spatial patterns to evaporation rates. For example, if evaporation rates are very high in Arizona because the hot, dry climate, you would expect ET rates to be higher for a given crop in that climate. ET is measured by the average depth of water that the crop uses, which is a function of the plant and of the weather conditions in the area. In cool, wet conditions, the plant will require less water, but under hot, dry conditions, the same plant will require more water.
Figure 4.1.4 shows a range of typical water use for crops in California. The graph shows how much water needs to be applied as irrigation to grow different crops. Notice how some crops, like alfalfa, almonds, pistachios, rice and pasture grass can require four feet or more of water application. Other crops, like grapes, beans, and grains only require about between one and two feet of water.
If we moved the plants in Figure 4.1.4 to a cooler and more humid climate, the rate of evaporation would be less and the crop water demand would decline as well. In a hot dry climate, you need to apply more water to the plant to keep it healthy and growing because more water is evaporating from both the soil and through the stomata on the plants’ leaves, so the plant is pulling more water out of the soil via its roots to replace the water transpiring from its leaves.
Figure 4.1.4.: Water use of California crops, as measured by water application depth. Note: The range shown reflects the first and third quartile of the water application depth for the period 1998-2010, and the white line within that range reflects the median application depth during that period. Credit: California Agricultural Water Use: Key Background Information, by Heather Cooley, Pacific Institute.