
11.2: Starting with Mondrian
- Page ID
- 43723

A ROMondrianViewBuilder models the Mondrian domain-specific language (DSL). A ROMondrianViewBuilder internally contains an instance of a ROView, called raw view. Its accessor is raw. All scripting using the ROMondrianViewBuilder result in creating ROElements with the shapes and interactions set by the script, and added to the raw view. To start a visualization with the builder, you can use the following code:
view := ROMondrianViewBuilder new.
view open.
A Mondrian builder can also be initialized with an instance of a ROView. It, however, is important to understand that this is not required, as the builder by default will create its own raw view. When working with the builder, it is possible to use the Mondrian DSL, sending messages to an instance of the ROMondrianViewBuilder, or directly with the raw view.
rawView := ROView new.
view := ROMondrianViewBuilder view: rawView.
view open.
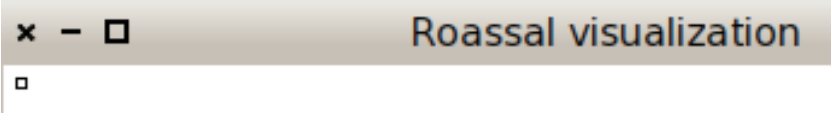
To add a node to the visualization, which is internally translated as a ROElement later on, use the selector node: with the object you want to represent. By default, a small square is drawn for each element.
view := ROMondrianViewBuilder new.
view node: 1.
view open.
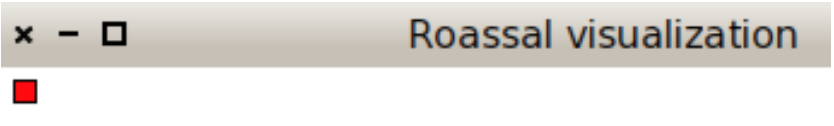
To define shapes, use the shape message followed by the desired shape with its characteristics, before the node or nodes definition. This will locally define the shape for the nodes.
view := ROMondrianViewBuilder new.
view shape rectangle
    size: 10;
    color: Color red.
view node: 1.
view open.
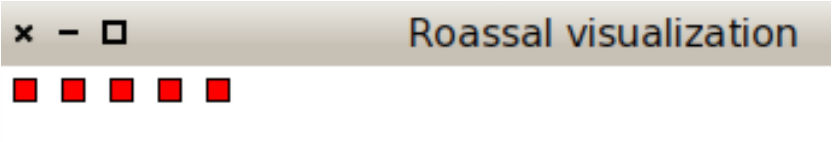
By using the nodes: message with a collection of objects you can create several nodes.
view := ROMondrianViewBuilder new.
view shape rectangle
    size: 10;
    color: Color red.
view nodes: (1 to: 5).
view open.
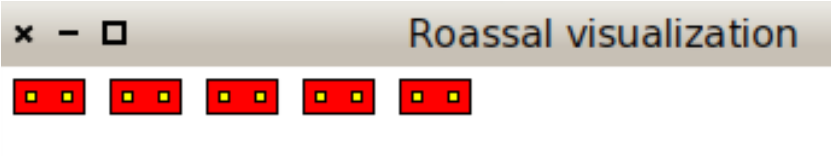
If the node or nodes have nested nodes, use the node:forIt: or nodes:forEach: message to add them. The second parameter is a block which will add the nested nodes, as the following code shows:
view := ROMondrianViewBuilder new.
view shape rectangle
    size: 10;
    color: Color red.
view
    nodes: (1 to: 5)
    forEach: [ :each |
        view shape rectangle
            size: 5;
            color: Color yellow.
        view nodes: (1 to: 2) ].
view open.
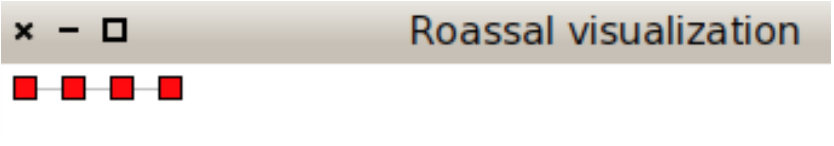
It is possible to create edges by using the edgesFromAssociations: message with a collection of associations between the model of the nodes.
view := ROMondrianViewBuilder new.
view shape rectangle
    color: Color red.
view nodes: (1 to: 4).
view edgesFromAssociations: (Array with: 1-> 2 with: 2 -> 3 with: 2 -> 4).
view open.
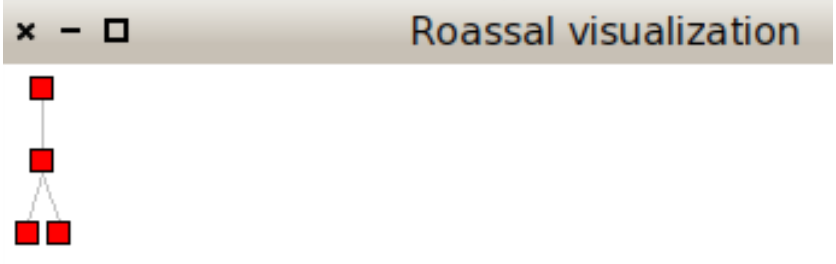
Similar to the Collection hierarchy example, given at the beginning of the chapter, we need an appropriate layout. By default the builder applies a horizontal line layout and we need a tree layout. We use the treeLayout to apply it.
view := ROMondrianViewBuilder new.
view shape rectangle
    size: 10;
    color: Color red.
view nodes: (1 to: 4).
view edgesFromAssociations: (Array with: 1-> 2 with: 2 -> 3 with: 2 -> 4).
view treeLayout.
view open.
The Collection Hierarchy example
The Mondrian DSL allows a simpler scripting to the Collection hierarchy visualization than the one constructed through the chapter. By setting how each element and edge must be created, it is not necessary for us to create them by hand.
view := ROMondrianViewBuilder new.
view shape rectangle
    width: [ :cls | cls instVarNames size ];
    height: [ :cls | cls methods size ].
view nodes: Collection withAllSubclasses.
view edgesFrom: #superclass.
view treeLayout.
view open.
There are essentially two ways to work with Mondrian, either using the easel or a view renderer. The easel is a tool in which users may interactively and incrementally build a visualization by means of a script. The easel is particularly useful when prototyping. MOViewRenderer enables a visualization to be programmatically built, in a non-interactive fashion. You probably want to use this class when embedding your visualization in your application.
We will first use Mondrian in its easiest way, by using the easel. To open an easel, you can either use the World menu (it should contain the entry “Mondrian Easel”) or execute the expression:
ROEaselMorphic open.
In the easel you have just opened, you can see two panels: the one on top is the visualization panel, the second one is the script panel. In the script panel, enter the following code and press the generate button:
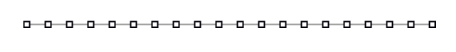
view nodes: (1 to: 20).
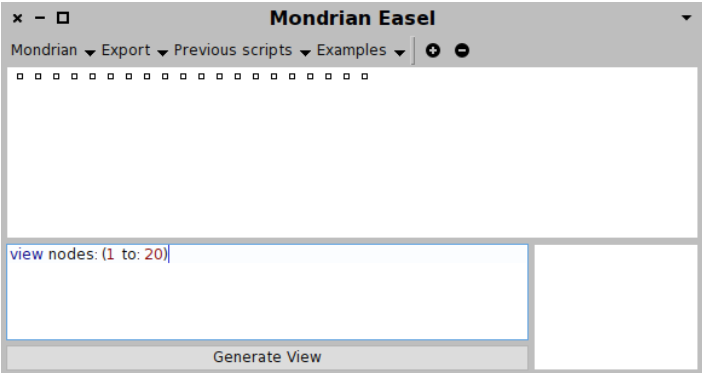
You should see in the top pane 20 small boxes lined up in the top left corner. You have just rendered the numerical set between 1 and 20. Each box represents a number. The amount of interaction you can do is quite limited for now. You can only drag and drop a number and get a tooltip that indicates its value. We will soon see how to define interactions. For now, let us explore the basic drawing capabilities of Mondrian.
We can add edges between nodes that we already drawn. Add a second line:
view nodes: (1 to: 20).
view edgesFrom: [ :v | v * 2 ].
Each number is linked with its double. Not all the doubles are visible. For example, the double of 20 is 40, which is not part of the visualization. In that case, no edge is drawn.
The message edgesFrom: defines one edge per node, when possible. For each node that has been added in the visualization, an edge is defined between this node and a node lookup from the provided block.
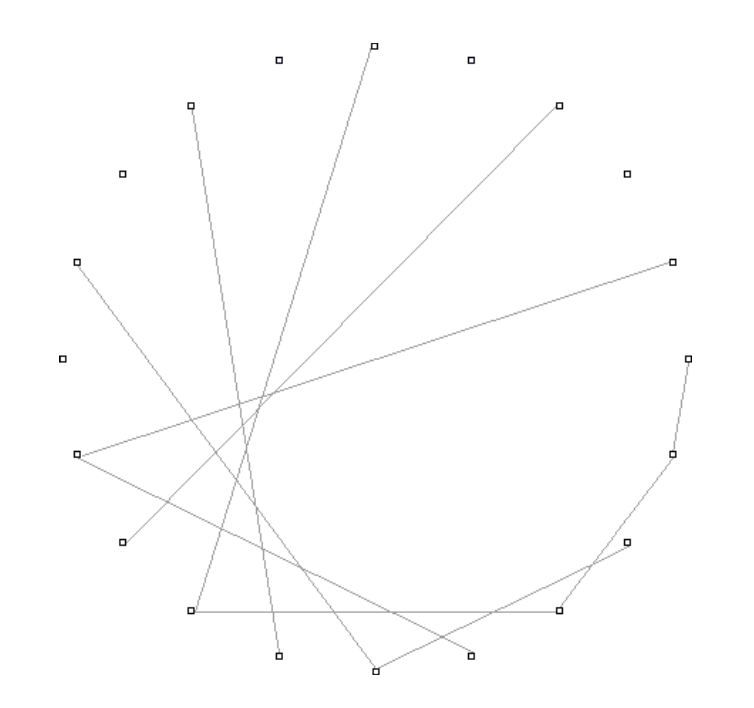
Mondrian contains a number of layouts to order nodes. Here, we use the circle layout:
view nodes: (1 to: 20).
view edgesFrom: [ :v | v * 2 ].
view circleLayout.
The visualization you obtain is:
In the subsequent section we will visualize software code to illustrate the power of Mondrian. Visualizing source code is often employed to discover patterns, useful when assessing code quality.