11.12: Interaction
- Page ID
- 45944

Mondrian offers a number of contextual interaction mechanisms. The interaction object contains a number of keywords for that purpose. The message highlightWhenOver: takes a block as argument. This block returns a list of the nodes to highlight when the mouse enters a node. Consider the example:
view interaction
    highlightWhenOver: [:v | {v - 1 . v + 1. v + 4 . v - 4}].
view shape rectangle
    width: 40;
    height: 30;
    withText.
view nodes: (1 to: 16).
view gridLayout gapSize: 2.
Entering the node 5 highlights the nodes 4, 6, 1 and 9. This mechanism is quite efficient to not overload with connecting edges. Only the information is shown for the node of interest.
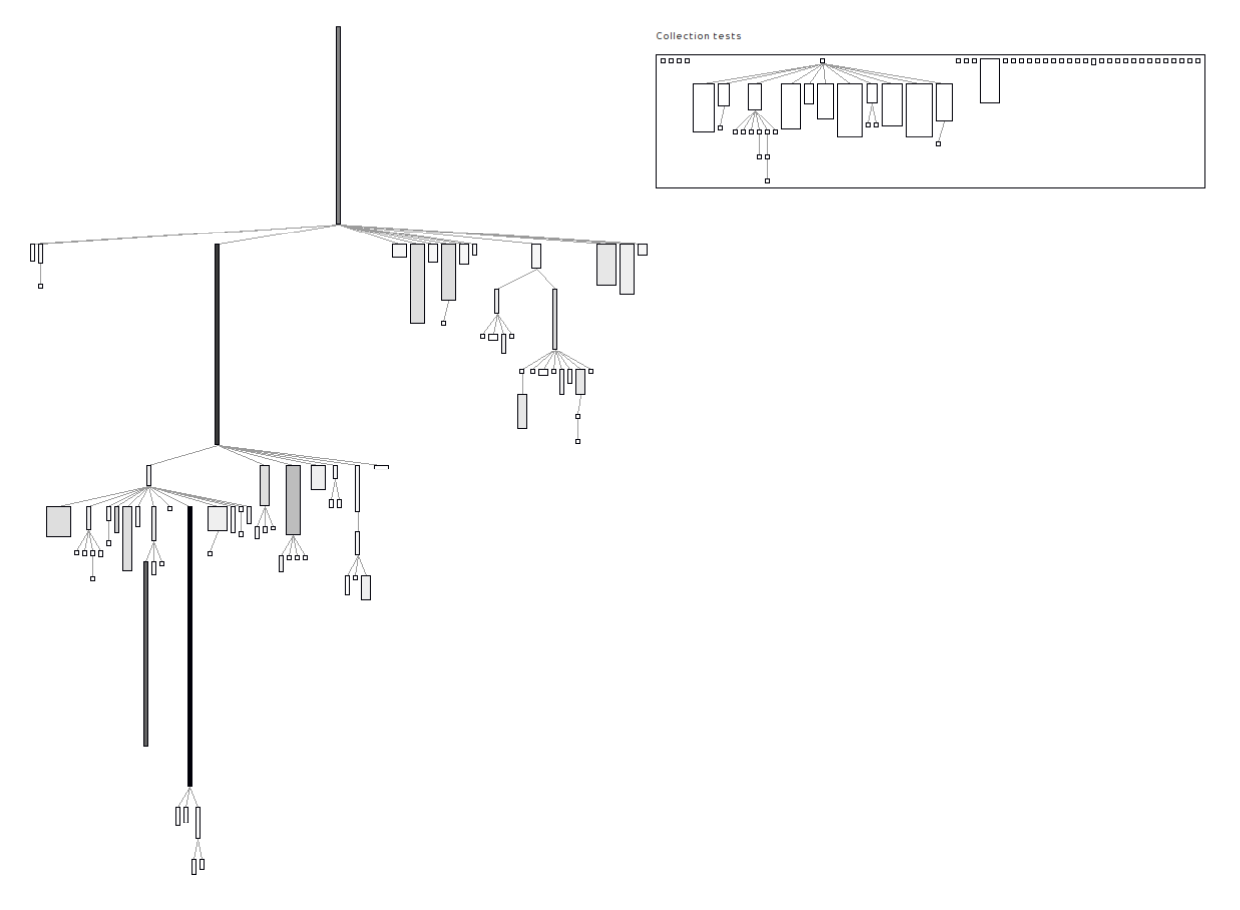
A more compelling application of highlightWhenOver: is with the following example. A hierarchy of class is displayed on the left hand side. On the right hand size a hierarchy of unit tests is displayed. Locating the mouse pointer above a unit test highlights the classes that are referenced by one of the unit test methods. Consider the (rather long) script:
"System complexity of the collection classes"
view shape rectangle
    width: [ :each | each instVarNames size * 5 ];
    height: [ :each | each methods size ];
    linearFillColor: #numberOfLinesOfCode within: Collection withAllSubclasses.
view nodes: Collection withAllSubclasses.
view edgesFrom: #superclass.
view treeLayout.

"Unit tests of the package CollectionsTest"
view shape rectangle withoutBorder.
view node: 'compound' forIt: [
    view shape label.
    view node: 'Collection tests'.

    view node: 'Collection tests' forIt: [
        | testClasses |
        testClasses := (PackageInfo named: 'CollectionsTests') classes reject: #isTrait.
        view shape rectangle
            width: [ :cls | (cls methods inject: 0 into: [ :sumLiterals :mtd | sumLiterals + mtd
                allLiterals size]) / 100 ];
            height: [ :cls | cls numberOfLinesOfCode / 50 ].
        view interaction
            highlightWhenOver: [ :cls | ((cls methods inject: #()
                    into: [:sum :el | sum , el allLiterals ]) select: [:v | v isKindOf: Association ]
            thenCollect: #value) asSet ].
        view nodes: testClasses.
        view edgesFrom: #superclass.
        view treeLayout ].

    view verticalLineLayout alignLeft
].
The script contains two parts. The first part is the ubiquitous system complexity of the collection framework. The second part renders the tests contained in the CollectionsTests. The width of a class is the number of literals contained in it. The height is the number of lines of code. Since the collection tests makes a great use of traits to reuse code, these metrics have to be scaled down. When the mouse is placed over a test unit, then all the classes of the collection framework referenced in this class are highlighted.