
3.9: Let’s Try Our Code
- Page ID
- 40055
That’s it: the Lights Out game is complete! If you have followed all of the steps, you should be able to play the game, consisting of just 2 classes and 7 methods. In a Playground, type LOGame new openInWorld and Do it .
The game will open, and you should be able to click on the cells and see how it works. Well, so much for theory... When you click on a cell, a debugger will appear. In the upper part of the debugger window you can see the execution stack, showing all the active methods. Selecting any one of them will show, in the middle pane, the Smalltalk code being executed in that method, with the part that triggered the error highlighted.
Click on the line labeled LOGame >> toggleNeighboursOfCellAt: at: (near the top). The debugger will show you the execution context within this method where the error occurred (see Figure \(\PageIndex{1}\)).
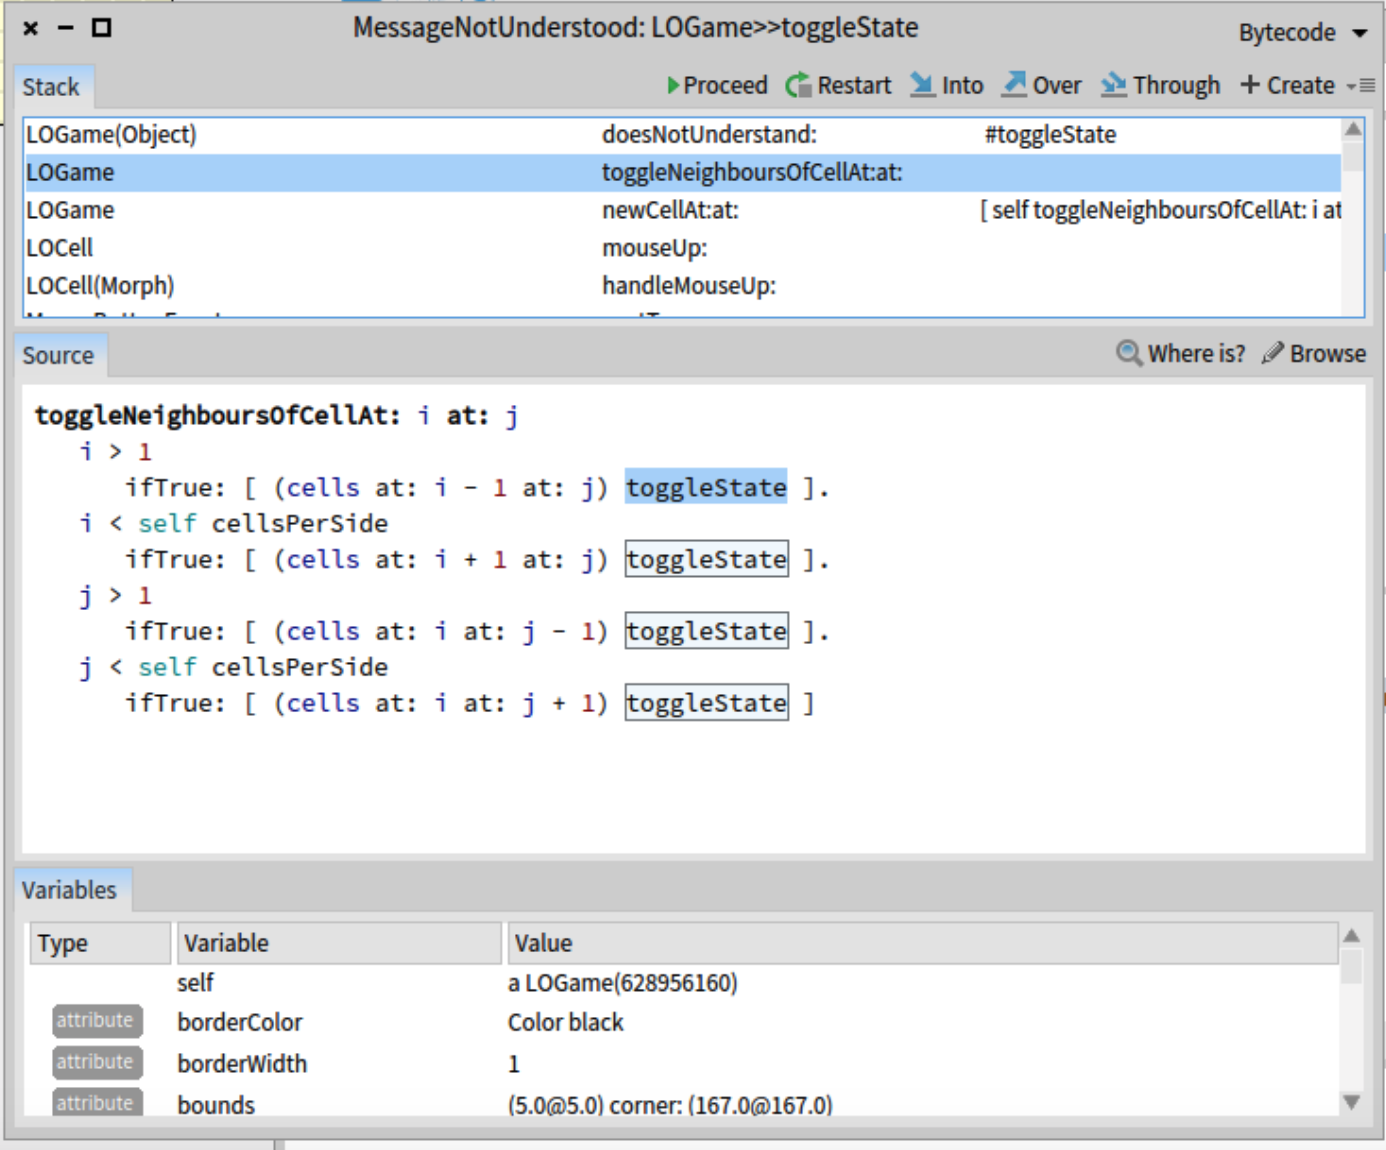
At the bottom of the debugger is a variable zone. You can inspect the object that is the receiver of the message that caused the selected method to execute, so you can look here to see the values of the instance variables. You can also see the values of the method arguments.
Using the debugger, you can execute code step by step, inspect objects in parameters and local variables, evaluate code just as you can in a playground, and, most surprisingly to those used to other debuggers, change the code while it is being debugged! Some Pharoers program in the debugger almost all the time, rather than in the browser. The advantage of this is that you see the method that you are writing as it will be executed, with real parameters in the actual execution context.
In this case we can see in the first line of the top panel that the toggleState message has been sent to an instance of LOGame, while it should clearly have been an instance of LOCell. The problem is most likely with the initialization of the cells matrix. Browsing the code of LOGame >> initialize shows that cells is filled with the return values of newCellAt: at:, but when we look at that method, we see that there is no return statement there! By default, a method returns self, which in the case of newCellAt: at: is indeed an instance of LOGame. The syntax to return a value from a method in Pharo is ^.
Close the debugger window. Add the expression ^ c to the end of the method LOGame >> newCellAt:at: so that it returns c.
LOGame >> newCellAt: i at: j
    "Create a cell for position (i,j) and add it to my on-screen
        representation at the appropriate screen position. Answer the
        new cell"

    | c origin |
    c := LOCell new.
    origin := self innerBounds origin.
    self addMorph: c.
    c position: ((i - 1) * c width) @ ((j - 1) * c height) + origin.
    c mouseAction: [ self toggleNeighboursOfCellAt: i at: j ].
    ^c
Often, you can fix the code directly in the debugger window and click Proceed to continue running the application. In our case, because the bug was in the initialization of an object, rather than in the method that failed, the easiest thing to do is to close the debugger window, destroy the running instance of the game (with the halo CMD-Alt-Shift and click), and create a new one.
Execute LOGame new openInWorld again because if you use the old game instance it will still contain the block with the old logic.
Now the game should work properly... or nearly so. If we happen to move the mouse between clicking and releasing, then the cell the mouse is over will also be toggled. This turns out to be behavior that we inherit from SimpleSwitchMorph. We can fix this simply by overriding mouseMove: to do nothing:
LOCell >> mouseMove: anEvent
Finally we are done!
About the debugger. By default when an error occurs in Pharo, the system displays a debugger. However, we can fully control this behavior. For example we can write the error in a file. We can even serialize the execution stack in a file, zip and reopen it in another image. Now when we are in development mode the debugger is available to let us go as fast as possible. In production system, developers often control the debugger to hide their mistakes from their clients.