
3.6: Running the gdb commands
- Page ID
- 83047
To run the gdb program, first an executable such file must be created, such as the printInt program. This program should be assembler and linked using the -g flag, which tells the assembler and linker to include debug information. Note that using the -g flag causes the programs to be much larger and run much slower, so this flag should only be used if the created executable file is to be debugged.
Once the program file has been created, it can be run in gdb. First, make your console screen include as many columns and rows as possible, as the larger the screen, the more information that can be displayed.. Then use the following command string to start gdbtui:
gdb printInt -tui
The -tui option says to use the text user interface, which is an interface based on the Curses library. Because it is text based, this interface does not require the X-windows interface on the Raspberry pi.
The screen should look similar Figure 7.
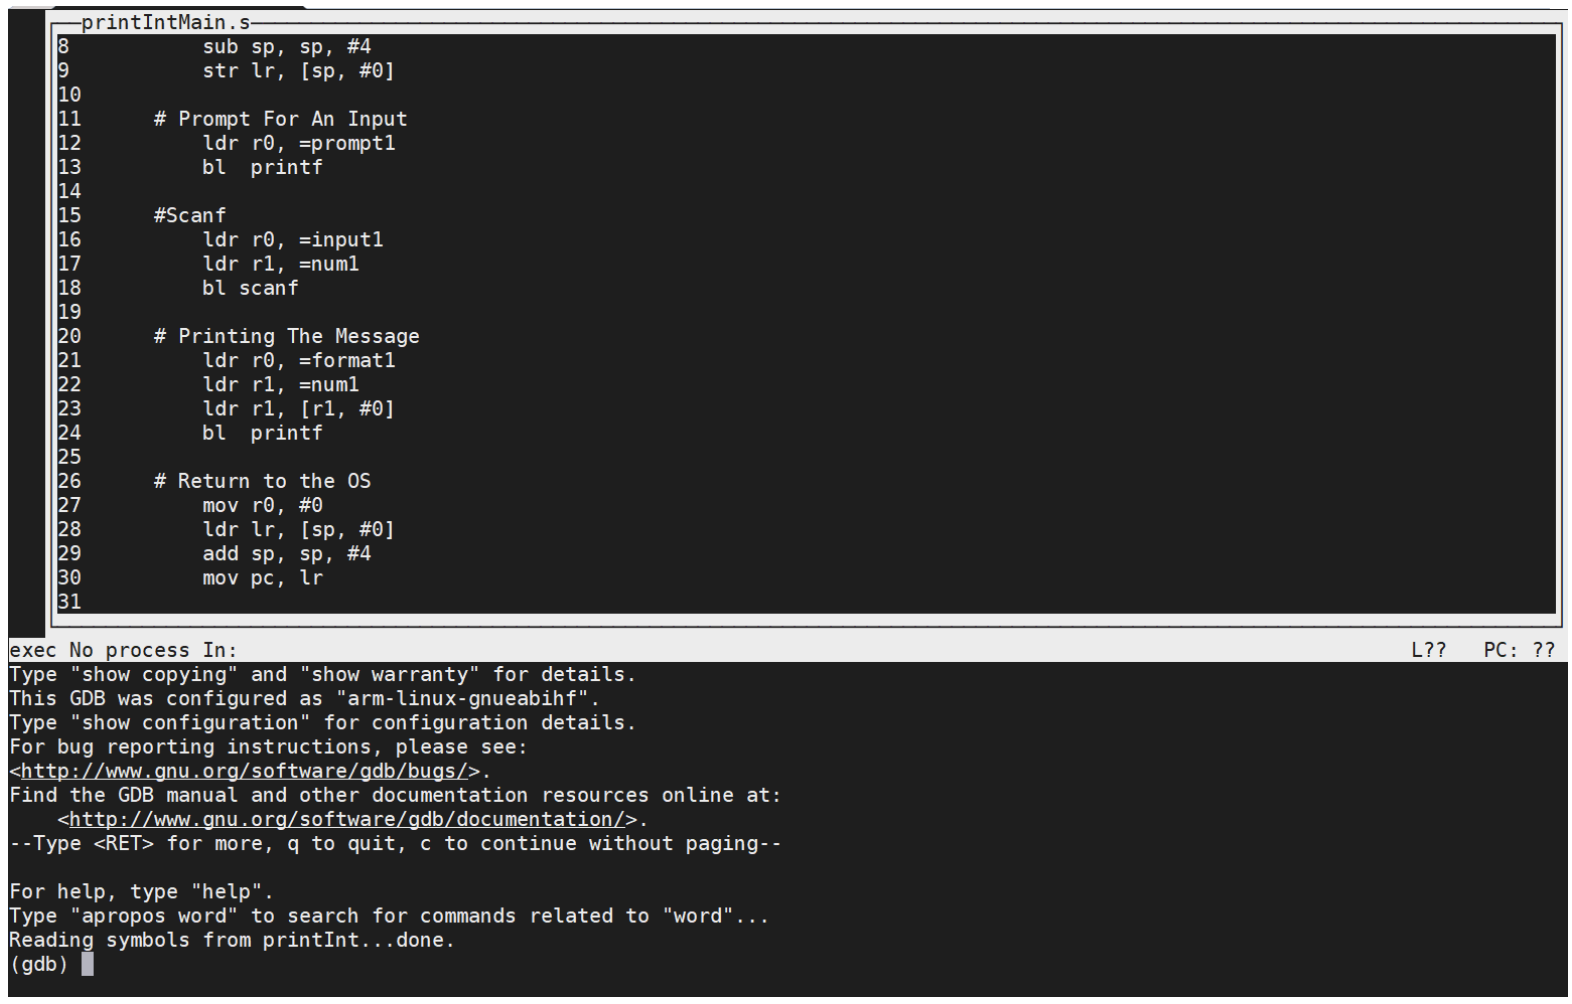
Figure 7: Initial gdb screen
The cursor and input are now focused at the bottom half of the screen, which is the command console. Type the following 3 commands to begin running the program in gdb:
    layout regs
    break main
    run
These 3 commands do the following:
- the layout regs command tells tui to show the values of all of the general purpose registers
- the break main command causes the gdb program to stop at the first line of code in your program
- the run command causes the gdb program to run the program to the break point at the first line of code in your file
Your screen should look similar to Figure 8, showing the registers at the top of the screen and that the program is paused at the breakpoint (B+> and highlighted line in the src code).
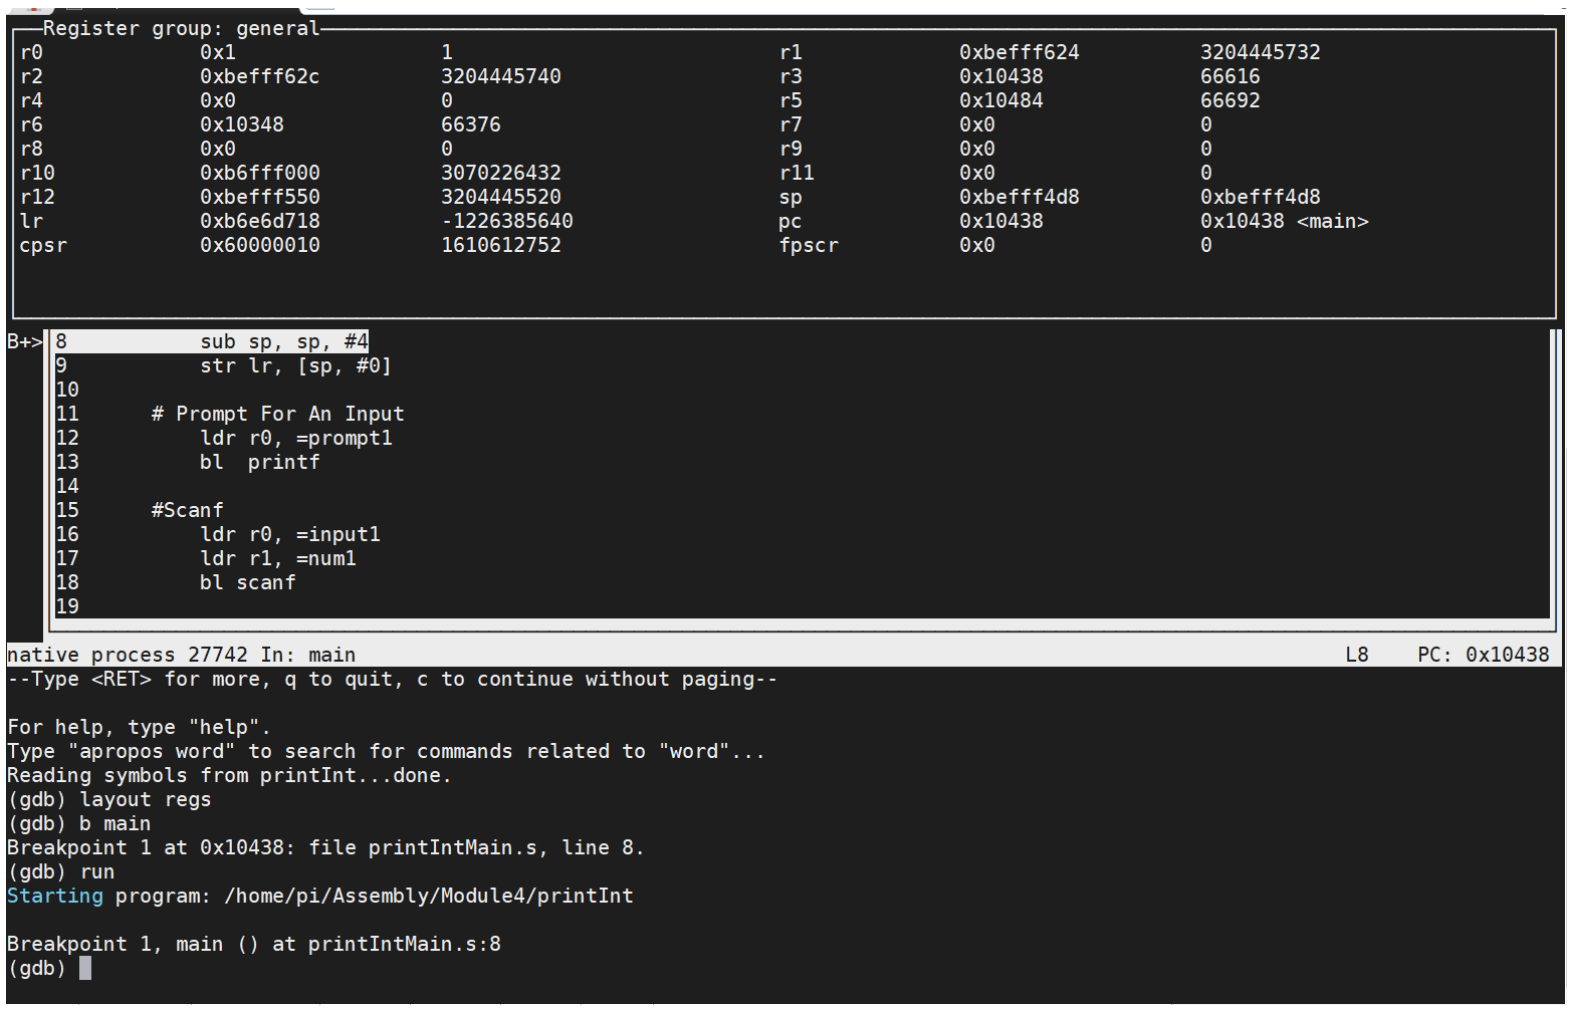
Figure 8: gdb screen with program paused at line 8 in main
The program can be advanced using the next command (type next or n and then enter), which will move the program to the next instruction. To repeat the last command that was run, only the Enter key needs to be pressed. You can move the program down through the source code a few statements to see this happening.
Now set a break point just before executing the scanf function. You can do this by typing b line#. In this case, the bl printf instruction is on line 18, so you would type b 18. Continue running your program by typing c (continue). When doing this command, the screen becomes messed up. This is a result of printing the string to enter the number. To reset the screen, type ctrl-l, (while holding down the control or apple key and typing the l character) which will redraw your screen.
The screen should now appear like Figure 9 with the program now ready to call scanf.
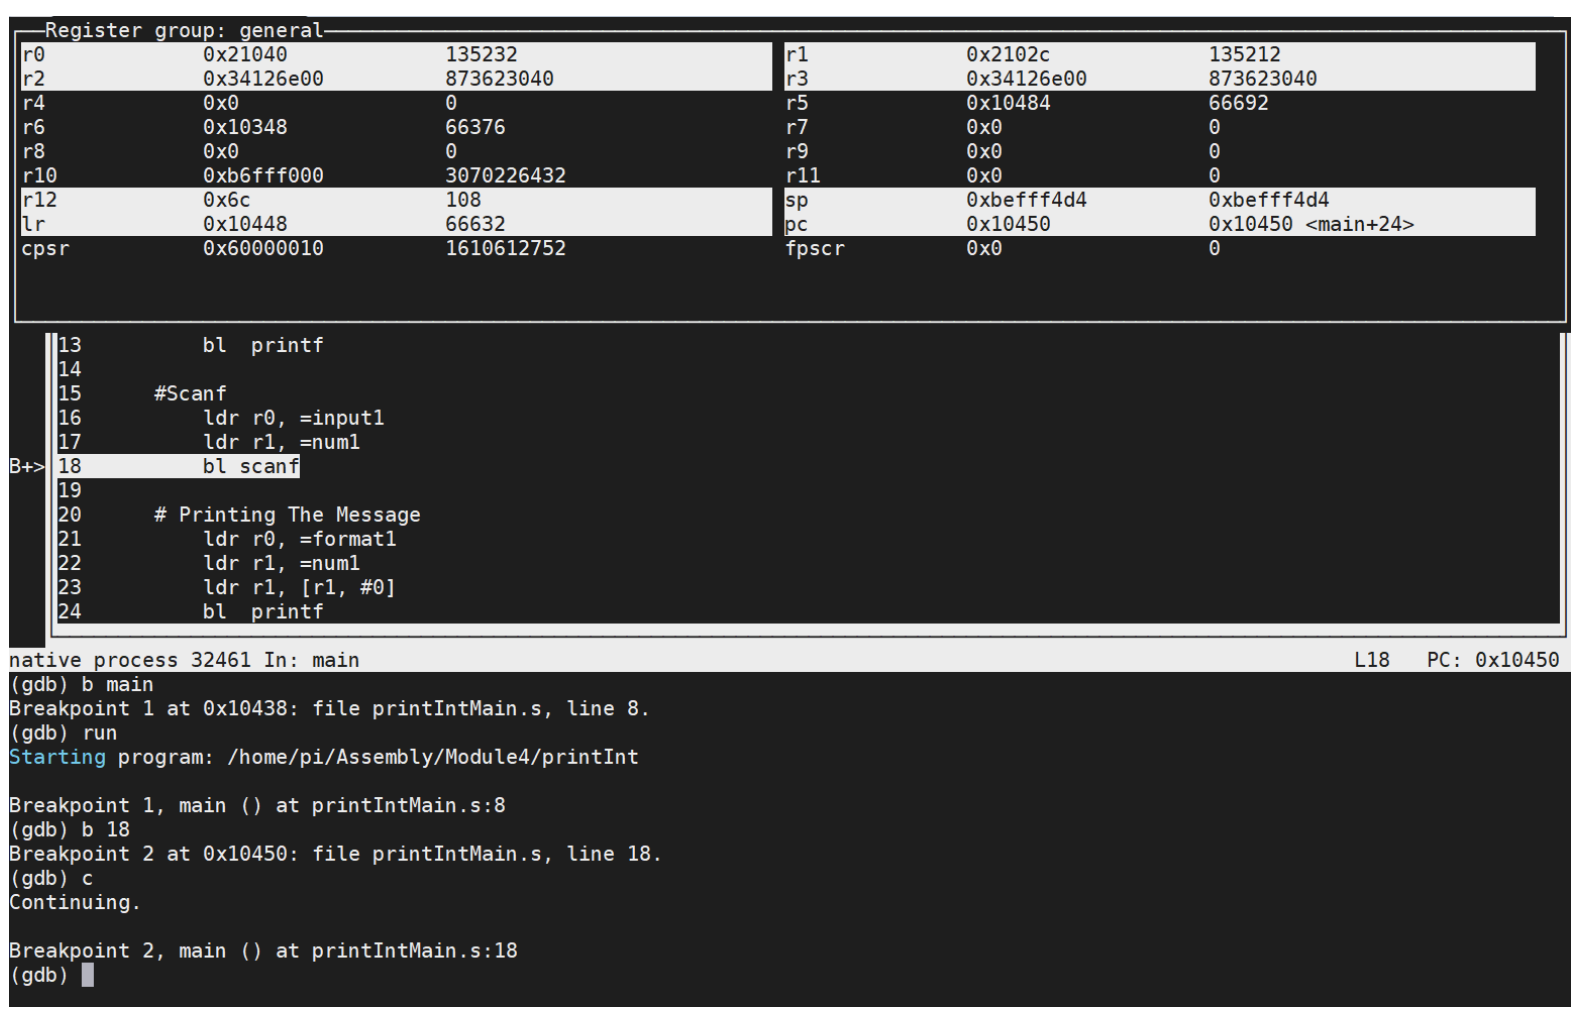
Figure 9: gdb immediately before the call to scanf
Before running scanf, examine the values in the program registers and variables. Looking at r0, you can see that it has loaded the address of the variable input as 0x21040. We can check that by typing print &input in the console to see the addresses match. To see the value at the address of input, the x (eXamine) command can be used. The command “x/s 0x21040” means examine the value at address 0x21040 and to interpret the answer as a string. When this command is run, the string printed out is “%d”, which is what we expect. This is shown in Figure 10.
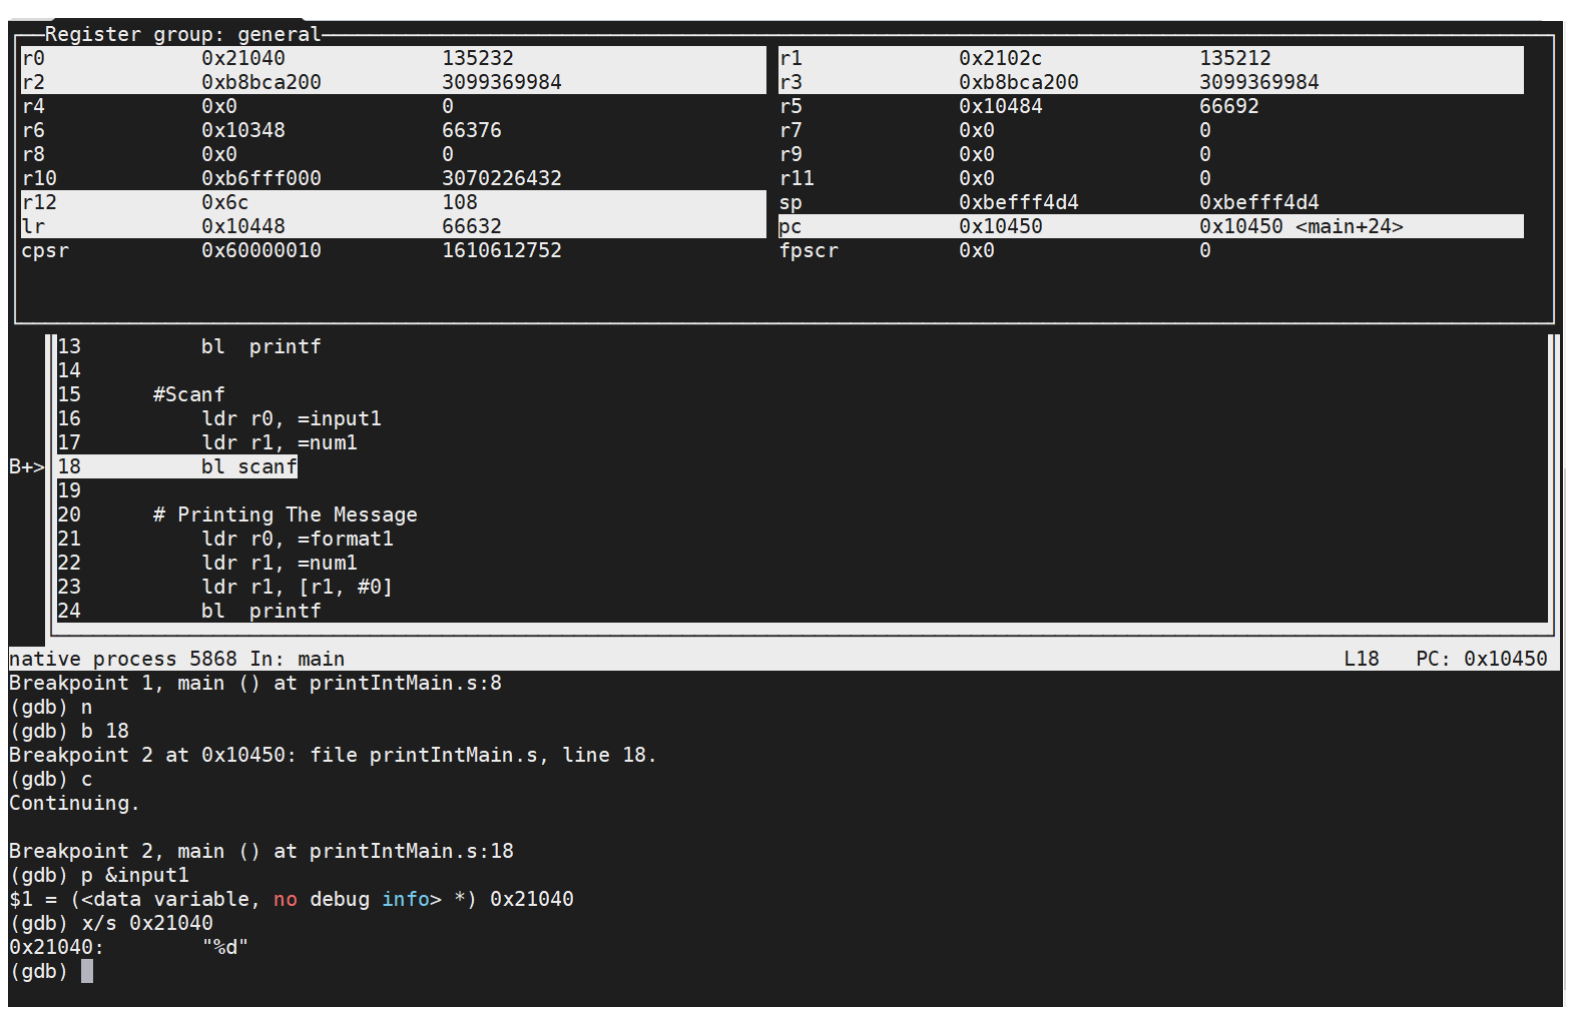
Figure 10: gdb showing addresses and values
These two commands, print and x, will be very useful in debugging programs. The print command will be used to get the address of labels, and x will be used for values at those addresses. Using the print command to retrieve the address of a label is always done by saying “print &label”, where label is the label you want to examine. While the print command can print out the value at the label, it is not as useful in assembly as in a HLL since there is no type information about the label in assembly, which is available in a HLL. A label is not an address, it is just a name for an address, so a label has no type information. Printing out the value of a label will simply give a hex value that the user will have to interpret. The x command is just more useful for printing out values as the format specifier allows a type to be applied to the value at the address. In addition, the x command can be used on any address, not just labels. Readers who want to make an equivalence between labels and variables will have a very difficult time until they come to the realization that a label is not a variable.
The format of the x command is:
x/nfs
where n is the number of times to repeat the x command, f is a format specifier, and s is the size of the data (in bytes) to be printed. If the string x/6d4 is specified, the next six four byte signed integers would be printed. This would be useful for an array of 6 integer values.
The formats of the x command are outlined in the following table.
|
Format Symbol |
Meaning |
|
x (default) |
Regard the bits of the value as an integer and print the integer in hexadecimal. |
|
d |
Print as integer in signed decimal. |
|
u |
Print as integer in unsigned decimal. |
|
o |
Print as integer in octal. |
|
t |
Print as integer in binary. The letter ‘t’ stands for "two". |
|
a |
Print as an address, both absolute in hexadecimal and as an offset from the nearest preceding symbol. You can use this format used to discover where (in what function) an unknown address is located. |
|
c |
Regard as an integer and print it as a character constant. |
|
f |
Regard the bits of the value as a floating point number and print using typical floating point syntax. |
|
s |
Regard the value as a null terminated string. |
Finally, to reference a register, use a dollar sign ($) suffix. For example, to print out the value of r0, use $r0. This will also work for the floating point (s) and double (d) registers.