
6.2: Program Execution with DDD
- Page ID
- 19891

To execute the program, click on the Run button from the command tool menu (shown below). Alternately, you can type run at the (gdb) prompt (bottom GDB console window). However, this will execute the program entirely and, when done, the results will be reset (and lost).
Setting Breakpoints
In order to control program execution, it will be necessary to set a breakpoint (execution pause location) to pause the program at a user selected location. This can be done by selecting the source location (line to stop at). For this example, we will stop at line 95.
The breakpoint can be done one of three ways:
- Right click on the line number and select: Set Breakpoint
- In the GDB Command Console, at the (gdb) prompt, type: break last
- In the GDB Command Console, at the (gdb) prompt, type: break 95
In the following example, line 94 is a label with no instruction. If a breakpoint is set on label, it will stop at the next executable instruction (line 95 in this example).
When set correctly, the “stop” icon will appear to the left of line number (as shown in the diagram).
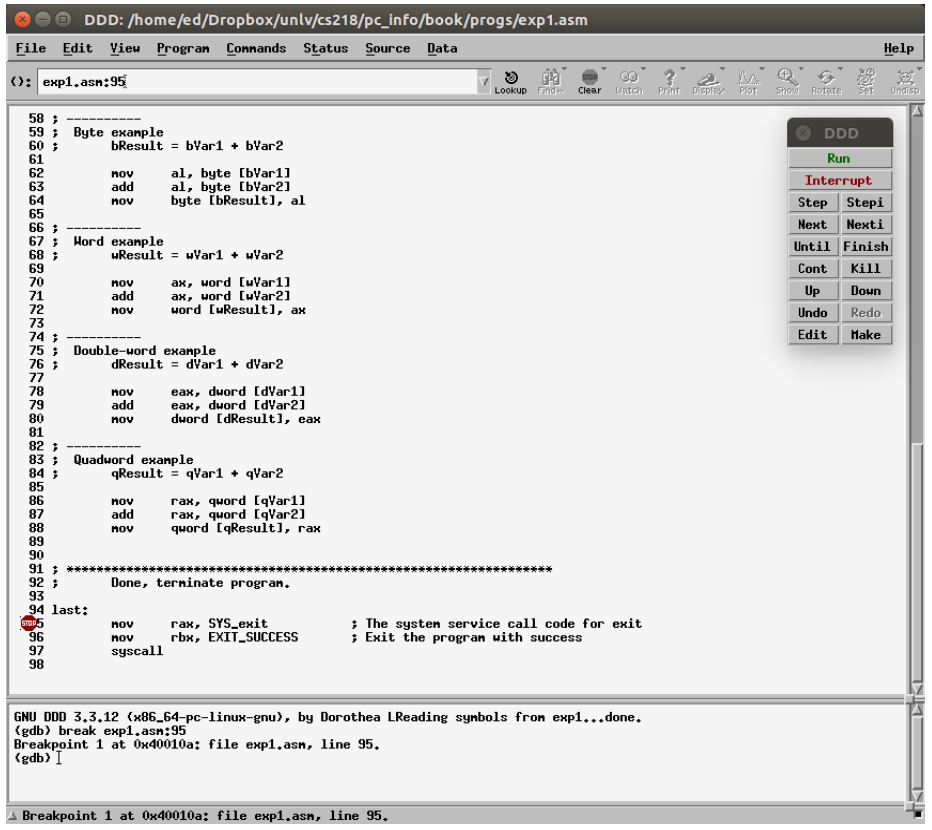
Illustration 10: Debugger Screen with Breakpoint Set
DDD/GDB commands can be typed inside the bottom window (at the (gdb) prompt) at any time. Multiple breakpoints can be set if desired.
Executing Programs
Once the debugger is started, in order to effectively use the debugger, an initial breakpoint must be set.
Once the breakpoint is set, the run command can be performed via clicking Run menu window or typing run at the (gdb) prompt. The program will execute up to, but not including the statement with the green arrow.
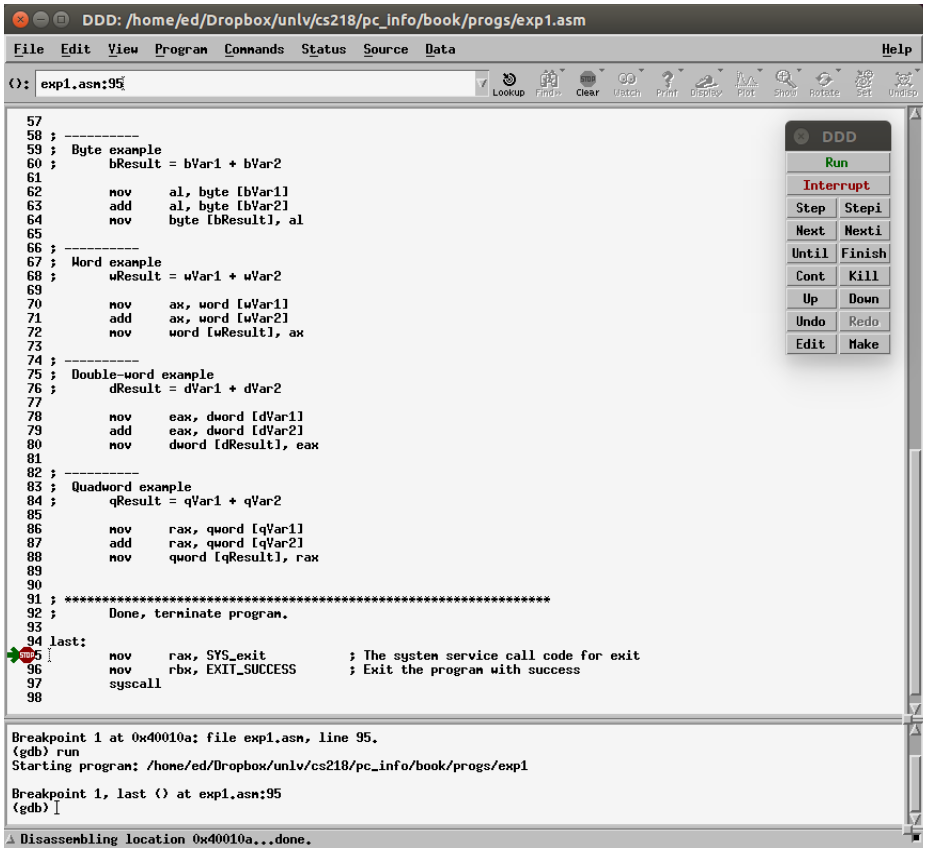
Illustration 11: Debugger Screen with Green Arrow
The breakpoint is indicated with the stop sign on the left and the current location is indicated with a green arrow (see example above). Specifically, the green arrow points to the next instruction to be executed. That is, the statement pointed to by the green arrow has not yet been executed.
Continue
As needed, additional breakpoints can be set. However, click the Run command will re-start execution from the beginning and stop at the initial breakpoint.
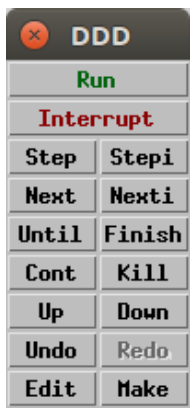
Illustration 12: DDD Command Bar
After the initial Run command, to continue to the next breakpoint, the continue command must be used (by clicking Cont menu window or typing cont at the (gdb) prompt). Single lines can also be executed one line at a time by typing the step or next commands (via clicking Step or Next menu window or typing step or next at the (gdb) prompt).
Step
The next command will execute to the next instruction. This includes executing an entire function if necessary. The step command will execute one step, stepping into functions if necessary. For a single, non-function instruction, there is no difference between the next and step commands.
Displaying Register Contents
The simplest method to see the contents of the registers is to use the registers window. The registers window is not displayed by default, but can be viewed by selecting Status \(\to\) Registers (from the top menu bar). When displayed, the register window will show register contents by register name (left column), in both hex (middle column) and unsigned decimal (right column). Since the right column will display the unsigned value of the entire register it can be confusing when the data is signed (as it will be displayed as unsigned). Additionally, for some registers, such as rbp and rsp, both columns are shown in hex (since they are typically used for addresses). The examine memory command will as described in the following sections allows a more specific control over what format (e.g., signed, unsigned, hex) in which to display values.
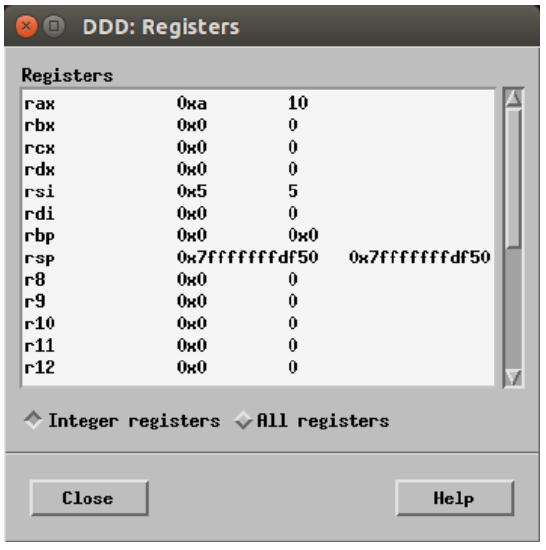
Illustration 13: Register Window
Depending on the machine and screen resolution, the register window may need to be resized to view the entire contents.
The third column of the register window generally shows the decimal quadword representation except for some special purpose registers (rbp and rsp). The signed quadword decimal representation may not always be meaningful. For example, if unsigned data is being used (such as addresses), the signed representation would be incorrect. Additionally, when character data is used, the signed representation would not be meaningful.
By default, only the integer registers are displayed. Clicking on the “All registers” box will add the floating-point registers to the display. Viewing will require scrolling down within the register window.
DDD/GDB Commands Summary
The following table provides a small subset of the most common DDD commands. When typed, most commands may be abbreviated. For example, quit can be abbreviated as q. The command and the abbreviation are shown in the table.
| Command | Description |
| quit | q | Quit the debugger. |
| break <label/addr> | b <label/addr> |
Set a break point (stop point) at <label> or <address>. |
| run <args> | r <args> | Execute the program (to the first breakpoint). |
| continue | c | Continue execution (to the next breakpoint). |
| continue <n> | c <n> | Continue execution (to the next breakpoint), skipping n-1 crossing of the breakpoint. This is can be used to quickly get to the n\(^{th}\) iteration of a loop. |
| step | s | Step into next instruction (i.e., steps into function/procedure calls). |
| next | n | Next instruction (steps through function/procedure calls). |
| F3 | Re-start program (and stop at first breakpoint). |
| where | Current activation (call depth). |
| x/<n><f><u> $rsp | Examine contents of the stack. |
| x/<n><f><u> &<variable> | Examine memory location <variable> <n> number of locations to display, 1 is default. <f> format: d-decimal (signed) x-hex u-decimal (unsigned) c-character s-string f-floating-point <u> unit size: b-byte (8-bits) h-halfword (16-bits) w-word (32-bits) g-giant (64-bits) |
| source <filename> | Read commands from file <filename>. |
| set logging file <filename> | Set logging file to <filename>, default is gdb.txt. |
| set logging on | Turn logging (to a file) on. |
| set logging off | Turn logging (to a file) off. |
| set logging overwrite | When logging (to a file) is turned on, overwrite previous log file (if any). |
More information can be obtained via the built-in help facility or from the documentation on the ddd website (referenced from Chapter 1).
DDD/GDB Commands, Examples
For example, given the below data declarations:
bnum1    db    5
wnum2    dw    -2000
dnum3    dd    100000
qnum     dq    1234567890
class    db    "Assembly", 0
twopi    dd    6.28
Assuming signed data, the commands to examine memory commands would be as follows:
x/db    &bnum1
x/dh    &wnum2
x/dw    &dnum3
x/dg    &qnum
x/s     &class
x/f     &twopi
If an inappropriate memory dump command is used (i.e., incorrect size), there is no error message and the debugger will display what was requested (even if it does not make sense). Examining variables will require use of the appropriate memory dump command based on the data declarations. Additional options can be accessed across the menu at the top of the screen.
To display an array in DDD, the basic examine memory command is used.
x/<n><f><u> &<variable>
For example, assuming the declaration of:
list1 dd 100001, -100002, 100003, 100004, 100005
The examine memory commands would be as follows:
x/5dw &list1
Where the 5 is the array length. The d indicates signed data (u would have been unsigned data). The w indicates 32-bit sized data (which is what the dd, define double, definition declares in the source file). The &list1 refers to the address of the variable. Note, the address points to the first element (and only the first element). As such, it is possible to display less or more elements that are actually declared in the array.
The basic examine memory command can be used with a memory address directly (as opposed to a variable name). For example:
x/dw 0x600d44
Addresses are typically displayed in hexadecimal, so a 0x would be required in order to
enter the hexadecimal address directly as shown.
Displaying Stack Contents
There are some occasions when displaying the contents of the stack may be useful. The stack is normally comprised of 64-bit, unsigned elements. The examine memory command is used, however the address is in the rsp register (not a variable name). The examine memory command to display the current top of the stack would be as follows:
x/ug $rsp
The examine memory command to display the top 6 items on the stack would be as follows:
x/6ug $rsp
Due to the stack implementation, the first item shown will always be current top of the stack.
Debugger Commands File (interactive)
Since the data display commands must be correct (since there is no error), it can be tedious. To help reduce errors, the correct execution and display command can be stored in a text file. The debugger can then read the commands from the file (instead of typing them by hand). While the results are typically displayed to the screen, the results can be redirected to an output file. This can be useful for easy review.
For example, some typical debugger commands to set the breakpoint, run the program, display some variables, and redirect the output to a log file might be as follows:
     #------------------------------------
     #  Debugger Input Script
     #------------------------------------
     echo \n\n
     break last
     run
     set pagination off
     set logging file out.txt
     set logging overwrite
     set logging on
     set prompt
     echo ------------------------------------ \n
     echo display variables \n
     echo \n
     x/100dw &list
     x/dw &length
     echo \n
     x/dw &listMin
     x/dw &listMid
     x/dw &listMax
     x/dw &listSum
     x/dw &listAve
     echo \n \n
     set logging off
     quit
Note 1; this example assumes a label 'last' is defined in the source program (as is done on the example program).
Note 2; this example exits the debugger. If that is not desired, the 'quit' command can be removed. When exiting from the input file, the debugger may request user confirmation of the exit (yes or no).
These commands should be placed in a file (such as gdbIn.txt), so they can be read from within the debugger.
Debugger Commands File (non-interactive)
The debugger command to read a file is ''source <filename>''. For example, if the command file is named gdbIn.txt,
(gdb) source gdbIn.txt
Based on the above commands, the output will be placed in the file out.txt. The output file name can be changed as desired.
Each program will require a custom set of input command based on the specific variables and associated sizes in that program. The debugger input commands file will only be useful when the program is fairly close to working. Program crashes and other more significant errors will require interactive debugging to determine the specific error or errors.
Debugger Commands File (non-interactive)
It is possible to obtain the output file directly without an interactive DDD session. The following command, entered at the command line, will execute the command in the input file on the given program, create the output file, and exit the program.
gbd <gdbIn.txt prog
Which will create the output file (as specified in the gdbIn.txt input file) and exit the debugger. Once the input file is created, this is the fastest option for obtaining the final output file for a working program. Again, this would only be useful if the program is working or very close to working correctly.