
4.4: Study the Exceptional Entities
- Page ID
- 32382

\( \newcommand{\vecs}[1]{\overset { \scriptstyle \rightharpoonup} {\mathbf{#1}} } \)
\( \newcommand{\vecd}[1]{\overset{-\!-\!\rightharpoonup}{\vphantom{a}\smash {#1}}} \)
\( \newcommand{\id}{\mathrm{id}}\) \( \newcommand{\Span}{\mathrm{span}}\)
( \newcommand{\kernel}{\mathrm{null}\,}\) \( \newcommand{\range}{\mathrm{range}\,}\)
\( \newcommand{\RealPart}{\mathrm{Re}}\) \( \newcommand{\ImaginaryPart}{\mathrm{Im}}\)
\( \newcommand{\Argument}{\mathrm{Arg}}\) \( \newcommand{\norm}[1]{\| #1 \|}\)
\( \newcommand{\inner}[2]{\langle #1, #2 \rangle}\)
\( \newcommand{\Span}{\mathrm{span}}\)
\( \newcommand{\id}{\mathrm{id}}\)
\( \newcommand{\Span}{\mathrm{span}}\)
\( \newcommand{\kernel}{\mathrm{null}\,}\)
\( \newcommand{\range}{\mathrm{range}\,}\)
\( \newcommand{\RealPart}{\mathrm{Re}}\)
\( \newcommand{\ImaginaryPart}{\mathrm{Im}}\)
\( \newcommand{\Argument}{\mathrm{Arg}}\)
\( \newcommand{\norm}[1]{\| #1 \|}\)
\( \newcommand{\inner}[2]{\langle #1, #2 \rangle}\)
\( \newcommand{\Span}{\mathrm{span}}\) \( \newcommand{\AA}{\unicode[.8,0]{x212B}}\)
\( \newcommand{\vectorA}[1]{\vec{#1}} % arrow\)
\( \newcommand{\vectorAt}[1]{\vec{\text{#1}}} % arrow\)
\( \newcommand{\vectorB}[1]{\overset { \scriptstyle \rightharpoonup} {\mathbf{#1}} } \)
\( \newcommand{\vectorC}[1]{\textbf{#1}} \)
\( \newcommand{\vectorD}[1]{\overrightarrow{#1}} \)
\( \newcommand{\vectorDt}[1]{\overrightarrow{\text{#1}}} \)
\( \newcommand{\vectE}[1]{\overset{-\!-\!\rightharpoonup}{\vphantom{a}\smash{\mathbf {#1}}}} \)
\( \newcommand{\vecs}[1]{\overset { \scriptstyle \rightharpoonup} {\mathbf{#1}} } \)
\( \newcommand{\vecd}[1]{\overset{-\!-\!\rightharpoonup}{\vphantom{a}\smash {#1}}} \)
\(\newcommand{\avec}{\mathbf a}\) \(\newcommand{\bvec}{\mathbf b}\) \(\newcommand{\cvec}{\mathbf c}\) \(\newcommand{\dvec}{\mathbf d}\) \(\newcommand{\dtil}{\widetilde{\mathbf d}}\) \(\newcommand{\evec}{\mathbf e}\) \(\newcommand{\fvec}{\mathbf f}\) \(\newcommand{\nvec}{\mathbf n}\) \(\newcommand{\pvec}{\mathbf p}\) \(\newcommand{\qvec}{\mathbf q}\) \(\newcommand{\svec}{\mathbf s}\) \(\newcommand{\tvec}{\mathbf t}\) \(\newcommand{\uvec}{\mathbf u}\) \(\newcommand{\vvec}{\mathbf v}\) \(\newcommand{\wvec}{\mathbf w}\) \(\newcommand{\xvec}{\mathbf x}\) \(\newcommand{\yvec}{\mathbf y}\) \(\newcommand{\zvec}{\mathbf z}\) \(\newcommand{\rvec}{\mathbf r}\) \(\newcommand{\mvec}{\mathbf m}\) \(\newcommand{\zerovec}{\mathbf 0}\) \(\newcommand{\onevec}{\mathbf 1}\) \(\newcommand{\real}{\mathbb R}\) \(\newcommand{\twovec}[2]{\left[\begin{array}{r}#1 \\ #2 \end{array}\right]}\) \(\newcommand{\ctwovec}[2]{\left[\begin{array}{c}#1 \\ #2 \end{array}\right]}\) \(\newcommand{\threevec}[3]{\left[\begin{array}{r}#1 \\ #2 \\ #3 \end{array}\right]}\) \(\newcommand{\cthreevec}[3]{\left[\begin{array}{c}#1 \\ #2 \\ #3 \end{array}\right]}\) \(\newcommand{\fourvec}[4]{\left[\begin{array}{r}#1 \\ #2 \\ #3 \\ #4 \end{array}\right]}\) \(\newcommand{\cfourvec}[4]{\left[\begin{array}{c}#1 \\ #2 \\ #3 \\ #4 \end{array}\right]}\) \(\newcommand{\fivevec}[5]{\left[\begin{array}{r}#1 \\ #2 \\ #3 \\ #4 \\ #5 \\ \end{array}\right]}\) \(\newcommand{\cfivevec}[5]{\left[\begin{array}{c}#1 \\ #2 \\ #3 \\ #4 \\ #5 \\ \end{array}\right]}\) \(\newcommand{\mattwo}[4]{\left[\begin{array}{rr}#1 \amp #2 \\ #3 \amp #4 \\ \end{array}\right]}\) \(\newcommand{\laspan}[1]{\text{Span}\{#1\}}\) \(\newcommand{\bcal}{\cal B}\) \(\newcommand{\ccal}{\cal C}\) \(\newcommand{\scal}{\cal S}\) \(\newcommand{\wcal}{\cal W}\) \(\newcommand{\ecal}{\cal E}\) \(\newcommand{\coords}[2]{\left\{#1\right\}_{#2}}\) \(\newcommand{\gray}[1]{\color{gray}{#1}}\) \(\newcommand{\lgray}[1]{\color{lightgray}{#1}}\) \(\newcommand{\rank}{\operatorname{rank}}\) \(\newcommand{\row}{\text{Row}}\) \(\newcommand{\col}{\text{Col}}\) \(\renewcommand{\row}{\text{Row}}\) \(\newcommand{\nul}{\text{Nul}}\) \(\newcommand{\var}{\text{Var}}\) \(\newcommand{\corr}{\text{corr}}\) \(\newcommand{\len}[1]{\left|#1\right|}\) \(\newcommand{\bbar}{\overline{\bvec}}\) \(\newcommand{\bhat}{\widehat{\bvec}}\) \(\newcommand{\bperp}{\bvec^\perp}\) \(\newcommand{\xhat}{\widehat{\xvec}}\) \(\newcommand{\vhat}{\widehat{\vvec}}\) \(\newcommand{\uhat}{\widehat{\uvec}}\) \(\newcommand{\what}{\widehat{\wvec}}\) \(\newcommand{\Sighat}{\widehat{\Sigma}}\) \(\newcommand{\lt}{<}\) \(\newcommand{\gt}{>}\) \(\newcommand{\amp}{&}\) \(\definecolor{fillinmathshade}{gray}{0.9}\)Intent Identify potential design problems by collecting measurements and studying the exceptional values.
Problem
How can you quickly identify potential design problems in large software systems?
This problem is difficult because:
- There is no easy way to discern problematic from good designs. Assessing the quality of a design must be done in the terms of the problem it tries to solve, thus can never be inferred from the design alone.
- To confirm that a piece of code represents a design problem, you must first unravel its inner structure. With problematic code this is typically quite difficult.
- The system is large, thus a detailed assessment of the design quality of every piece of code is not feasible.
Yet, solving this problem is feasible because:
- You have a metrics tool at your disposal, so you can quickly collect a number of measurements about the entities in the source-code.
- You have a rough understanding of the system’s functionality (for example obtained via First Contact), so you can assess the quality of the design in the system context.
- You have the necessary tools to browse the source-code, so you can verify manually whether certain entities are indeed a problem.
Solution
Measure the structural entities forming the software system (i.e., the inheritance hierarchy, the packages, the classes and the methods) and look for exceptions in the quantitative data you collected. Verify manually whether these anomalies represent design problems.
Hints
Identifying problematic designs in a software system via measurements is a delicate activity which requires expertise in both data collection and interpretation. Below are some hints you might consider to get the best out of the raw numbers.
- Which tool to use? There are many tools — commercial as well as public domain — which measure various attributes of source code entities. Nevertheless, few development teams make regular use of such tools and therefore it is likely that you will have to look for a metrics tool before applying this pattern.
In principle, start by looking at the tools used by the development team and see whether they can be used to collect data about the code. For instance, a code verification tool such as lint can serve as basis for your measurements. Start looking for a metrics tool only when none of the development tools currently in use may collect data for you. If that’s the case, simplicity should be your main tool adoption criterion as you do not want to spend your precious time on installing and learning. The second tool adoption criterion is how easy the metrics tool integrates with the other development tools in use. - Which metrics to collect? In general, it is better to stick to the simple metrics, as the more complex ones involve more computation, yet will rarely perform better.
For instance, to identify large methods it is sufficient to count the lines of code by counting all carriage returns or new-lines. Most other method size metrics require some form of parsing and this effort is usually not worth the gain. - Which metric variants to use? Usually, it does not make a lot of difference which metric variant is chosen, as long as the choice is clearly stated and applied consistently. Here as well, it is preferable to choose the most simple variant, unless you have a good reason to do otherwise.
For instance, while counting the lines of code, you should decide whether to include or exclude comment lines, or whether you count the lines after the source code has been normalized via pretty printing. However, when looking for potential design problems it usually does not pay off to do the extra effort of excluding comment lines or normalizing the source code. - Which thresholds to apply? Due to the need for reliability, it is better not to apply thresholds.1 First of all, because selecting threshold values must be done based on the coding standards applied in the development team and these you do not necessarily have access to. Second, thresholds will distort your perspective on the anomalies inside the system as you will not know how many normal entities there are.
- How to interpret the results? An anomaly is not necessarily problematic, so care must be taken when interpreting the measurement data. To assess whether an entity is indeed problematic, it is a good idea to simultaneously inspect different measurements for the same entity. For instance, do not limit yourself to the study of large classes, but combine the size of the class with the number of subclasses and the number of superclasses, because this says something about where the class is located in the class hierarchy.
However, formulas that combine different measurements in a single number should be avoided as you loose the sense for the constituting elements. Therefore it is better to present the results in a table, where the first column shows the name of the entity, and the remaining columns show the different measurement data. Sorting these tables according to the different measurement columns will help you to identify exceptional values. - How to identify anomalies quickly? Although it is possible to identify exceptional values in a tabular representations of measurement data, such an approach is tedious and error-prone. Most metric tools include some visualization features (histograms, scatter plots, ...) to help you scan large volumes of measurements and this is usually a better way to quickly focus on potential design problems.
- Should I browse the code afterwards? Measurements alone cannot determine whether a entity is truly problematic: some human assessment is always necessary. Metrics are a great aid in quickly identifying entities that are potential problems but code browsing is necessary for confirmation. Note that large entities are usually quite complicated, thus understanding the corresponding source code may prove to be difficult.
- What about normal entities? Experienced programmers tend to distribute important functionality over a number of well-designed components. Conversely, exceptional entities are quite often irrelevant as truly important code would have been refactored. Therefore, you should be aware that you are only applying a heuristic: its possible that you are studying code which does not represent a design problem simply because it is deemed unimportant.
Tradeoffs
Pros
- Scales well. Metrics are readily applicable to large scale systems, mainly because with metric tools about 20% of all the entities require further investigation. When different metrics are combined properly (preferably using some form of visualization) one can deduce quite rapidly which parts of the system represent potential design problems.
- Overview mode is appealing. With proper tool support you can produce visual representations of the metrics data that provide immediate insight into the good as well as the problematic parts of the design.
Cons
- Results are inaccurate. Some of the entities having exceptional measurements will turn out not to be problematic. Metrics are only a heuristic and false positives are likely to occur. Moreover, the metric may reveal problems that are not worth solving because the solutions will not contribute to your reengineering goal. Unfortunately, this you will only know after you analyzed the source code.
- Missing priorities. Identifying a potential problem is easy, the real difficult part is assessing the severity of the problem. Especially during a reengineering project, you identify far more problems than you have time to solve. Prioritizing the list requires a good understanding of both the system and the reengineering project.
Difficulties
- Data is tedious to interpret. To measure the quality of a piece of code, you must collect several measurements. Interpreting and comparing such multi-valued tuples is quite tedious especially when dealing with large software systems. Therefore, use visualizations which allow you to analyze different measurements simultaneously.
- Requires expertise. The interpretation of measurement data is difficult and requires a lot of expertise. Fortunately, part of this expertise is documented in the form of design heuristics (see among others [Rie96] [LK94]) and the rest can be acquired on the job.

Example
The analysis of the database and the design of XDoctor was quite reassuring. Although there were some things to improve, the overall quality was quite good. Yet, you want to confirm this feeling and therefore plan to collect a number of quality metrics and visualize them. (Of course the visualization can be done with ordinary spreadsheets, but in this case you decide to use the CodeCrawler tool [DDL99] [Lan99].)
Class Size Overview. As a starter, you get an impression of the raw physical size of all the classes constituting XDoctor. You measure the class size in terms of number of lines of code (LOC) and number of instance variables (NIV) and use a checkers graph to show the relative proportion of the sizes. In such a graph all nodes are shown as squares where the size of the square is proportional to one size (here LOC) and the gray value is proportional to another size (here NIV).
Figure \(\PageIndex{1}\) shows the checker graph for XDoctor. The picture reveals that the class size is distributed quite evenly — which is reassuring — with a few noteworthy exceptions. For instance, there is the class B (with 1495 it is the largest in terms of lines of code) and class L (has most instance variables and second most lines of code). The classes in row Z are exceptional in the sense that they are very small, some of them even empty.
Class Inheritance. Next, you get a feeling for the way inheritance is used by studying the various subtrees in the inheritance hierarchy. Therefore, you measure the classes in terms of hierarchy nesting level (HNL) and number of descendant classes (NDC). You include size measurements as well to assess the magnitude of the classes within the inheritance tree. Therefore, you collect the number of methods (NOM), number of instance variables (NIV) and number of lines of code (LOC) as well. You use an inheritance tree to visualize the various subtrees and the proportion of class sizes inside each of them. All nodes in such a tree have a rectangular shape where the height, width and gray value of each node show three measurements.
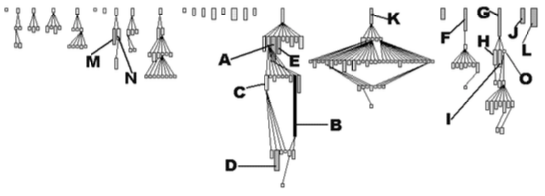
Figure \(\PageIndex{2}\) shows such an inheritance tree for XDoctor, where the height, width and gray value of each node represent NOM, NIV and LOC. To the left, you observe several normal inheritance trees, namely small ones where the size of the classes is quite similar. One exceptional value is the same B you noticed earlier, however you now see that it also has a large superclass A (defining 70 methods), making it even more suspicious. The L you’ve seen before appears here as a solitary class. The hierarchies rooted in K, F and G seem quite interesting: they go deep (4 levels of inheritance) and have one large root class plus many smaller subclasses. H and I, plus M and N are both cases of large sibling classes, which may imply that too little is inherited from the common superclass. This must be verified via code browsing however.
Method Inheritance. To analyze particular inheritance trees in further detail, you investigate how methods in a subclass relate to methods in their superclass. Therefore, you produce a table showing for each class the number of methods overriding a method defined in a superclass (NMO), the number of methods added to the superclass (NMA) and the number of methods extending a method defined in a superclass (NME). Here as well you use an inheritance tree to identify exceptional values in the measurements.
Figure \(\PageIndex{3}\) shows the A, G and F subtrees identified earlier, but now the height, width and gray value of each node represent NMO, NMA and NME. The root classes are displayed as narrow white rectangles, which is normal as root classes cannot override nor extend. As far as the subclasses concerns, you observe two phenomena. On the one hand, the subclasses of A add a lot, yet override very little, which suggests that code reuse is the main purpose of this inheritance tree. On the other hand, the subclasses of F and G override more methods than they add, which suggests a lot of hook methods and an inheritance tree aimed at specializing behavior. Here as well, these assumptions must be verified by code browsing.

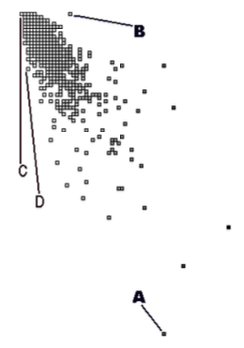
Method Size Overview. An example of how to identify potential problems in the method bodies concerns the ratio of lines of code (LOC) and the number of messages sent (MSG). In most method bodies, these two measurements will correlate but methods where this correlation does not hold typically represent special code.
To study this correlation relationship one might divide the two measurements.2 However, then you lose the sense for the constituting measurements which makes interpretation difficult. Therefore, you visualize the relationship by means of a correlation graph, where each method is shown as a small square and where the x, y position shows the measurements that are supposed to correlate. In such a graph, the nodes where the measurements correlate cluster around a diagonal, while the exceptions are from the diagonal.
Figure \(\PageIndex{4}\) shows a correlation graph where the horizontal axis (left to right) represents the number of messages sent and the vertical axis (top to bottom) the number of lines of code. You observe a big cluster in the top left corner where most nodes are superimposed on each other. This is reassuring because it implies that most methods have fewer than 15 lines of code and 10 messages sent. The exceptions appear at the edges of the picture. For instance, node A is a large method with 99 messages packed on 45 lines of code. Node D (and its neighbors) are also methods where many messages are packed on a single line of code. Via code browsing you see that many of them are initialization methods. At the other side of the diagonal there is node B, which represents a method with 16 lines of code yet no messages sent. Code browsing reveals that it’s a case where the whole method body has been commented out.
Rationale
In several places in the literature it is mentioned that measuring source code helps in problem identification (see among others, [LK94] [FP96] [MLM96] [Nes88]). Most metric tools applied during these experiments visualize information by means of histograms and Kiviat diagrams. However, few research have studied the impact of thresholds while identifying exceptional entities; our own experience is that thresholds don’t really matter [DD99].
Unfortunately, the current research is inconclusive with regards to the accuracy of the results. Up until now, no experiments exist that count how many problems remain undiscovered, nor is there any work on assessing the severity of the problems discovered. As such it is impossible to assess the reliability of metrics for reverse engineering.
Known Uses
During the FAMOOS project one event provided anecdotal evidence for how well a simple approach may outperform more specialized and complex approaches. Once we visited a business unit for a few days to demonstrate our CodeCrawler tool. At first the developers were quite skeptical because they felt like they would see “yet another metrics tool”. The first surprise came when we showed them results already during the first day. They told us that other tools would typically require several days configuration time before they could parse their C++ code because it made such heavy use of special C++ features and macros. Moreover, and this was the second surprise, this simplicity did not diminish the quality of our results. The programmers confirmed most of the design anomalies we discovered, yet were intrigued by some observations we made. During the subsequent discussions they at least considered design alternatives.
What Next
Applying this pattern will result in an overall impression of design quality and the identification of a few potential design problems. With this knowledge you should at least reconsider whether the goal of your reengineering project is still attainable. If it is, you will probably want to solve some of these design problems, for instance using patterns in Redistribute Responsibilities and Transform Conditionals to Polymorphism. Solving some of these problems may require a more detailed understanding of that design, which may be obtained by patterns in Detailed Model Capture.
Footnotes
- Most metric tools allow you to focus on special entities by specifying some threshold interval and then only displaying those entities where the measurements fall into that interval.
- Metrics theory prohibits arbitrary manipulations of numbers; one should first verify whether the scale of the measurement permits the calculation [FP96]. However, both are counting measurements having a ratio scale and then division is permitted.