
8.3: Visualize Code as Dotplots
- Page ID
- 32409

\( \newcommand{\vecs}[1]{\overset { \scriptstyle \rightharpoonup} {\mathbf{#1}} } \)
\( \newcommand{\vecd}[1]{\overset{-\!-\!\rightharpoonup}{\vphantom{a}\smash {#1}}} \)
\( \newcommand{\id}{\mathrm{id}}\) \( \newcommand{\Span}{\mathrm{span}}\)
( \newcommand{\kernel}{\mathrm{null}\,}\) \( \newcommand{\range}{\mathrm{range}\,}\)
\( \newcommand{\RealPart}{\mathrm{Re}}\) \( \newcommand{\ImaginaryPart}{\mathrm{Im}}\)
\( \newcommand{\Argument}{\mathrm{Arg}}\) \( \newcommand{\norm}[1]{\| #1 \|}\)
\( \newcommand{\inner}[2]{\langle #1, #2 \rangle}\)
\( \newcommand{\Span}{\mathrm{span}}\)
\( \newcommand{\id}{\mathrm{id}}\)
\( \newcommand{\Span}{\mathrm{span}}\)
\( \newcommand{\kernel}{\mathrm{null}\,}\)
\( \newcommand{\range}{\mathrm{range}\,}\)
\( \newcommand{\RealPart}{\mathrm{Re}}\)
\( \newcommand{\ImaginaryPart}{\mathrm{Im}}\)
\( \newcommand{\Argument}{\mathrm{Arg}}\)
\( \newcommand{\norm}[1]{\| #1 \|}\)
\( \newcommand{\inner}[2]{\langle #1, #2 \rangle}\)
\( \newcommand{\Span}{\mathrm{span}}\) \( \newcommand{\AA}{\unicode[.8,0]{x212B}}\)
\( \newcommand{\vectorA}[1]{\vec{#1}} % arrow\)
\( \newcommand{\vectorAt}[1]{\vec{\text{#1}}} % arrow\)
\( \newcommand{\vectorB}[1]{\overset { \scriptstyle \rightharpoonup} {\mathbf{#1}} } \)
\( \newcommand{\vectorC}[1]{\textbf{#1}} \)
\( \newcommand{\vectorD}[1]{\overrightarrow{#1}} \)
\( \newcommand{\vectorDt}[1]{\overrightarrow{\text{#1}}} \)
\( \newcommand{\vectE}[1]{\overset{-\!-\!\rightharpoonup}{\vphantom{a}\smash{\mathbf {#1}}}} \)
\( \newcommand{\vecs}[1]{\overset { \scriptstyle \rightharpoonup} {\mathbf{#1}} } \)
\( \newcommand{\vecd}[1]{\overset{-\!-\!\rightharpoonup}{\vphantom{a}\smash {#1}}} \)
\(\newcommand{\avec}{\mathbf a}\) \(\newcommand{\bvec}{\mathbf b}\) \(\newcommand{\cvec}{\mathbf c}\) \(\newcommand{\dvec}{\mathbf d}\) \(\newcommand{\dtil}{\widetilde{\mathbf d}}\) \(\newcommand{\evec}{\mathbf e}\) \(\newcommand{\fvec}{\mathbf f}\) \(\newcommand{\nvec}{\mathbf n}\) \(\newcommand{\pvec}{\mathbf p}\) \(\newcommand{\qvec}{\mathbf q}\) \(\newcommand{\svec}{\mathbf s}\) \(\newcommand{\tvec}{\mathbf t}\) \(\newcommand{\uvec}{\mathbf u}\) \(\newcommand{\vvec}{\mathbf v}\) \(\newcommand{\wvec}{\mathbf w}\) \(\newcommand{\xvec}{\mathbf x}\) \(\newcommand{\yvec}{\mathbf y}\) \(\newcommand{\zvec}{\mathbf z}\) \(\newcommand{\rvec}{\mathbf r}\) \(\newcommand{\mvec}{\mathbf m}\) \(\newcommand{\zerovec}{\mathbf 0}\) \(\newcommand{\onevec}{\mathbf 1}\) \(\newcommand{\real}{\mathbb R}\) \(\newcommand{\twovec}[2]{\left[\begin{array}{r}#1 \\ #2 \end{array}\right]}\) \(\newcommand{\ctwovec}[2]{\left[\begin{array}{c}#1 \\ #2 \end{array}\right]}\) \(\newcommand{\threevec}[3]{\left[\begin{array}{r}#1 \\ #2 \\ #3 \end{array}\right]}\) \(\newcommand{\cthreevec}[3]{\left[\begin{array}{c}#1 \\ #2 \\ #3 \end{array}\right]}\) \(\newcommand{\fourvec}[4]{\left[\begin{array}{r}#1 \\ #2 \\ #3 \\ #4 \end{array}\right]}\) \(\newcommand{\cfourvec}[4]{\left[\begin{array}{c}#1 \\ #2 \\ #3 \\ #4 \end{array}\right]}\) \(\newcommand{\fivevec}[5]{\left[\begin{array}{r}#1 \\ #2 \\ #3 \\ #4 \\ #5 \\ \end{array}\right]}\) \(\newcommand{\cfivevec}[5]{\left[\begin{array}{c}#1 \\ #2 \\ #3 \\ #4 \\ #5 \\ \end{array}\right]}\) \(\newcommand{\mattwo}[4]{\left[\begin{array}{rr}#1 \amp #2 \\ #3 \amp #4 \\ \end{array}\right]}\) \(\newcommand{\laspan}[1]{\text{Span}\{#1\}}\) \(\newcommand{\bcal}{\cal B}\) \(\newcommand{\ccal}{\cal C}\) \(\newcommand{\scal}{\cal S}\) \(\newcommand{\wcal}{\cal W}\) \(\newcommand{\ecal}{\cal E}\) \(\newcommand{\coords}[2]{\left\{#1\right\}_{#2}}\) \(\newcommand{\gray}[1]{\color{gray}{#1}}\) \(\newcommand{\lgray}[1]{\color{lightgray}{#1}}\) \(\newcommand{\rank}{\operatorname{rank}}\) \(\newcommand{\row}{\text{Row}}\) \(\newcommand{\col}{\text{Col}}\) \(\renewcommand{\row}{\text{Row}}\) \(\newcommand{\nul}{\text{Nul}}\) \(\newcommand{\var}{\text{Var}}\) \(\newcommand{\corr}{\text{corr}}\) \(\newcommand{\len}[1]{\left|#1\right|}\) \(\newcommand{\bbar}{\overline{\bvec}}\) \(\newcommand{\bhat}{\widehat{\bvec}}\) \(\newcommand{\bperp}{\bvec^\perp}\) \(\newcommand{\xhat}{\widehat{\xvec}}\) \(\newcommand{\vhat}{\widehat{\vvec}}\) \(\newcommand{\uhat}{\widehat{\uvec}}\) \(\newcommand{\what}{\widehat{\wvec}}\) \(\newcommand{\Sighat}{\widehat{\Sigma}}\) \(\newcommand{\lt}{<}\) \(\newcommand{\gt}{>}\) \(\newcommand{\amp}{&}\) \(\definecolor{fillinmathshade}{gray}{0.9}\)Intent Gain insight into the nature of the duplication by studying the patterns in the dotplots.
Problem
How can you gain insight into the scope and nature of code duplication in a software system?
This problem is difficult because:
- Just knowing where in the system duplicated code exists does not necessarily help you to understand its nature, or what should be done about it.
Yet, solving this problem is feasible because:
- A picture is worth a thousand words.
Solution
Visualize the code as a matrix in which the two axes represent two source code files (possibly the same file), and dots in the matrix occur where source code lines are duplicated.
Steps
If you want to analyze two files A and B:
- Normalize the contents of the two files to eliminate noise (white space etc.).
- Let each axis of the matrix represent elements (e.g., the lines of code) of the normalized files.
- Represent a match between two elements as a dot in the matrix.
- Interpret the obtained pictures: a diagonal represents duplicated code between the two files.
To analyze the duplication inside a single file, plot the elements of that file on both axes.
Interpretations
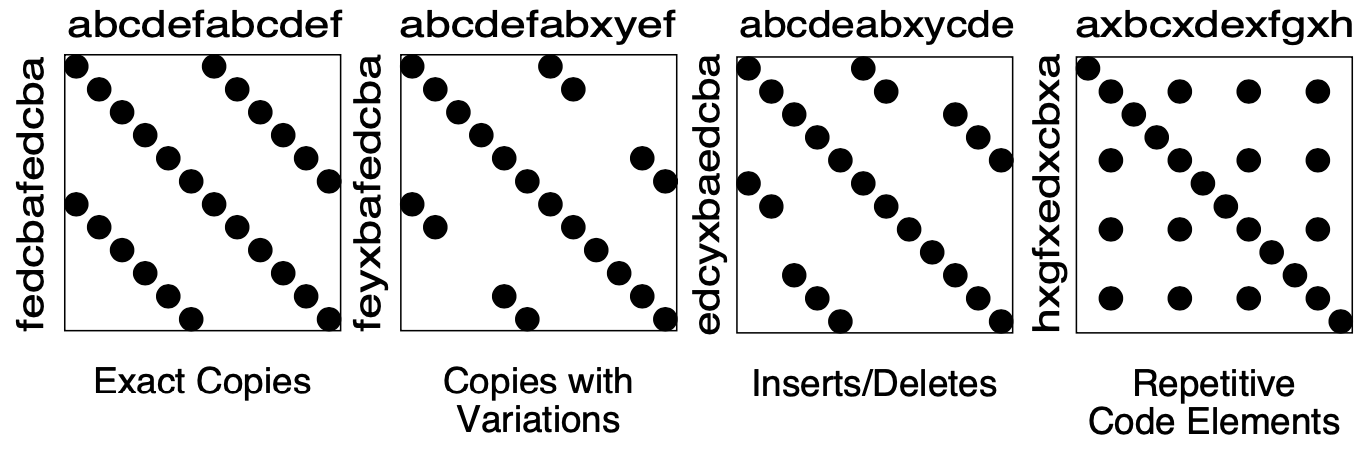
The interpretation of the obtained matrices are illustrated in Figure \(\PageIndex{1}\):
Some interesting configurations formed by the dots in the matrices are the following:
- Exact Copies: diagonals of dots indicate copied sequences of source code.
- Copies With Variations: sequences that have holes in them indicate that a portion of a copied sequences has been changed.
- Inserts/Deletes: broken sequences with parts shifted to the right or left indicate that a portion of code has been inserted or deleted.
- Repetitive Code Elements: rectangular configurations indicate periodic occurrences of the same code. An example is the break at the end of the individual cases of a C or C++ switch statement, or recurring preprocessor commands like
#ifdef SOME CONDITION.
Tradeoffs
Pros
- The approach is largely language-independent, since only the code normalization depends on the language syntax.
- The approach works well when reverse engineering large amounts of unknown code, because the dotplots attract your eye to certain parts of the code to be studied more closely.
- The idea is simple yet works surprisingly well. A simple version of the approach can be implemented by a good programmer using an appropriate tools in a couple of days. (One of our better students made a small dotplot browser in Delphi in two days.)
Cons
- Dotplots only present pairwise comparisons. They do not necessarily help you identify all instances of duplicated elements in the entire software system. Although the approach can easily be extended to present multiple files across each axis, the comparisons are still only pairwise.
Difficulties
- A naive implementation of a dotplot visualizer may not scale well to large systems. Tuning and optimizing the approach for large data sets can compromise the simplicity of the approach.
- The interpretation of the data may be more subtle than it appears at first glance. Indeed, while comparing multiple files the diagonals represent more duplication than is really in the system because we are comparing duplicated fragments with themselves over different files, as shown by Figure \(\PageIndex{2}\) and Figure \(\PageIndex{3}\).
- The screen size limits the amount of information that can be visualized. Some success has been achieved with so-called “mural” visualization approaches [JS96]. However, these techniques are significantly more difficult to implement than simple dotplots and are not worth the extra effort.
Example
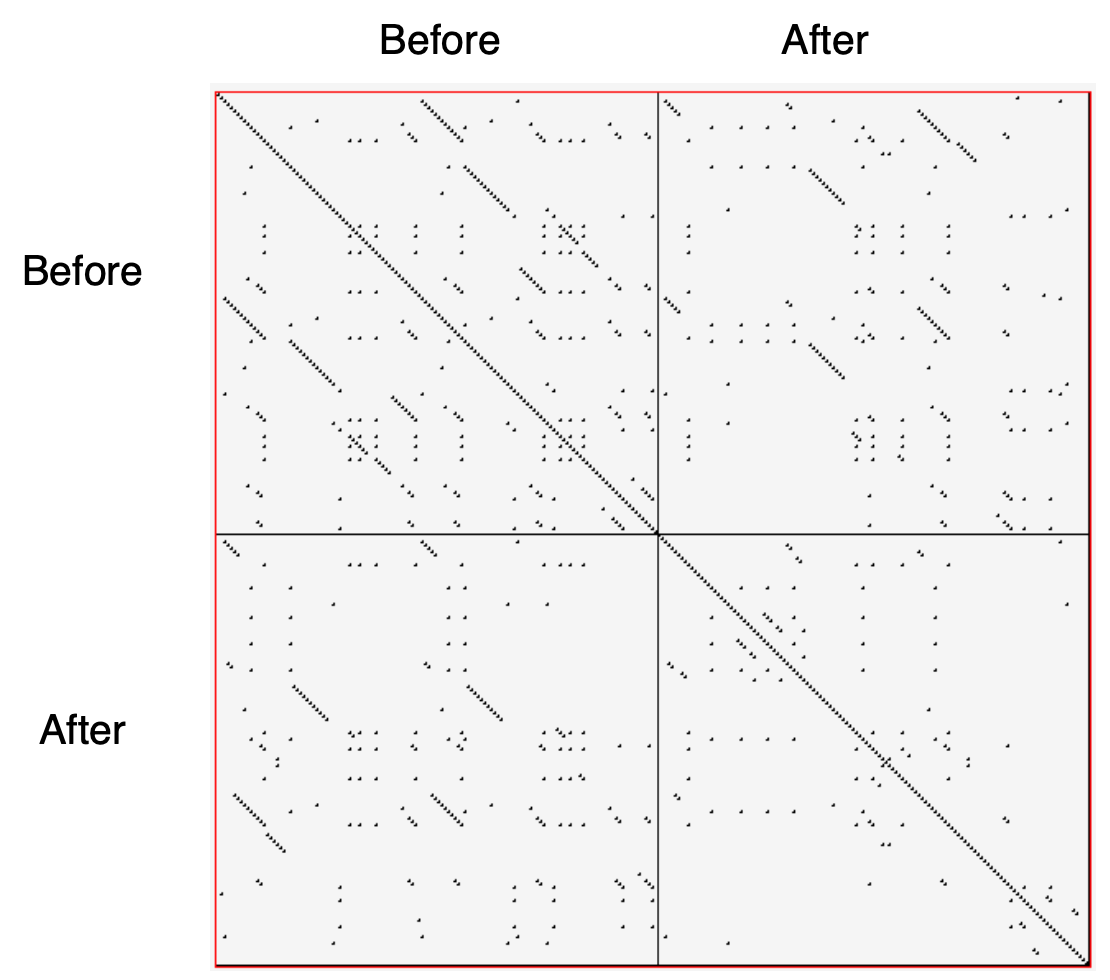
In Figure \(\PageIndex{2}\) we see a dotplot of two versions of a piece of software, before and after the duplication has been removed. The first version is compared to itself in the top left square. The line down the diagonal simply shows us that every line of code is being compared to itself. What is more interesting is that several other diagonal lines occur in the dotplot, which means that code has been duplicated within this file. A second version of the same file is compared to itself in the lower right square. Here we see no significant duplication aside from the main diagonal, which reflects the fact that all the duplicated code has been successfully refactored.
The bottom left and top right squares are mirror images of each other. They tell us how the before and after files have been reorganized. Since there is no strong diagonal, this tells us that significant reorganization has taken place. The diagonal stripes show us which parts of the old version have survived and where they appear in the new version. From the dot-plot alone, we can guess that about half of the code has survived, and another half of the code has been significantly rewritten.
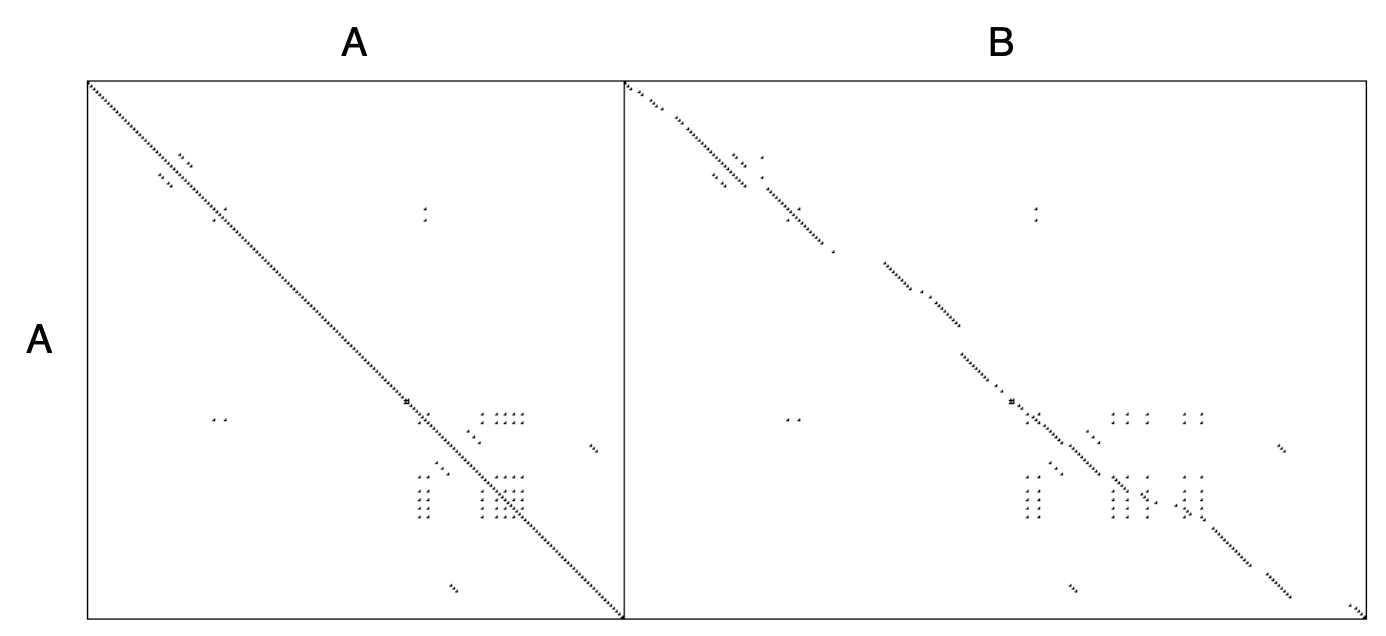
Dotplots are also useful to detect duplication across multiple files. Figure \(\PageIndex{3}\) shows a dotplot comparing two Python files. The comparison of A vs. A shows that there is essentially no internal duplication. Very likely there are some switch statements in the bottom have of the file, indicated by the matrix pattern.
When we compare file A to file B, however, we detect a staggering amount of duplication. It looks very much like file B is just a copy of file A that has been extended in various ways. Closer investigation showed this to be the case. In fact, file A was just an older version of file B that had inadvertently been left in the release.
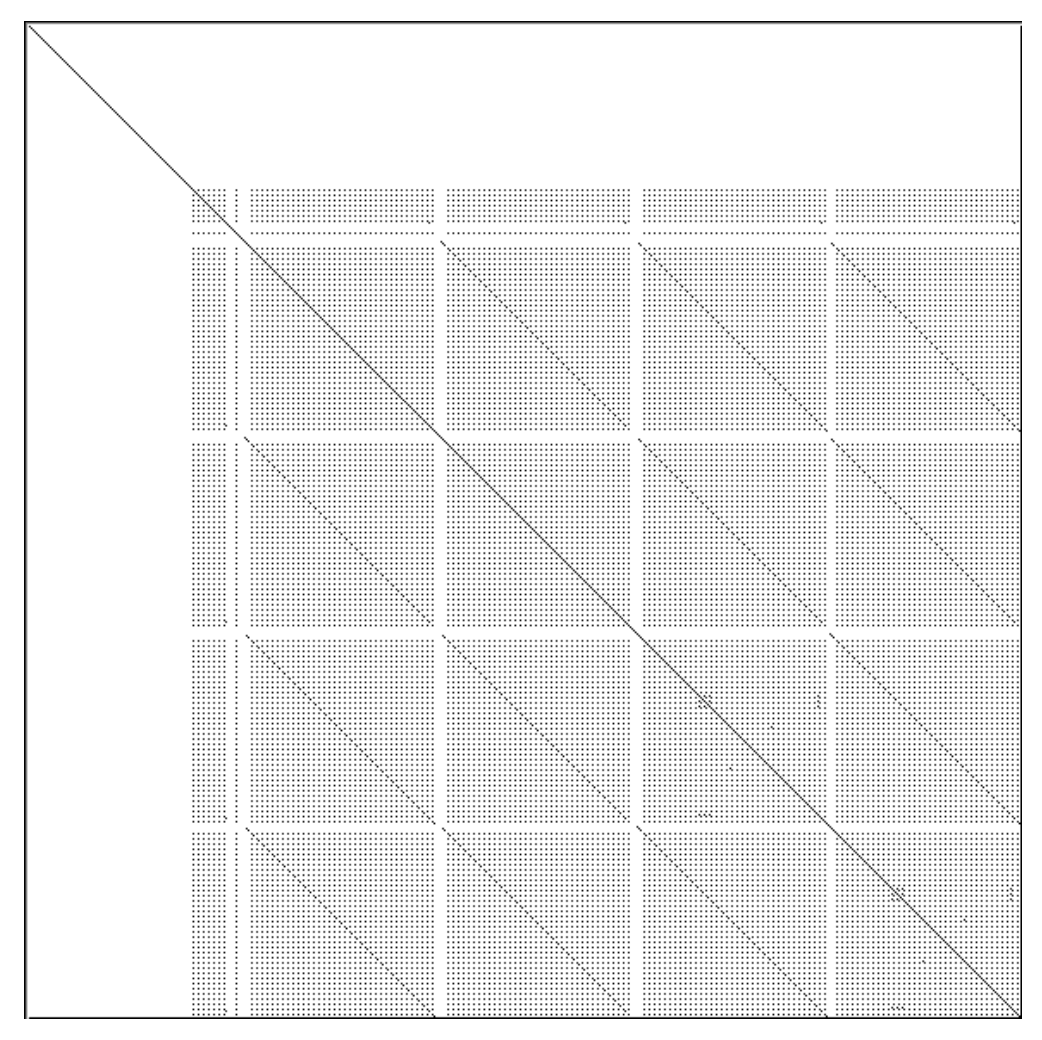
Dotplots can also be useful to detect other problems. Figure \(\PageIndex{4}\) presents four clones that represent a switch statement over a type variable that is used to call individual construction code. The duplicated code could perhaps be eliminated by applying Transform Conditionals to Polymorphism.
Known Uses
The pattern has been applied in biological research to detect DNA sequences [PK82]. The Dotplot tool [Hel95] has been used to detect similarities in manual pages, literary texts and names from file systems. In the FAMOOS project, the pattern has been applied to build Duploc, a tool for identifying duplication in software source code [DRD99]. The Dup tool [Bak92] has been used to investigated the source code of the X-Window system and uses a dotplot matrix graphical representation.
Related Patterns
Once you have detected duplicated code, numerous refactoring patterns may apply, in particular Extract Method.
Very often duplicated code arises because clients assume too many responsibilities. In that case, Move Behavior Close to Data will help you to eliminate the duplication.
Dotplots also help to detect large conditional constructs. You should probably Transform Conditionals to Polymorphism to eliminate these conditionals and thereby achieve a more flexible design.