
1.3: Beginnings of a Market to 1970
- Page ID
- 47685

Beginnings of a Market to 1970
Through much of the first half of the 20th Century, the United States was the dominant world oil producer and was, in fact, a net exporter. By the early 1900s, a bilateral "world" market for oil had developed, but the world price was simply the U.S. price plus the cost of freight. Russia's production did not lag far behind U.S. production during this time, but their relatively closed economy precluded much trade with the rest of the world. Table 1.1 shows the leading crude-oil producers up to 1970.
\(Table \text { } 1.1\): World Crude Production, 1910 - 1970, in million barrels per day (mbd).
| Year | U.S. | Mexico | Venezuela | Russia | Indonesia | Middle East |
| 1910 | 575 | 10 | 0 | 170 | 30 | 0 |
| 1920 | 1,214 | 430 | 1 | 70 | 48 | 31 |
| 1930 | 2,460 | 408 | 374 | 344 | 114 | 126 |
| 1940 | 3,707 | 12 | 508 | 599 | 170 | 280 |
| 1950 | 5,407 | 198 | 1,498 | 729 | 133 | 1,755 |
| 1960 | 7,055 | 271 | 2,854 | 2,957 | 419 | 5,255 |
| 1970 | 9,637 | 487 | 3,708 | 6,985 | 854 | 13,957 |
Unlike OPEC, the market for crude oil in the U.S. was generally competitive since mineral rights did not belong to the state but the landholder. If it was under your property, you owned it. Since oil (and gas) reservoirs often crossed property boundaries, "rights" were hard to specify and enforce. If an oil reservoir was split between my property and yours, the money would flow to whomever could suck all the oil out first. Overdrilling was the result, as was the birth of "wildcatters," individuals who would dig oil wells on unproven land, hoping to strike it rich.
During the period up to 1970 (and even beyond), the "market" for crude oil was characterized largely by within-company exchanges. Most oil companies were "vertically integrated," meaning that the company operated all the way down the value chain - crude oil would go from the field to the refiner to the marketer (and then to the retailer, like a gas station) while staying within company borders. There were a small number of market transactions at what were referred to as "posted prices." Posted prices are essentially fixed offer prices posted by companies in advance of transactions. Posted prices were originally painted on wooden signs and hung on posts (hence the name), each remaining in effect until it was replaced by a new one. Now, posted prices take the form of electronic bulletins issued by major oil producers. (The spot market for crude oil is still not very large, so posted prices are not always representative of market conditions.) An example of a posted price bulletin is shown in \(Figure 1.2\).
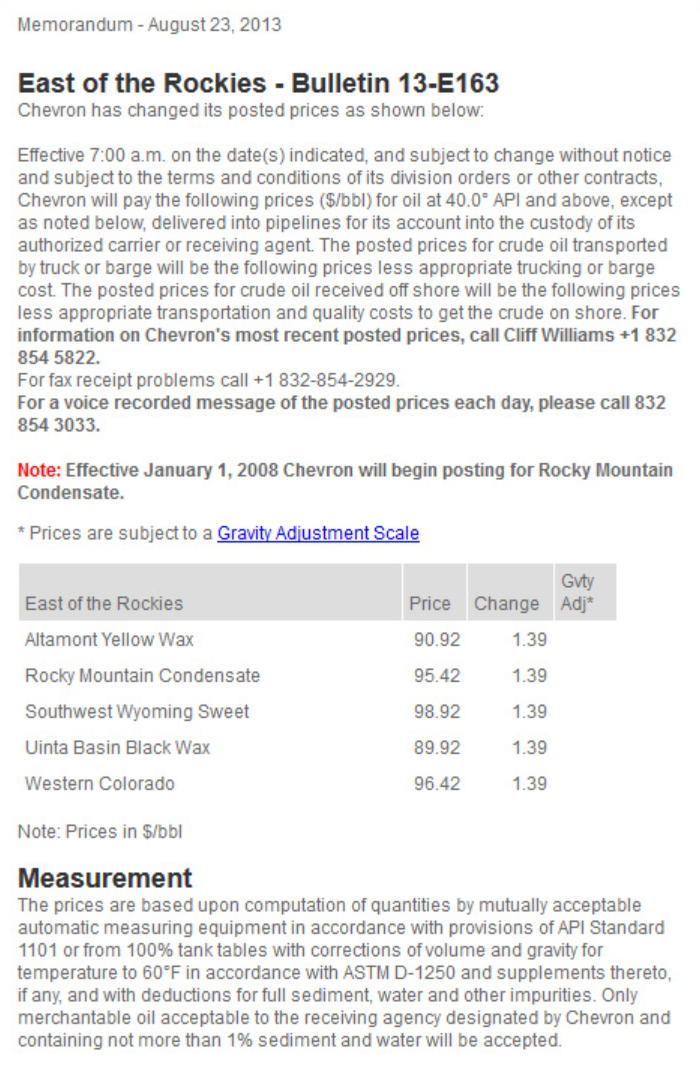
\(Figure \text { } 1.2\): Screen capture of a ChevronTexaco Posted Price Bulletin.