
6.2: What went wrong with rate of return regulation?
- Page ID
- 47790

\( \newcommand{\vecs}[1]{\overset { \scriptstyle \rightharpoonup} {\mathbf{#1}} } \)
\( \newcommand{\vecd}[1]{\overset{-\!-\!\rightharpoonup}{\vphantom{a}\smash {#1}}} \)
\( \newcommand{\dsum}{\displaystyle\sum\limits} \)
\( \newcommand{\dint}{\displaystyle\int\limits} \)
\( \newcommand{\dlim}{\displaystyle\lim\limits} \)
\( \newcommand{\id}{\mathrm{id}}\) \( \newcommand{\Span}{\mathrm{span}}\)
( \newcommand{\kernel}{\mathrm{null}\,}\) \( \newcommand{\range}{\mathrm{range}\,}\)
\( \newcommand{\RealPart}{\mathrm{Re}}\) \( \newcommand{\ImaginaryPart}{\mathrm{Im}}\)
\( \newcommand{\Argument}{\mathrm{Arg}}\) \( \newcommand{\norm}[1]{\| #1 \|}\)
\( \newcommand{\inner}[2]{\langle #1, #2 \rangle}\)
\( \newcommand{\Span}{\mathrm{span}}\)
\( \newcommand{\id}{\mathrm{id}}\)
\( \newcommand{\Span}{\mathrm{span}}\)
\( \newcommand{\kernel}{\mathrm{null}\,}\)
\( \newcommand{\range}{\mathrm{range}\,}\)
\( \newcommand{\RealPart}{\mathrm{Re}}\)
\( \newcommand{\ImaginaryPart}{\mathrm{Im}}\)
\( \newcommand{\Argument}{\mathrm{Arg}}\)
\( \newcommand{\norm}[1]{\| #1 \|}\)
\( \newcommand{\inner}[2]{\langle #1, #2 \rangle}\)
\( \newcommand{\Span}{\mathrm{span}}\) \( \newcommand{\AA}{\unicode[.8,0]{x212B}}\)
\( \newcommand{\vectorA}[1]{\vec{#1}} % arrow\)
\( \newcommand{\vectorAt}[1]{\vec{\text{#1}}} % arrow\)
\( \newcommand{\vectorB}[1]{\overset { \scriptstyle \rightharpoonup} {\mathbf{#1}} } \)
\( \newcommand{\vectorC}[1]{\textbf{#1}} \)
\( \newcommand{\vectorD}[1]{\overrightarrow{#1}} \)
\( \newcommand{\vectorDt}[1]{\overrightarrow{\text{#1}}} \)
\( \newcommand{\vectE}[1]{\overset{-\!-\!\rightharpoonup}{\vphantom{a}\smash{\mathbf {#1}}}} \)
\( \newcommand{\vecs}[1]{\overset { \scriptstyle \rightharpoonup} {\mathbf{#1}} } \)
\(\newcommand{\longvect}{\overrightarrow}\)
\( \newcommand{\vecd}[1]{\overset{-\!-\!\rightharpoonup}{\vphantom{a}\smash {#1}}} \)
\(\newcommand{\avec}{\mathbf a}\) \(\newcommand{\bvec}{\mathbf b}\) \(\newcommand{\cvec}{\mathbf c}\) \(\newcommand{\dvec}{\mathbf d}\) \(\newcommand{\dtil}{\widetilde{\mathbf d}}\) \(\newcommand{\evec}{\mathbf e}\) \(\newcommand{\fvec}{\mathbf f}\) \(\newcommand{\nvec}{\mathbf n}\) \(\newcommand{\pvec}{\mathbf p}\) \(\newcommand{\qvec}{\mathbf q}\) \(\newcommand{\svec}{\mathbf s}\) \(\newcommand{\tvec}{\mathbf t}\) \(\newcommand{\uvec}{\mathbf u}\) \(\newcommand{\vvec}{\mathbf v}\) \(\newcommand{\wvec}{\mathbf w}\) \(\newcommand{\xvec}{\mathbf x}\) \(\newcommand{\yvec}{\mathbf y}\) \(\newcommand{\zvec}{\mathbf z}\) \(\newcommand{\rvec}{\mathbf r}\) \(\newcommand{\mvec}{\mathbf m}\) \(\newcommand{\zerovec}{\mathbf 0}\) \(\newcommand{\onevec}{\mathbf 1}\) \(\newcommand{\real}{\mathbb R}\) \(\newcommand{\twovec}[2]{\left[\begin{array}{r}#1 \\ #2 \end{array}\right]}\) \(\newcommand{\ctwovec}[2]{\left[\begin{array}{c}#1 \\ #2 \end{array}\right]}\) \(\newcommand{\threevec}[3]{\left[\begin{array}{r}#1 \\ #2 \\ #3 \end{array}\right]}\) \(\newcommand{\cthreevec}[3]{\left[\begin{array}{c}#1 \\ #2 \\ #3 \end{array}\right]}\) \(\newcommand{\fourvec}[4]{\left[\begin{array}{r}#1 \\ #2 \\ #3 \\ #4 \end{array}\right]}\) \(\newcommand{\cfourvec}[4]{\left[\begin{array}{c}#1 \\ #2 \\ #3 \\ #4 \end{array}\right]}\) \(\newcommand{\fivevec}[5]{\left[\begin{array}{r}#1 \\ #2 \\ #3 \\ #4 \\ #5 \\ \end{array}\right]}\) \(\newcommand{\cfivevec}[5]{\left[\begin{array}{c}#1 \\ #2 \\ #3 \\ #4 \\ #5 \\ \end{array}\right]}\) \(\newcommand{\mattwo}[4]{\left[\begin{array}{rr}#1 \amp #2 \\ #3 \amp #4 \\ \end{array}\right]}\) \(\newcommand{\laspan}[1]{\text{Span}\{#1\}}\) \(\newcommand{\bcal}{\cal B}\) \(\newcommand{\ccal}{\cal C}\) \(\newcommand{\scal}{\cal S}\) \(\newcommand{\wcal}{\cal W}\) \(\newcommand{\ecal}{\cal E}\) \(\newcommand{\coords}[2]{\left\{#1\right\}_{#2}}\) \(\newcommand{\gray}[1]{\color{gray}{#1}}\) \(\newcommand{\lgray}[1]{\color{lightgray}{#1}}\) \(\newcommand{\rank}{\operatorname{rank}}\) \(\newcommand{\row}{\text{Row}}\) \(\newcommand{\col}{\text{Col}}\) \(\renewcommand{\row}{\text{Row}}\) \(\newcommand{\nul}{\text{Nul}}\) \(\newcommand{\var}{\text{Var}}\) \(\newcommand{\corr}{\text{corr}}\) \(\newcommand{\len}[1]{\left|#1\right|}\) \(\newcommand{\bbar}{\overline{\bvec}}\) \(\newcommand{\bhat}{\widehat{\bvec}}\) \(\newcommand{\bperp}{\bvec^\perp}\) \(\newcommand{\xhat}{\widehat{\xvec}}\) \(\newcommand{\vhat}{\widehat{\vvec}}\) \(\newcommand{\uhat}{\widehat{\uvec}}\) \(\newcommand{\what}{\widehat{\wvec}}\) \(\newcommand{\Sighat}{\widehat{\Sigma}}\) \(\newcommand{\lt}{<}\) \(\newcommand{\gt}{>}\) \(\newcommand{\amp}{&}\) \(\definecolor{fillinmathshade}{gray}{0.9}\)What went wrong with rate of return regulation?
Technology improvements and economies of scale caused electric rates to fall until 1970, which made industry and residential customers happy. In 2002 dollars, price fell from about $5.15 per kWh in 1892 to about 9.7 cents per kWh in 1970. The highly regulated structure of the electric utility business created a stable environment for expansion of access to electric power. Beginning in 1970, however, prices for electric power began to rise sharply: 320% in current dollars from 1970 to 1985 (28% in inflation adjusted prices), as shown in \(Figure \text { } 6.1\).
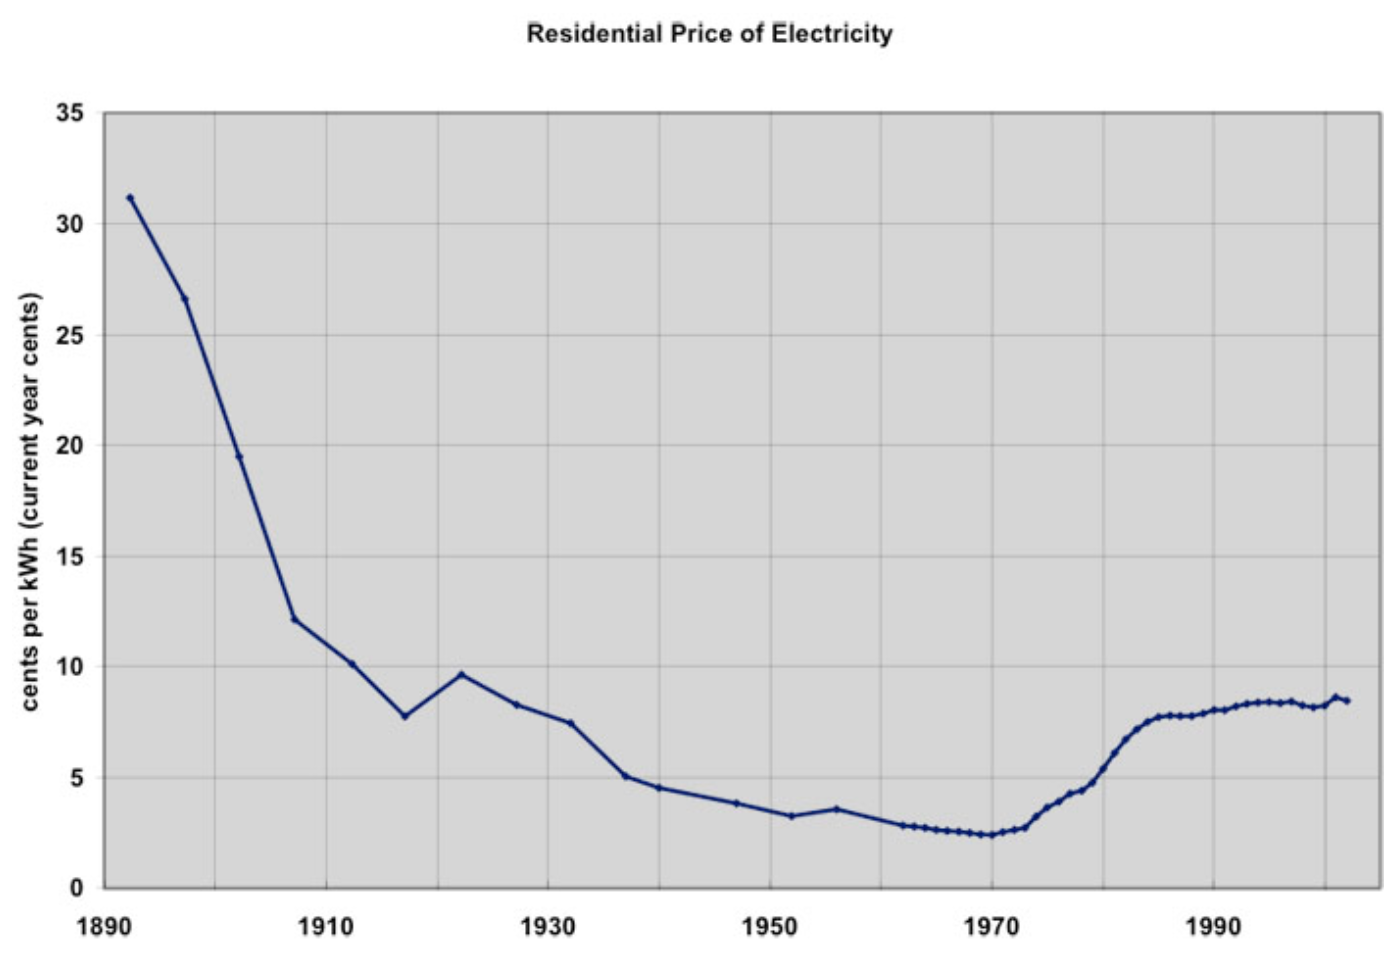
\(Figure \text { } 6.1\): Residential price of electricity in the United States, 1892-2002 in current year cents per kilowatt-hour. Adjusting for inflation, the 1892 cost of one kWh in 2002 dollars was $5.15.
The oil embargo of 1973-74 affected both the production and consumption of electricity. Petroleum fueled 17% of US electricity generation at that time, and so, the curtailment in supply reduced the ability to generate needed electricity. (Today, petroleum supplies only 2%). The uncertain supply and much higher prices (which jumped from $3 in September 1973 to $12 a barrel in January 1974) had a devastating effect on the economy directly and the demand for electricity indirectly. Electric power generation in the United States in the period 1949 through 1973 increased exponentially (at the compounded rate of 7 ¾ % per year), and linearly since 1973 (with annual increases of 70 billion kilowatt-hours per year, the equivalent of roughly 15 new large generation plants per year), as shown in \(Figure \text { } 6.2\). The transition from exponential to linear growth was unanticipated, and led to the decade-long over-capacity of generation discussed above. The industry went through a difficult time after 1973 adjusting to the slower rate of growth utilities had in startup, construction, or planning a doubling of generation capacity. No one knew how long the decreased demand would last and, given the penalties of delaying or canceling construction, much of this capacity was built. If the industry had continued to grow exponentially, it would be almost twice as large today as it actually is.
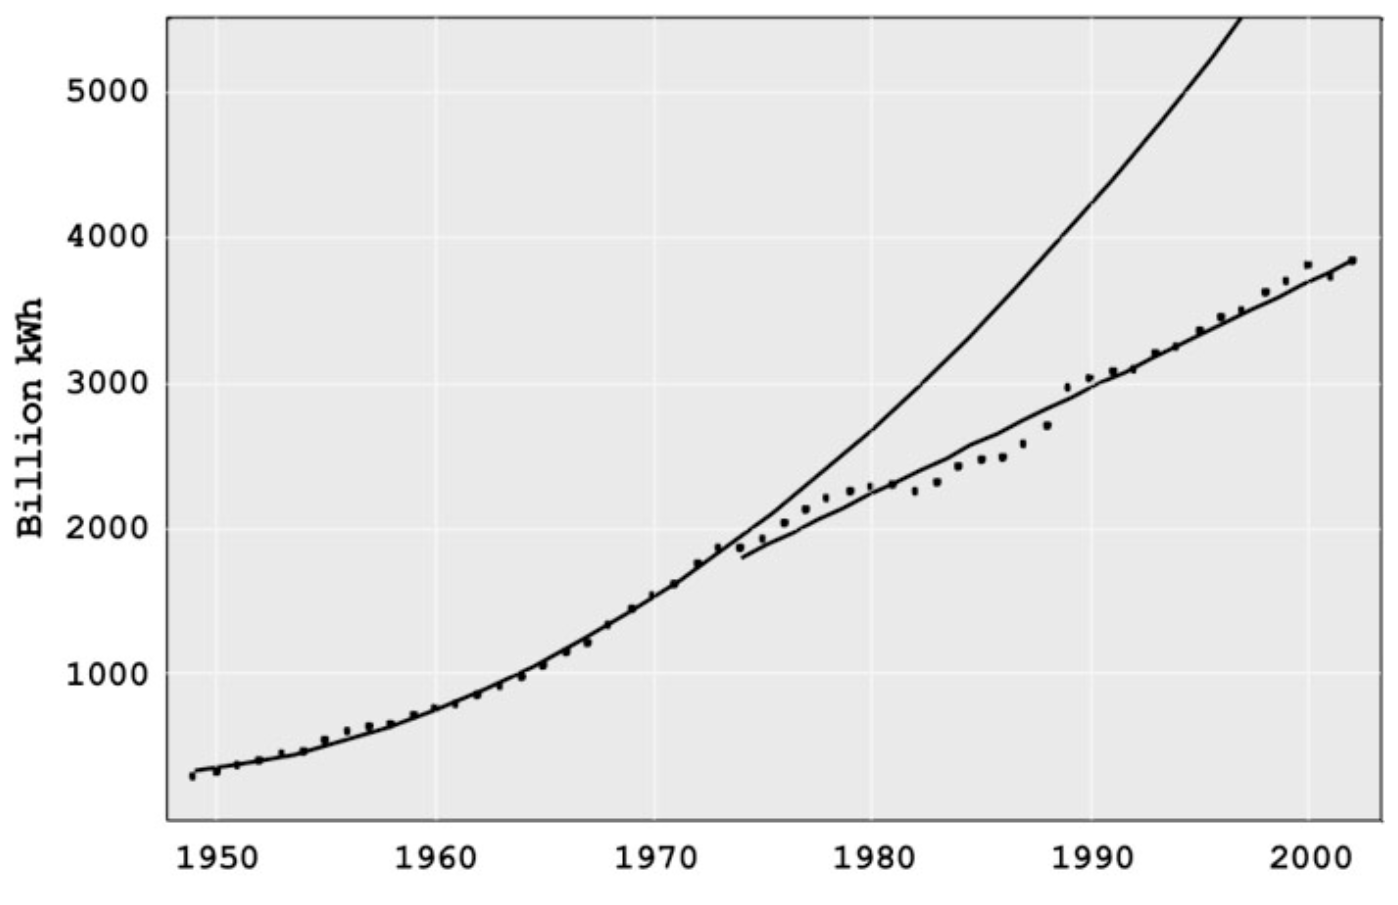
\(Figure \text { } 6.2\): United States electricity sales for all sectors, 1949-2002. If the exponential growth prior to 1973 had continued through 2002, actual use would have been 6600 billion kWh instead of 3800.
Price increases were driven by higher petroleum, coal, and natural gas prices, rate increases to cover the cost of over-capacity, particularly in generation, reduced rates of technology improvement, and by investments in coal and nuclear generation plants of a size which stretched available technology beyond cost effectiveness. In the 1970s, nuclear power plants promised low cost, environmentally benign power. Many utilities started construction of new nuclear plants. Unfortunately, the utilities learned that building and operating nuclear plants was much more difficult than operating dams and fossil fuel plants. As a result, there were vast cost overruns in construction, e.g., Diablo Canyon and the Washington Public Power System, and poor plant operation, e.g., the fuel rod meltdown at Three Mile Island.
Building excess capacity, eliminating some plants that were in planning or early stages of construction, and having nuclear plants that turned out to be much more expensive than estimated and which didn’t operate well generated tremendously high costs. Public Utility Commissions and consumers resisted putting these costs into the rate base, since they raised costs (and prices) markedly. However, since the PUCs had generally approved the investments, there was little alternative to reimbursing the utilities for the majority of these costs.
The electricity price increases came at a time when deregulation of the airlines (1978), railroads and the trucking industry (1980) were reducing prices substantially. The price increases upset consumers and generated intense political pressure to hold down electricity rates. One proposed answer was deregulating electricity, fostering competition and lower prices
As a reaction to the 1973 energy crisis, Congress passed the 1978 Public Utilities Regulatory Policies Act (PURPA), eliminating, at least in principle, protected monopolies for electric generation. The success of early non-utility generation facilities and of deregulation in other industries led to provisions in the 1992 Energy Policy Act encouraging wholesale and retail choice in electricity. Over the next decade, nineteen states and the District of Columbia enacted some form of electric restructuring legislation.
As shown in \(Figure \text { } 6.1\), the price of electricity rose 50% from 1970 to 1975. The “minor” issues in the Rate of Return Regulation (RORR) structure that had been ignored now became major problems. The defects had been hidden by rapidly evolving generation technology that continually lowered generation costs.
- Growing Technical Complexity: As the grid grew in size and complexity, technical difficulties arose. While ever larger generators had lowered costs for 70 years, the new 1,000 megawatt (MW) generators had unexpected problems. Starting in 1962, many utilities tied their systems together for mutual support. Although this may have reduced the number of small failures, the interconnections among utilities produced blackouts that affected millions of people beginning in 1965.
- Over-Investment: The profit that a utility could earn is directly tied to book value of its assets; the more assets, the greater the potential profit. The desire to build more generation and T&D was compounded by the fact that, in most years, a utility could borrow money (through loans or by setting bonds) at less than the allowed rate of return. Thus, investing in more assets with borrowed money allowed shareholders to earn much more than the allowed rate of return on their equity. For example, if the utility were allowed to earn 10% on assets and could borrow the money at 8%, a $100 million investment would return an additional $2 million per year to stockholders. This “Averch-Johnson” effect motivated utilities to find more investment opportunities, even if they were not really needed to provide reliable service. Since regulators demand high reliability, it was easy to justify increased investment as need to prevent electricity shortages and blackouts.
- Bureaucratic Complexity of the State Regulatory Process: The state Public Utility Commissions (PUC) operated in a political-legal environment, often taking years to make decisions. The utilities benefited before 1970 when a new generator with low costs came online, since average generation costs fell. The utility was in no hurry to have the PUC act to adjust the price downward since they were earning profits above their target level.
- Technical-Business Knowledge of the Commissioners: Knowledge of the technology or business of the industry was rarely a criterion for selection to the PUC. Rather, the governor appointed political allies, usually lawyers, with limited technical or business knowledge to the PUC positions. The technical and business issues are sufficiently complicated that even bright individuals, within a four-year term of office, are unlikely to understand the implications of the decisions they must make. Many utilities learned to manage the PUC, usually getting their desired outcomes. If, for myriad reasons, a utility doesn’t desire to be completely candid in describing its operations and costs, it could present data that would deter all but the most skilled auditors from learning what is going on. A commissioner with no technical or business background has little or no chance to figure out what the utility doesn’t want them to learn. Commission decisions seesawed between compliancy, giving the utility whatever it asked for, and being extremely critical, denying even fair requests.
- Political Decisions: The RORR process focused on the issues of greatest concern to the governor and commissioners, sometimes to the detriment of the average customer. Many commissions focused on subsidizing favored groups or large employers, resolving even unreasonable consumer complaints, and helping the political allies of the governor, rather than delivering low-cost electricity.
- Revolving Door: Some commissioners went to work for the industry when their terms of office ended, either as company executives or as lawyers. The key to having a good job at the end of the term was pleasing companies while in office.
- Punishing Risk Taking: Before an asset can go into the rate base, the PUC must find that it is a prudent investment. Since prudency review generally takes place after the asset is constructed, RORR gave utilities a strong incentive not to take chances on new technologies. Since operating costs were automatically passed through, utility management had little incentive to keep employment low and boost productivity. One indication of the effect of passing through operating costs is the massive reductions in the utility workforce in the mid 1990s stemming from the threat of deregulation and other changes.
- Low R&D Investment: Much of the R&D was done by equipment suppliers rather than the regulated utilities. The utilities in fact spent so little on R&D that, in the early 1970s, Congress seemed poised to order utilities to pay into a fund for the Department of Energy’s R&D. The threat was headed off by the formation of the Electric Power Research Institute, a nonprofit organization that would manage industry R&D. However, utility contributions to EPRI declined for two decades, and total R&D spending is extremely low, about 0.2% of revenue. This low level of spending is at variance with the technical problems in the industry and the promising opportunities for new technology.
Clearly, there were problems with RORR. One alternative would have been to reform the regulatory process, as was originally tried in the United Kingdom. The other alternative, which was embraced first within Chile and the United Kingdom before spreading to the United States, was a package of reforms that would change the way that some parts of the industry were regulated, and loosen regulations in other parts of the industry.