
2.1: Global Energy Consumption
- Page ID
- 47157

\( \newcommand{\vecs}[1]{\overset { \scriptstyle \rightharpoonup} {\mathbf{#1}} } \)
\( \newcommand{\vecd}[1]{\overset{-\!-\!\rightharpoonup}{\vphantom{a}\smash {#1}}} \)
\( \newcommand{\dsum}{\displaystyle\sum\limits} \)
\( \newcommand{\dint}{\displaystyle\int\limits} \)
\( \newcommand{\dlim}{\displaystyle\lim\limits} \)
\( \newcommand{\id}{\mathrm{id}}\) \( \newcommand{\Span}{\mathrm{span}}\)
( \newcommand{\kernel}{\mathrm{null}\,}\) \( \newcommand{\range}{\mathrm{range}\,}\)
\( \newcommand{\RealPart}{\mathrm{Re}}\) \( \newcommand{\ImaginaryPart}{\mathrm{Im}}\)
\( \newcommand{\Argument}{\mathrm{Arg}}\) \( \newcommand{\norm}[1]{\| #1 \|}\)
\( \newcommand{\inner}[2]{\langle #1, #2 \rangle}\)
\( \newcommand{\Span}{\mathrm{span}}\)
\( \newcommand{\id}{\mathrm{id}}\)
\( \newcommand{\Span}{\mathrm{span}}\)
\( \newcommand{\kernel}{\mathrm{null}\,}\)
\( \newcommand{\range}{\mathrm{range}\,}\)
\( \newcommand{\RealPart}{\mathrm{Re}}\)
\( \newcommand{\ImaginaryPart}{\mathrm{Im}}\)
\( \newcommand{\Argument}{\mathrm{Arg}}\)
\( \newcommand{\norm}[1]{\| #1 \|}\)
\( \newcommand{\inner}[2]{\langle #1, #2 \rangle}\)
\( \newcommand{\Span}{\mathrm{span}}\) \( \newcommand{\AA}{\unicode[.8,0]{x212B}}\)
\( \newcommand{\vectorA}[1]{\vec{#1}} % arrow\)
\( \newcommand{\vectorAt}[1]{\vec{\text{#1}}} % arrow\)
\( \newcommand{\vectorB}[1]{\overset { \scriptstyle \rightharpoonup} {\mathbf{#1}} } \)
\( \newcommand{\vectorC}[1]{\textbf{#1}} \)
\( \newcommand{\vectorD}[1]{\overrightarrow{#1}} \)
\( \newcommand{\vectorDt}[1]{\overrightarrow{\text{#1}}} \)
\( \newcommand{\vectE}[1]{\overset{-\!-\!\rightharpoonup}{\vphantom{a}\smash{\mathbf {#1}}}} \)
\( \newcommand{\vecs}[1]{\overset { \scriptstyle \rightharpoonup} {\mathbf{#1}} } \)
\(\newcommand{\longvect}{\overrightarrow}\)
\( \newcommand{\vecd}[1]{\overset{-\!-\!\rightharpoonup}{\vphantom{a}\smash {#1}}} \)
\(\newcommand{\avec}{\mathbf a}\) \(\newcommand{\bvec}{\mathbf b}\) \(\newcommand{\cvec}{\mathbf c}\) \(\newcommand{\dvec}{\mathbf d}\) \(\newcommand{\dtil}{\widetilde{\mathbf d}}\) \(\newcommand{\evec}{\mathbf e}\) \(\newcommand{\fvec}{\mathbf f}\) \(\newcommand{\nvec}{\mathbf n}\) \(\newcommand{\pvec}{\mathbf p}\) \(\newcommand{\qvec}{\mathbf q}\) \(\newcommand{\svec}{\mathbf s}\) \(\newcommand{\tvec}{\mathbf t}\) \(\newcommand{\uvec}{\mathbf u}\) \(\newcommand{\vvec}{\mathbf v}\) \(\newcommand{\wvec}{\mathbf w}\) \(\newcommand{\xvec}{\mathbf x}\) \(\newcommand{\yvec}{\mathbf y}\) \(\newcommand{\zvec}{\mathbf z}\) \(\newcommand{\rvec}{\mathbf r}\) \(\newcommand{\mvec}{\mathbf m}\) \(\newcommand{\zerovec}{\mathbf 0}\) \(\newcommand{\onevec}{\mathbf 1}\) \(\newcommand{\real}{\mathbb R}\) \(\newcommand{\twovec}[2]{\left[\begin{array}{r}#1 \\ #2 \end{array}\right]}\) \(\newcommand{\ctwovec}[2]{\left[\begin{array}{c}#1 \\ #2 \end{array}\right]}\) \(\newcommand{\threevec}[3]{\left[\begin{array}{r}#1 \\ #2 \\ #3 \end{array}\right]}\) \(\newcommand{\cthreevec}[3]{\left[\begin{array}{c}#1 \\ #2 \\ #3 \end{array}\right]}\) \(\newcommand{\fourvec}[4]{\left[\begin{array}{r}#1 \\ #2 \\ #3 \\ #4 \end{array}\right]}\) \(\newcommand{\cfourvec}[4]{\left[\begin{array}{c}#1 \\ #2 \\ #3 \\ #4 \end{array}\right]}\) \(\newcommand{\fivevec}[5]{\left[\begin{array}{r}#1 \\ #2 \\ #3 \\ #4 \\ #5 \\ \end{array}\right]}\) \(\newcommand{\cfivevec}[5]{\left[\begin{array}{c}#1 \\ #2 \\ #3 \\ #4 \\ #5 \\ \end{array}\right]}\) \(\newcommand{\mattwo}[4]{\left[\begin{array}{rr}#1 \amp #2 \\ #3 \amp #4 \\ \end{array}\right]}\) \(\newcommand{\laspan}[1]{\text{Span}\{#1\}}\) \(\newcommand{\bcal}{\cal B}\) \(\newcommand{\ccal}{\cal C}\) \(\newcommand{\scal}{\cal S}\) \(\newcommand{\wcal}{\cal W}\) \(\newcommand{\ecal}{\cal E}\) \(\newcommand{\coords}[2]{\left\{#1\right\}_{#2}}\) \(\newcommand{\gray}[1]{\color{gray}{#1}}\) \(\newcommand{\lgray}[1]{\color{lightgray}{#1}}\) \(\newcommand{\rank}{\operatorname{rank}}\) \(\newcommand{\row}{\text{Row}}\) \(\newcommand{\col}{\text{Col}}\) \(\renewcommand{\row}{\text{Row}}\) \(\newcommand{\nul}{\text{Nul}}\) \(\newcommand{\var}{\text{Var}}\) \(\newcommand{\corr}{\text{corr}}\) \(\newcommand{\len}[1]{\left|#1\right|}\) \(\newcommand{\bbar}{\overline{\bvec}}\) \(\newcommand{\bhat}{\widehat{\bvec}}\) \(\newcommand{\bperp}{\bvec^\perp}\) \(\newcommand{\xhat}{\widehat{\xvec}}\) \(\newcommand{\vhat}{\widehat{\vvec}}\) \(\newcommand{\uhat}{\widehat{\uvec}}\) \(\newcommand{\what}{\widehat{\wvec}}\) \(\newcommand{\Sighat}{\widehat{\Sigma}}\) \(\newcommand{\lt}{<}\) \(\newcommand{\gt}{>}\) \(\newcommand{\amp}{&}\) \(\definecolor{fillinmathshade}{gray}{0.9}\)In 2015, the world used a total of 570.4 quadrillion BTUs. Table 2.1.1 shows the energy consumption in different parts of the world.
Table 2.1.1. World's total primary energy consumption (in quadrillion BTUs)
| Region | 1980 | 1985 | 1990 | 1995 | 2000 | 2005 | 2010 | 2015 |
|---|---|---|---|---|---|---|---|---|
| North America | 91.6 | 91.0 | 100 | 109 | 118 | 121 | 118 | 119.9 |
| Central and South America | 11.5 | 12.3 | 14.5 | 17.6 | 20.8 | 23.2 | 26.9 | 29.7 |
| Europe | 71.8 | 72.9 | 76.3 | 76.7 | 81.5 | 85.8 | 83.8 | 81.2 |
| Eurasia | 46.7 | 55.7 | 61.0 | 42.2 | 39.2 | 43 | 42.8 | 44.8 |
| Africa | 6.8 | 8.5 | 9.5 | 10.7 | 12.0 | 14.5 | 16.3 | 19.3 |
| Asia and Oceania | 48.9 | 58.1 | 73.4 | 93.5 | 111 | 149 | 194 | 239.9 |
| World Total | 283 | 307 | 346 | 363 | 400 | 459 | 511 | 570.4 |
From Table 2.1.1, it can be seen that the energy consumption is high for the Far East and Oceania. The amount of energy used depends on the economic prosperity of the nation and the population of the country. The North American region includes Canada, the United States, and Mexico. The Far East and Oceania include developed nations such as Japan and Australia, and densely populated developing nations such as China and India. Obviously, due to highly populated countries like China and India, total energy consumption does not reflect the quality of life of the people in those countries. Figure 2.1 shows the energy per capita consumption over the last 30 years. As can be seen from the graph that Far East and Oceania used a lot of energy as a region, but per capita energy consumption is relatively low implying that if each person in that region would consume as much as in North America, that Region's energy consumption would skyrocket.
The amount of energy consumed depends on numerous factors, including economic prosperity and population of the location. Table 2.1.1 shows that energy consumption is high in Asia and Oceania, since these areas include densely populated regions like China and India.
Figure 2.1.1 shows the energy consumption per capita.
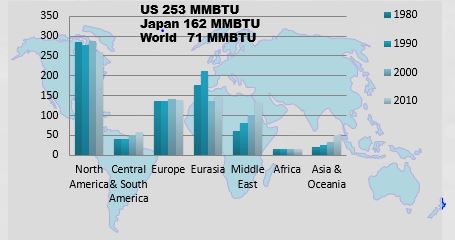
Figure 2.1.1. Energy consumption per capita (MMBTU per person) in 1980 - 2010
Credit: Sarma Pisupati
Although Table 2.1.1 shows high energy consumption in Asia and Oceania, Figure 2.1.1 shows low energy consumption per capita in Asia and Oceania, implying that if each person in those regions consumed as much energy as in places like North America with high energy per capita, the overall energy consumption (i.e., values in Table 2.1.1) of Asia and Oceania would drastically increase. This difference also implies that overall energy consumption is not an indicator of quality of life.
The productivity of a country is measured by the total value (in dollars) of goods and services, called Gross Domestic Product (GDP), produced by its people. Thus, the average value of goods and services produced by each person, i.e., the GDP per capita of a country, is an indicator of quality of life.
Energy intensity is the relationship between energy consumption and economic growth and is an important factor that affects energy consumption over time. In industrialized countries, history has shown that the link between energy consumption and economic growth to be relatively weak, as growth in energy demand lags behind economic growth. In contrast, in developing countries, this link has been strong, as energy demand has grown parallel to economic growth. Figures 2.1.2 and 2.1.3 show the correlations.
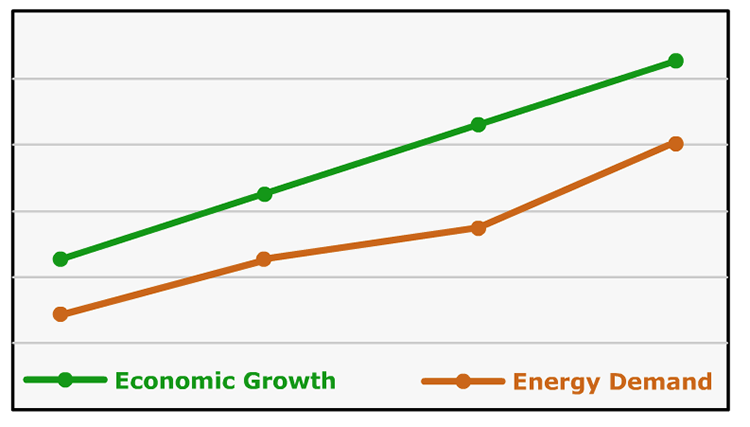
Figure 2.1.2. Energy consumption as a function of quality of life in industrialized countries. Energy demand is constantly lower than economic growth.
Credit: Sarma Pisupati
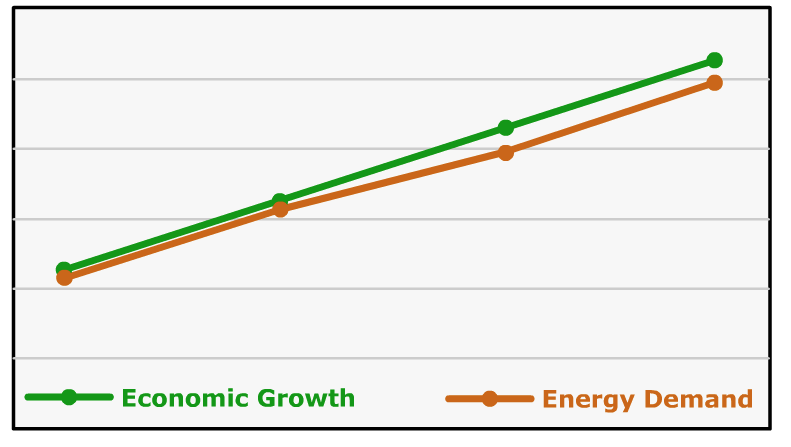
Figure 2.1.3. Energy consumption as a function of quality of life in developing countries. Energy demand is relatively close in value to economic growth.
Global Energy Consumption and GDP per person
In general, as the GDP per person (i.e., per capita) of a country increases, the energy consumption is also expected to increase. This correlation is much stronger in developing nations compared to developed ones. Figure 2.1.4 shows this correlation.
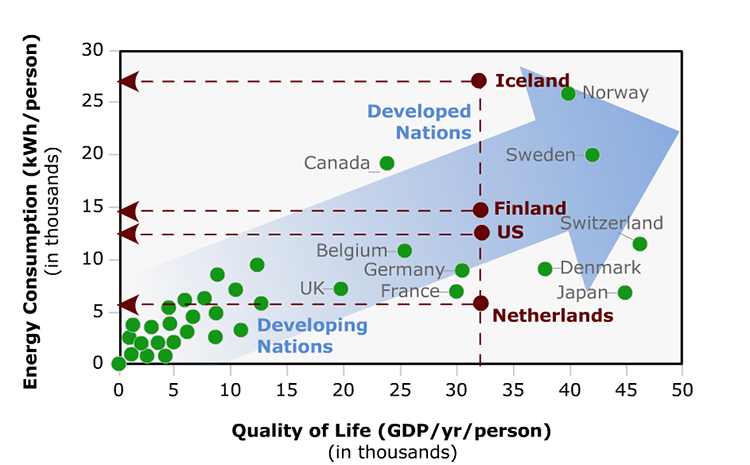
Figure 2.1.4. Energy consumption as a function of quality of life in developing and developed nations
As shown in Figure 2.1.4, Iceland, Finland, the U.S., and the Netherlands, all with similar GDP per capita, have significant differences in energy consumption per capita. To produce one dollar's worth of goods and services, the U.S. consumes twice the amount of energy as that of the Netherlands, while Iceland consumes four times the energy as that of the Netherlands.
Energy Consumption Differences
The differences in energy consumption are caused by various factors, including:
- Efficiency of industrial, transportation, commercial, and residential energy
- Climactic and geographical areas of a country
- Lifestyles (for example, use of more gas-guzzling cars or bigger houses)
- The nature of products produced by the nation's industries
Figures 2.1.5 and 2.1.6 illustrate the differences in energy usage between two different areas.
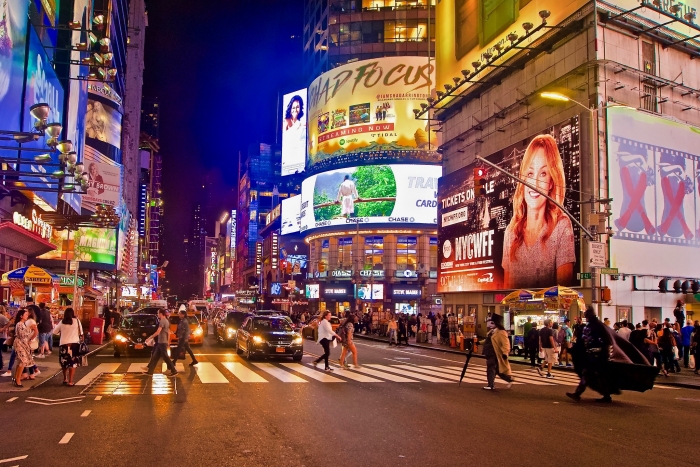
Figure 2.1.5. New York City
Credit: Superheros and Villains by Andreas Komodromo is licensed under CC BY-NC 2.0
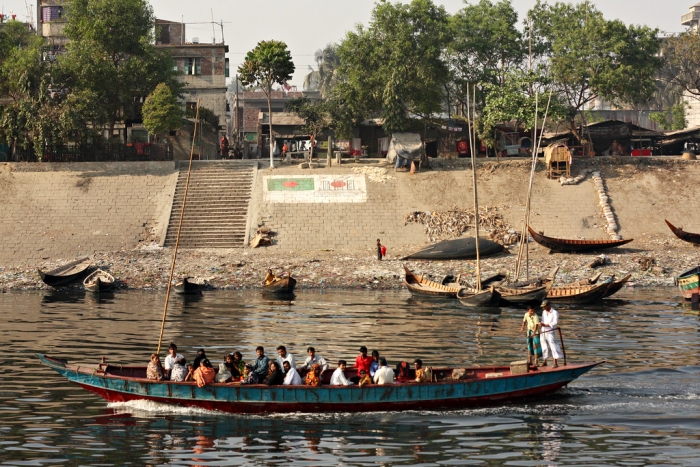
Figure 2.1.6. Bangladesh
Credit: Signs on the river bank by abrinsky is licensed under BY-NC-SA-2.0