5.2: Events and Event Graphs
- Page ID
- 30976

Event graphs (Schruben, 1983; 1995) are a diagramming technique for showing the events comprising a model. An event graph consists of nodes and arcs. Nodes correspond to events. Arcs tell the relationships between events: the other events, including itself, that an event can cause to occur and the logical conditions that may restrict such occurrences. The logical conditions make use of the state variables. An arc also tells the time from now when an event will take place.
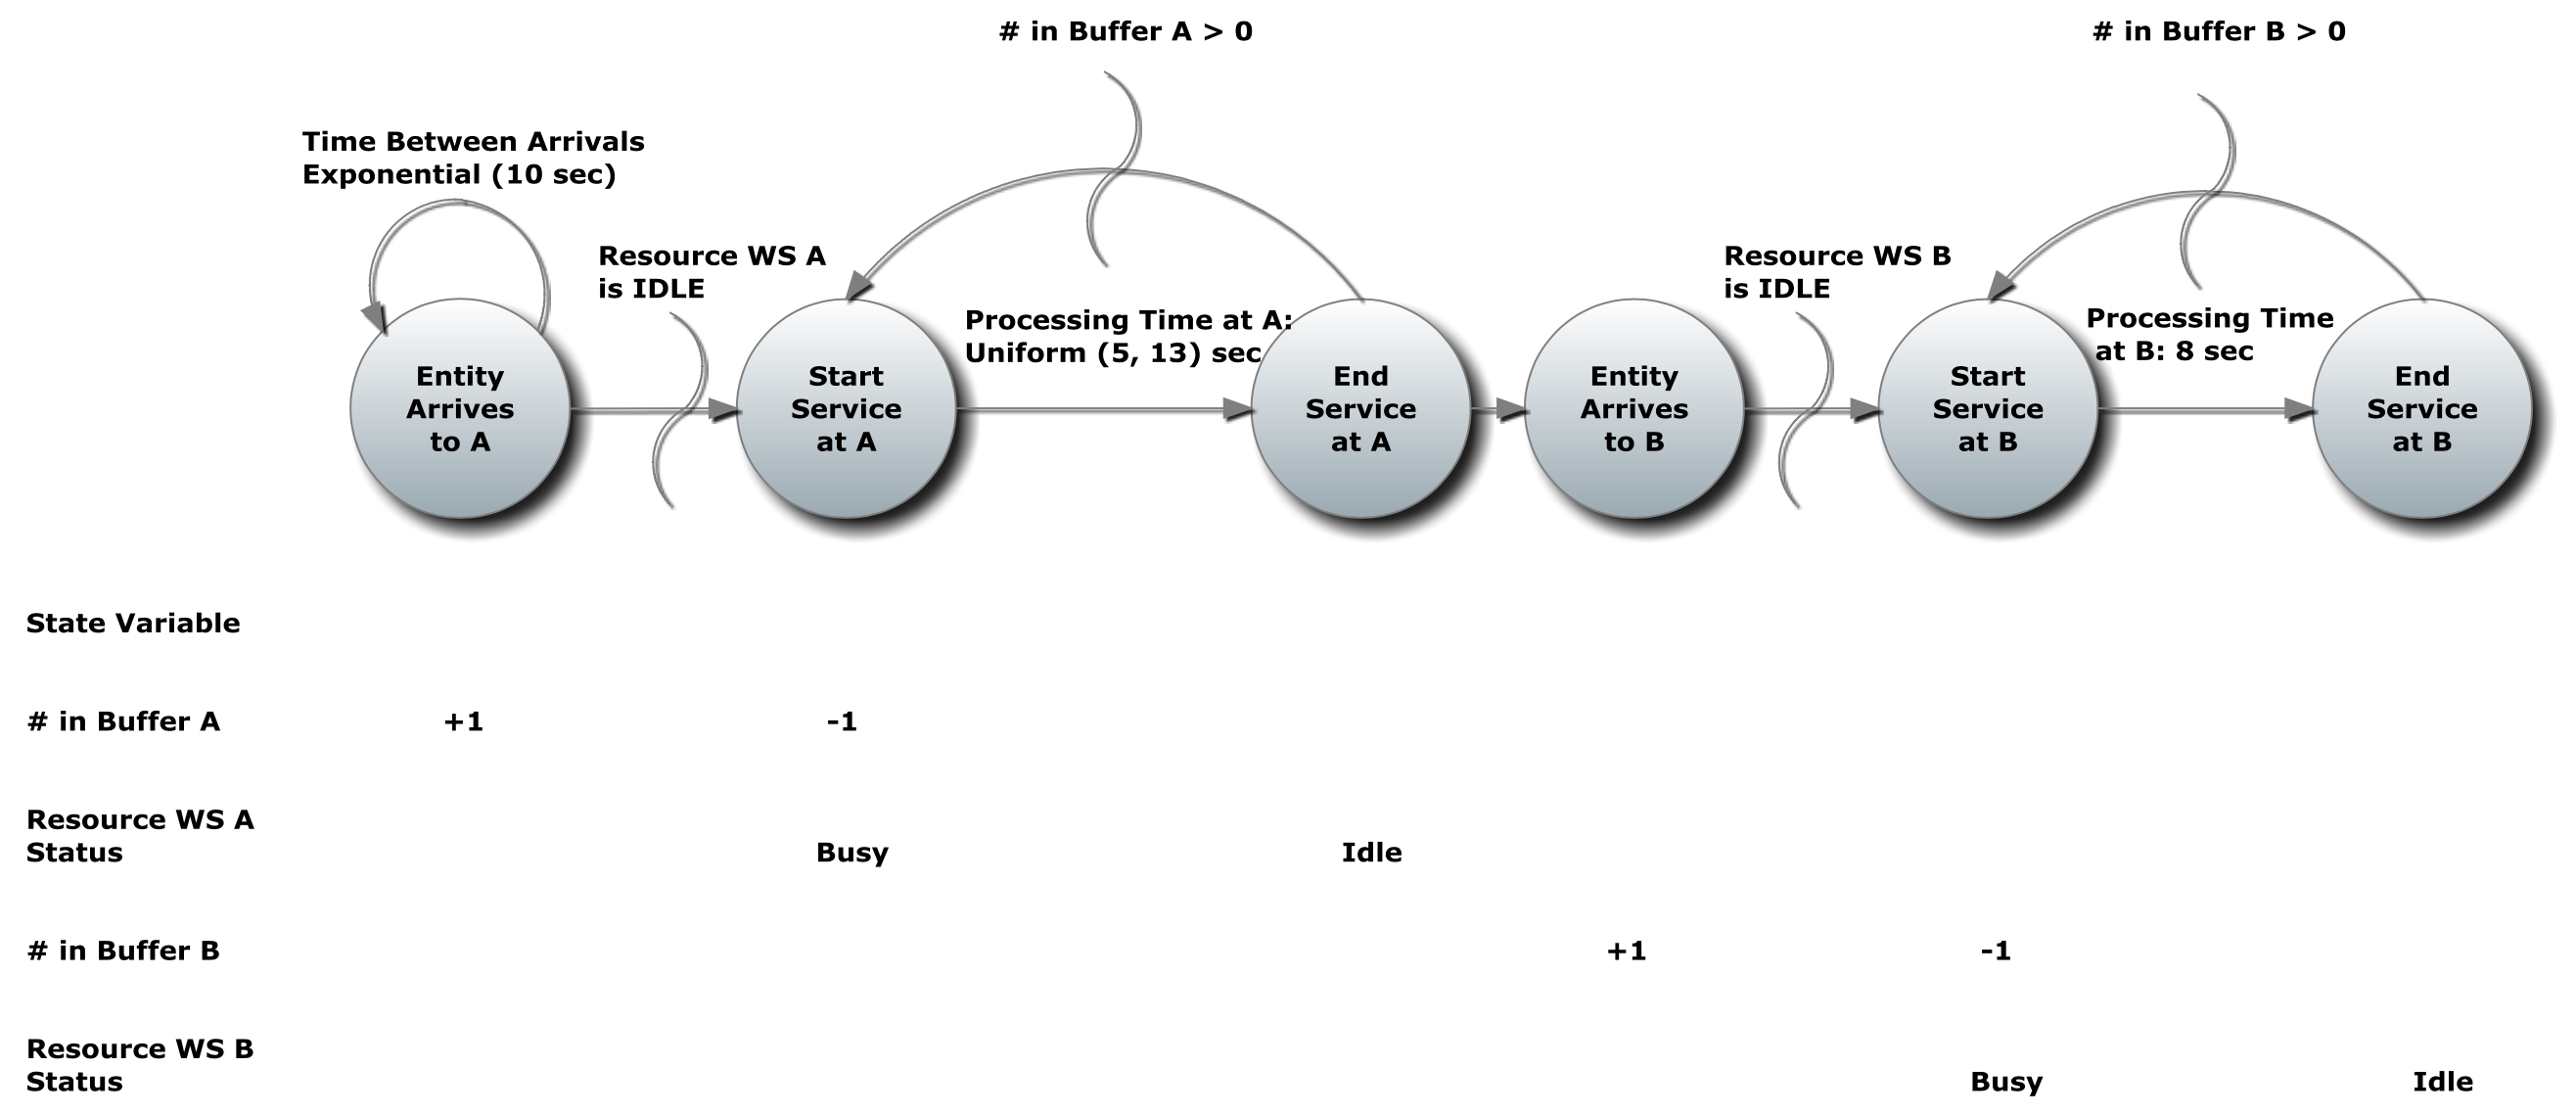
The event graph for the two station serial system is shown in Figure 5-1. There are four state variables: the number in the buffer of each station and the state (busy, idle) of each station. Three events are associated with each station: Entity arrives, Start service, and End service.
The entity arrives event associated with station A causes itself to occur again, that is the next entity to arrive, after a time interval specified by the time between arrivals. The number in the buffer of workstation A is incremented by 1.
The entity arrives event causes the start service event to begin processing the arriving entity immediately if the machine is IDLE. The start service event decreases the number in the buffer of workstation A by 1 and makes the workstation BUSY.
The end service event follows the start service event and occurs after a time interval that is the item processing time. The end service event will initiate processing of the first entity waiting in the buffer if there is one by scheduling the start service event at the current time. The end service event makes the workstation IDLE.
The time between arrivals to station A and the item processing time could be random variables.
Figure 5-1: Event Graph for Two Workstations in a Series Model