
Electrochemical Impedance Spectroscopy
- Page ID
- 373
\( \newcommand{\vecs}[1]{\overset { \scriptstyle \rightharpoonup} {\mathbf{#1}} } \)
\( \newcommand{\vecd}[1]{\overset{-\!-\!\rightharpoonup}{\vphantom{a}\smash {#1}}} \)
\( \newcommand{\dsum}{\displaystyle\sum\limits} \)
\( \newcommand{\dint}{\displaystyle\int\limits} \)
\( \newcommand{\dlim}{\displaystyle\lim\limits} \)
\( \newcommand{\id}{\mathrm{id}}\) \( \newcommand{\Span}{\mathrm{span}}\)
( \newcommand{\kernel}{\mathrm{null}\,}\) \( \newcommand{\range}{\mathrm{range}\,}\)
\( \newcommand{\RealPart}{\mathrm{Re}}\) \( \newcommand{\ImaginaryPart}{\mathrm{Im}}\)
\( \newcommand{\Argument}{\mathrm{Arg}}\) \( \newcommand{\norm}[1]{\| #1 \|}\)
\( \newcommand{\inner}[2]{\langle #1, #2 \rangle}\)
\( \newcommand{\Span}{\mathrm{span}}\)
\( \newcommand{\id}{\mathrm{id}}\)
\( \newcommand{\Span}{\mathrm{span}}\)
\( \newcommand{\kernel}{\mathrm{null}\,}\)
\( \newcommand{\range}{\mathrm{range}\,}\)
\( \newcommand{\RealPart}{\mathrm{Re}}\)
\( \newcommand{\ImaginaryPart}{\mathrm{Im}}\)
\( \newcommand{\Argument}{\mathrm{Arg}}\)
\( \newcommand{\norm}[1]{\| #1 \|}\)
\( \newcommand{\inner}[2]{\langle #1, #2 \rangle}\)
\( \newcommand{\Span}{\mathrm{span}}\) \( \newcommand{\AA}{\unicode[.8,0]{x212B}}\)
\( \newcommand{\vectorA}[1]{\vec{#1}} % arrow\)
\( \newcommand{\vectorAt}[1]{\vec{\text{#1}}} % arrow\)
\( \newcommand{\vectorB}[1]{\overset { \scriptstyle \rightharpoonup} {\mathbf{#1}} } \)
\( \newcommand{\vectorC}[1]{\textbf{#1}} \)
\( \newcommand{\vectorD}[1]{\overrightarrow{#1}} \)
\( \newcommand{\vectorDt}[1]{\overrightarrow{\text{#1}}} \)
\( \newcommand{\vectE}[1]{\overset{-\!-\!\rightharpoonup}{\vphantom{a}\smash{\mathbf {#1}}}} \)
\( \newcommand{\vecs}[1]{\overset { \scriptstyle \rightharpoonup} {\mathbf{#1}} } \)
\(\newcommand{\longvect}{\overrightarrow}\)
\( \newcommand{\vecd}[1]{\overset{-\!-\!\rightharpoonup}{\vphantom{a}\smash {#1}}} \)
\(\newcommand{\avec}{\mathbf a}\) \(\newcommand{\bvec}{\mathbf b}\) \(\newcommand{\cvec}{\mathbf c}\) \(\newcommand{\dvec}{\mathbf d}\) \(\newcommand{\dtil}{\widetilde{\mathbf d}}\) \(\newcommand{\evec}{\mathbf e}\) \(\newcommand{\fvec}{\mathbf f}\) \(\newcommand{\nvec}{\mathbf n}\) \(\newcommand{\pvec}{\mathbf p}\) \(\newcommand{\qvec}{\mathbf q}\) \(\newcommand{\svec}{\mathbf s}\) \(\newcommand{\tvec}{\mathbf t}\) \(\newcommand{\uvec}{\mathbf u}\) \(\newcommand{\vvec}{\mathbf v}\) \(\newcommand{\wvec}{\mathbf w}\) \(\newcommand{\xvec}{\mathbf x}\) \(\newcommand{\yvec}{\mathbf y}\) \(\newcommand{\zvec}{\mathbf z}\) \(\newcommand{\rvec}{\mathbf r}\) \(\newcommand{\mvec}{\mathbf m}\) \(\newcommand{\zerovec}{\mathbf 0}\) \(\newcommand{\onevec}{\mathbf 1}\) \(\newcommand{\real}{\mathbb R}\) \(\newcommand{\twovec}[2]{\left[\begin{array}{r}#1 \\ #2 \end{array}\right]}\) \(\newcommand{\ctwovec}[2]{\left[\begin{array}{c}#1 \\ #2 \end{array}\right]}\) \(\newcommand{\threevec}[3]{\left[\begin{array}{r}#1 \\ #2 \\ #3 \end{array}\right]}\) \(\newcommand{\cthreevec}[3]{\left[\begin{array}{c}#1 \\ #2 \\ #3 \end{array}\right]}\) \(\newcommand{\fourvec}[4]{\left[\begin{array}{r}#1 \\ #2 \\ #3 \\ #4 \end{array}\right]}\) \(\newcommand{\cfourvec}[4]{\left[\begin{array}{c}#1 \\ #2 \\ #3 \\ #4 \end{array}\right]}\) \(\newcommand{\fivevec}[5]{\left[\begin{array}{r}#1 \\ #2 \\ #3 \\ #4 \\ #5 \\ \end{array}\right]}\) \(\newcommand{\cfivevec}[5]{\left[\begin{array}{c}#1 \\ #2 \\ #3 \\ #4 \\ #5 \\ \end{array}\right]}\) \(\newcommand{\mattwo}[4]{\left[\begin{array}{rr}#1 \amp #2 \\ #3 \amp #4 \\ \end{array}\right]}\) \(\newcommand{\laspan}[1]{\text{Span}\{#1\}}\) \(\newcommand{\bcal}{\cal B}\) \(\newcommand{\ccal}{\cal C}\) \(\newcommand{\scal}{\cal S}\) \(\newcommand{\wcal}{\cal W}\) \(\newcommand{\ecal}{\cal E}\) \(\newcommand{\coords}[2]{\left\{#1\right\}_{#2}}\) \(\newcommand{\gray}[1]{\color{gray}{#1}}\) \(\newcommand{\lgray}[1]{\color{lightgray}{#1}}\) \(\newcommand{\rank}{\operatorname{rank}}\) \(\newcommand{\row}{\text{Row}}\) \(\newcommand{\col}{\text{Col}}\) \(\renewcommand{\row}{\text{Row}}\) \(\newcommand{\nul}{\text{Nul}}\) \(\newcommand{\var}{\text{Var}}\) \(\newcommand{\corr}{\text{corr}}\) \(\newcommand{\len}[1]{\left|#1\right|}\) \(\newcommand{\bbar}{\overline{\bvec}}\) \(\newcommand{\bhat}{\widehat{\bvec}}\) \(\newcommand{\bperp}{\bvec^\perp}\) \(\newcommand{\xhat}{\widehat{\xvec}}\) \(\newcommand{\vhat}{\widehat{\vvec}}\) \(\newcommand{\uhat}{\widehat{\uvec}}\) \(\newcommand{\what}{\widehat{\wvec}}\) \(\newcommand{\Sighat}{\widehat{\Sigma}}\) \(\newcommand{\lt}{<}\) \(\newcommand{\gt}{>}\) \(\newcommand{\amp}{&}\) \(\definecolor{fillinmathshade}{gray}{0.9}\)Electrochemical Impedance Spectroscopy (EIS) is a highly sensitive characterization technique used to establish the electrical response of chemical systems in a nondestructive manner. EIS systems characterize the time response of chemical systems using low amplitude alternating current (AC) voltages over a range of frequencies. Using an electrode setup consisting of a working, reference, and counter electrodes a known voltage is passed from the working electrode through an electrolytic solution and into the counter electrode. Quantitative measurements are produced by the EIS and enable the evaluation of small scale chemical mechanisms at the electrode interface and within the electrolytic solution. Therefore, EIS is useful in determining a wide range of dielectric and electrical properties of components in research fields studying batteries, corrosion, etc.
Experimental Set Up
An electrochemical cell is used to house the chemical reaction and is electrically connected to the electrochemical spectrometer to obtain the electrical response of an electrolytic solution. EIS systems are operated using computer programs specifically designed for EIS testing. Therefore, prior to conducting an EIS experiment it is essential that all components of the system be attained.
Generally, EIS studies utilize a three electrode mode which is comprised of a working electrode (the sample material), a counter electrode (commonly graphite or platinum), and a reference electrode. While electrode geometries may vary the general experimental setup remains similar to the procedure outlined below.
The three electrodes are mounted on an electrode stage and secured. The electrolytic solution is prepared and transferred to the sample container. A metallic sample container would provide additional pathways for electrons during experimentation leading to a reduction in the EIS current response as electrons move into the metal rather than the reference electrodes. Therefore, the sample container should be composed of an insulating material, such as glass or plastic, which will not interfere with the transfer of electrons during testing. The electrode mount is then placed on the sample container such that a portion of each electrode is submerged in the electrolytic solution.

Four leads are used to attach the three electrodes to the EIS frequency response analyzer. A working lead and a counter lead are used to carry current, whereas the working sense lead and reference leads are used to sense voltage. The working lead and working sense lead connect the exposed end of the working electrode to the EIS. The reference lead is attached to the reference electrode and the counter lead is connected to the counter electrode. The fourth lead is recommended to ground the system during testing. Once all leads are connected, the EIS system is setup and ready for testing.
Complex Impedance
Ohm's Law is used within many common electrical circuits to define resistance [R]:
\[E=I*R\]
However, this relationship between current [I] and potential [E] only applies to direct current (DC) applications and some unique cases of AC where frequency is given at 0 Hz. Potential values are measured in voltage [V], current is measured in amperes [A], and resistance is measured in ohms [Ω]. The more inclusive AC analog to Ohm’s Law is given by:
\[E=I*Z\]
when frequency is non-zero and impedance [Z] is given in ohms. Although only present in alternating current (AC) systems, impedance works in a similar manner as resistance to oppose the flow of current or movement of electrons. Resistance is less restricted by the system mode and can occur in both direct current (DC) or AC systems. Therefore, impedance is the total electron opposition within a circuit and often presented as a complex number that takes into account contributions from resistors, capacitors, and inductors.
The complex impedance can be presented in both polar and Cartesian coordinates.
Polar Form: 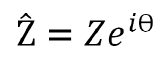
Using the polar form of complex impedance, the magnitude of impedance is given by Z and the phase difference is given by Ѳ which aligns with Figure 1. In this equation, i is the imaginary unit. However, complex impedance can also be used in terms of Cartesian coordinates.
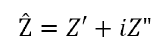
Cartesian Form: 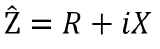
The Cartesian form reveals that resistance (R) is the real component of the complex impedance, where as X is the imaginary portion. X is the reactance which is determined by taking the sum of inductance and capacitance. Therefore, expressing impedance as a complex number designates resistance as the real component and the sum of capacitance and inductance as the imaginary component or reactance.
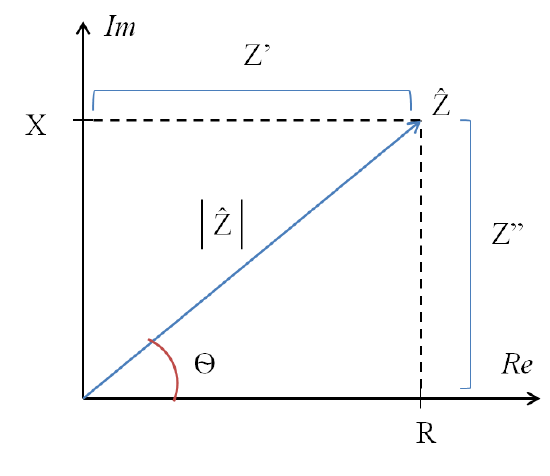
In Figure 2, complex impedance is represented as the vector Z which consists of both magnitude (|Z|) and phase (Ѳ). The complex form of impedance evaluates the voltage-current ratio for a single response at a designated frequency [w]. This response is given in terms of ohms and presented using the polar form in order to easily relate voltage and current amplitude and phase.
- Magnitude= Ratio of voltage amplitude to current amplitude
- Phase = Distance the response current is shifted ahead of the voltage
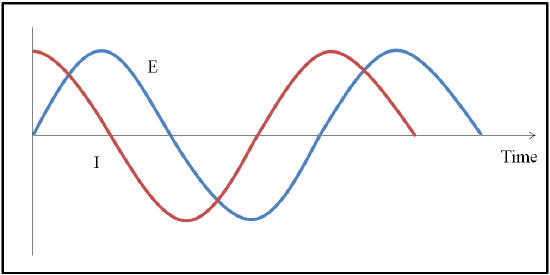
Variations in the ability of capacitors and inductors to restrict the flow of electrons between AC circuits are expected. Therefore, the amount that resultant current response [I] determined using EIS will deviate from the input potential [E] based on how the sample interacts with the applied voltage. The time dependent responses of phase and amplitude changes can reveal how electrons interact with the electrode surface as well as information about ion size or type.
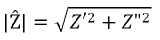
Utilizing simple geometric properties, the impedance vector can be rewritten as:
where Z’ is the real component and Z” is the imaginary component. The absolute magnitude of the impedance component can therefore be given using the quadratic formula.
Furthermore, the phase angle can be defined as:
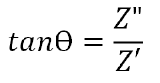
Electrode material properties and ionic properties of the electrolyte will alter the real and imaginary impedance components. Therefore, a repeatable evaluation method is required in EIS testing.
Circuit Analog Models
Due to the complex nature of impedance results, simplified models are required to better understand the relationships established within EIS. Therefore, circuit elements are used to describe impedance phenomenon within EIS systems. The relationships between circuit and impedance elements are listed below.
Table 1. Relationship between circuit and impedance equivalent values.
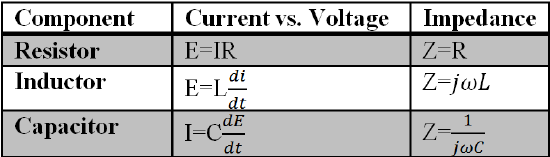
In Table 1, w is the frequency, C is the capacitance, L is the inductance, j is the complex component, t is time and E, Z, R, I are all consistent with the previously established relationships for potential, impedance, resistance, and current respectively.
The most common circuit analog model is the simplified Randles Cell that represents the equivalent circuit for the interface between electrolyte and electrode for a single electrochemical cell. Within this circuit the uncompensated electrolyte resistance (Rs), polarization resistance (Rp), and double layer capacitance (Cdl) are all taken into account.
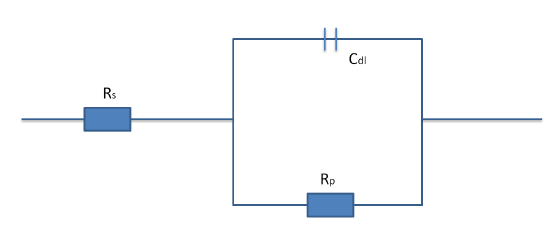
Simplifying the components of the EIS system allows for a comprehensive understanding of how the various component interact with the chemical and electrical system properties. Although, Randles Cell does not accurately model all electrochemical systems it serves as a stepping stone for more complex models.
Electrolyte Resistance
When voltage is passed through the electrolytic solution, from the working electrode to the reference electrode, ions act as resistors to impede electron flow. The resulting voltage recorded by the reference electrode is used to determine the electrolyte resistance by comparing the input and output voltages. Table 1 reveals that impedance and resistance are directly related. As such the electrolyte resistance will directly affect the electrochemical cell impedance.
Properties such as ionic concentration, ion type, temperature, and current carrier geometry will affect the resistance of ionic solutions. The current carrier geometry refers to the electrode or material used within the EIS to transport current within the cell. When the current carrier area is fixed the resistance is defined as,
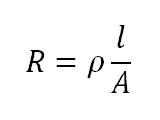
where A is the fixed area, l is the length a uniform amount of current is carried, and p is the solution resistivity. However, because conductivity, k, is more widely used the reciprocal of resistivity is taken to produce a functional solution resistance equation:
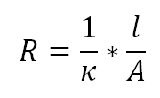
Therefore, the solution resistance can be found by recording the conductivity of an electrolyte and calculating the second electrolyte resistance equation. If experimental determination of conductivity cannot be attained, standard chemical handbooks present k values for certain solutions. Standard units for conductivity are given as Seimens per meter (S/m) or the reciprocal of ohm (1/ohm).
However, ideal conditions are typically not achievable and therefore the solution resistance equation above only holds as an estimate of the resistance produced. The experimental solution resistance is expected to deviate from this model.
Double Layer Capacitance
Electrical double layer capacitance (Cdl) refers to the polarization of ionic charge at the surface of EIS system electrodes. The amount of charge build up is directly related to the electrode surface area and ion size. Therefore, the larger the electrode surface area the higher the double layer capacitance. A reasonable approximation for this relationship assumes that an electrode area of 1 cm2 will lead to a capacitance within the range of 20 to 60 µF.
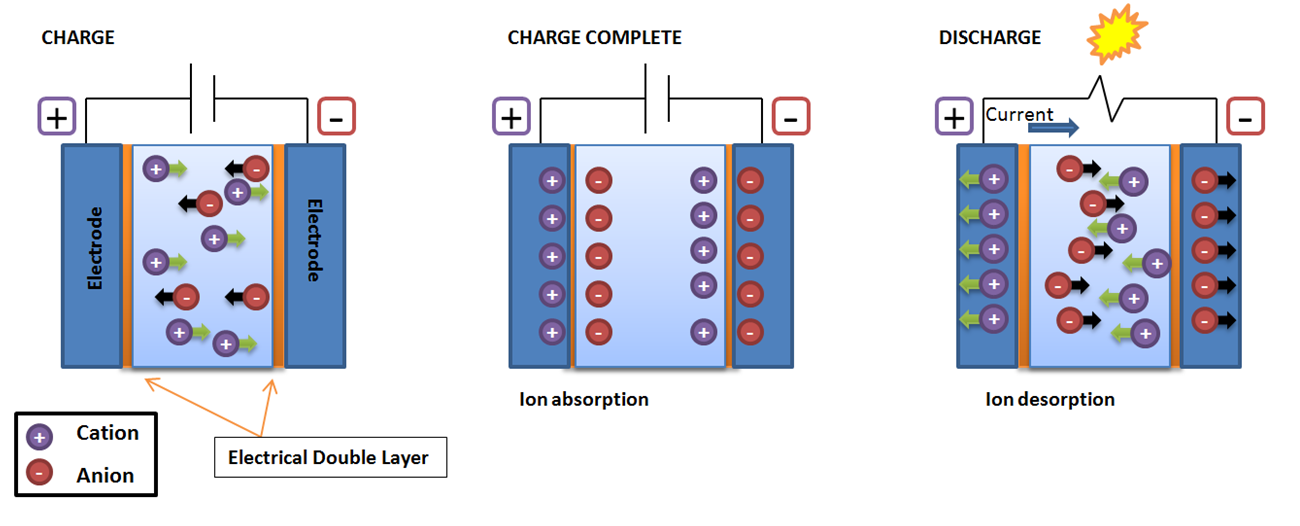
When a potential difference is introduced to the electrochemical cell, charged ions will begin to move toward the electrode of opposite charge. The interface between the electrode and the electrolyte is known as the electrical double layer. Therefore, as a result of ion absorption when the electrode charging is complete the cell acts as a capacitor to store charge. Conversely, ion desorption occurs during discharging when an opposing current in produced and ions are pushed away from one another. When the energy produced during discharge is high enough light may be produced.
Polarization Resistance
Polarization resistance refers to restriction of charge transfer at the interface between the electrode and the electrolyte. Polarization of an electrode occurs when the potential is pushed out of equilibrium through the application of an external voltage. As the system attempts to restore equilibrium negative charge may be transferred through electrochemical reactions causing current flow at the electrode surface and into the electrolyte. Kinetics of the reactions and diffusion of reactants will alter how the current interacts with the electrode which controls the magnitude of the polarization resistance.
Polarization resistance assesses the changes in the applied potential (E) and compares those values with the resulting polarization current (i).
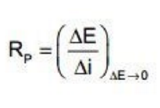
When polarization resistance of a metal is large the material is expected to have a high corrosion resistance and a low corrosion resistance when small. Therefore, the uniform corrosion rate is inversely proportional to the polarization resistance.
Nyquist Plot
Nyquist plots are often used to evaluate electrochemical impedance data. Within these plots the real impedance data is graphed along the x-axis whereas the negative imaginary data is plotted along the y-axis. Nyquist plots utilize the electrical components established by equivalent circuits to characterize the frequency dependence of impedance responses.
. 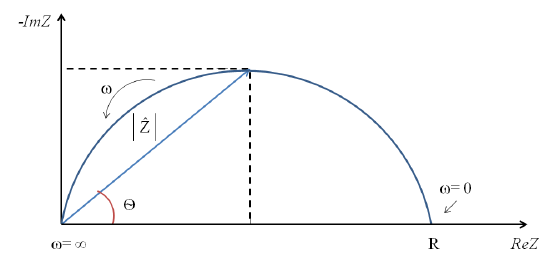
Figure 6. Relationship between Nyquist plot components.
At the high frequency intercept, or near the plot origin, the real axis value gives the solution resistance. The low frequency intercept of the real axis provides a summation of the polarization resistance and the solution resistance. Therefore, the semicircle diameter will equal the polarization resistance.
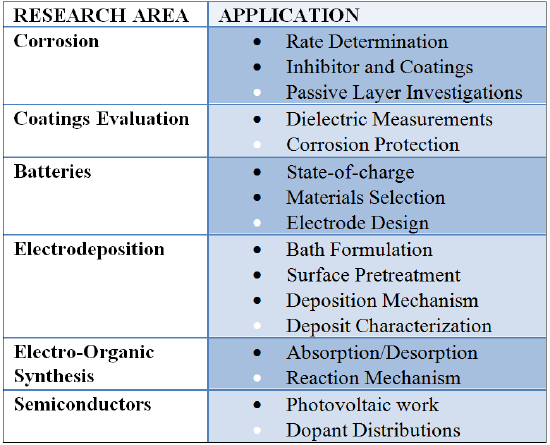
EIS Applications
EIS is a simple method for translating complicated chemical responses to an electronic mode that can be interpreted and utilized in future studies. As seen with the Randles Cell, these responses are more precisely represented through use of an analogous electronic circuit which takes into account resistance and capacitance. Therefore, the impedance produced during electrochemical experimentation can be evaluated through use of one or more equivalent circuits. Although determining analogous circuits may be difficult, establishing an accurate model can lead to verification of mechanical modes which occur in a given system. These techniques can be used in numerous research areas for a wide range of applications.
Practice Problems
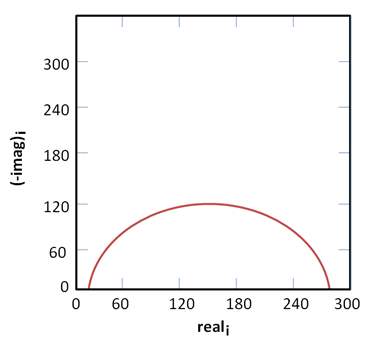
Problem 1.
The Nyquist plot for simplified Randles cell assumes that a 1 cm2 electrode experiences 1mm uniform corrosion per year. Using the figure below along with the knowledge that the capacitance is 40 µF/cm2 and the solution resistance, Rs, is 20 Ω, what is the polarization resistance, Rp?
Problem 2.
An electrode is 35 mm tall and 100 mm wide. What is the lowest expected capacitance for the electrical double layer?
Problem 3.
During an experiment, the EIS recorded a large change in potential and a small change in polarization current. What is the expected outcome for corrosion resistance of the working electrode?
Practice Solutions
Solution 1.
Rp = 250 Ω
Solution 2.
Cdl = 700 uF
Solution 3.
The working electrode is expected to have a low corrosion resistance as a result since polarization resistance is inversely proportional to corrosion resistance.
References
[1] “Basics of Electrochemical Impedance Spectroscopy,” Princeton Applied Research (2003) 1-13.
[2] Beasley, C., “Electrochemical Impedance Spectroscopy and its Applications to Battery Analysis,” PlugVolt (2015).
[3] Cook, D., “Getting Started with Your First Experiment: EIS300 Electrochemical Impedence Techniquies- Potentiostatic Electrochemical Impedance Spectroscopy,” Gamry (2014) 1.
[4] Lasia, A. “Electrochemical Impedance Spectroscopy and its Applications,” Modern Aspects of Electrochemistry (1999) 143-248.
[5] "Polarization Resistance," Corrosionpedia (2015) 1-2.
[6] Zelinka, S. L., et. al., "Electrochemical impedance spectroscopy (EIS) as a tool for measuring corrosion of polymer coated fasteners used in treated wood," FPL 59 (2009) 77-82.
Contributors
- Katherine Acord [University of California, Davis]